Races in Carol Stream, Illinois (IL) Detailed Stats
Data:
Races - White alone (%)
Races - White alone (% change since 2000)
Races - Black alone (%)
Races - Black alone (% change since 2000)
Races - American Indian alone (%)
Races - American Indian alone (% change since 2000)
Races - Asian alone (%)
Races - Asian alone (% change since 2000)
Races - Hispanic (%)
Races - Hispanic (% change since 2000)
Races - Native Hawaiian and Other Pacific Islander alone (%)
Races - Native Hawaiian and Other Pacific Islander alone (% change since 2000)
Races - Two or more races(%)
Races - Two or more races(% change since 2000)
Races - Other race alone (%)
Races - Other race alone (% change since 2000)
Racial diversity
Place of birth - Born in state of residence (%)
Place of birth - Born in state of residence (%) - White
Place of birth - Born in state of residence (%) - Black or African American
Place of birth - Born in state of residence (%) - Asian
Place of birth - Born in state of residence (%) - Hispanic or Latino
Place of birth - Born in state of residence (%) - American Indian and Alaska Native
Place of birth - Born in state of residence (%) - Multirace
Place of birth - Born in state of residence (%) - Other Race
Place of birth - Born in other state (%)
Place of birth - Born in other state (%) - White
Place of birth - Born in other state (%) - Black or African American
Place of birth - Born in other state (%) - Asian
Place of birth - Born in other state (%) - Hispanic or Latino
Place of birth - Born in other state (%) - American Indian and Alaska Native
Place of birth - Born in other state (%) - Multirace
Place of birth - Born in other state (%) - Other Race
Place of birth - Native, outside of US (%)
Place of birth - Native, outside of US (%) - White
Place of birth - Native, outside of US (%) - Black or African American
Place of birth - Native, outside of US (%) - Asian
Place of birth - Native, outside of US (%) - Hispanic or Latino
Place of birth - Native, outside of US (%) - American Indian and Alaska Native
Place of birth - Native, outside of US (%) - Multirace
Place of birth - Native, outside of US (%) - Other Race
Place of birth - Foreign born (%)
Place of birth - Foreign born (%) - White
Place of birth - Foreign born (%) - Black or African American
Place of birth - Foreign born (%) - Asian
Place of birth - Foreign born (%) - Hispanic or Latino
Place of birth - Foreign born (%) - American Indian and Alaska Native
Place of birth - Foreign born (%) - Multirace
Place of birth - Foreign born (%) - Other Race
Residents speaking English at home (%)
Residents speaking English at home - Born in the United States (%)
Residents speaking English at home - Native, born elsewhere (%)
Residents speaking English at home - Foreign born (%)
Residents speaking Spanish at home (%)
Residents speaking Spanish at home - Born in the United States (%)
Residents speaking Spanish at home - Native, born elsewhere (%)
Residents speaking Spanish at home - Foreign born (%)
Residents speaking other language at home (%)
Residents speaking other language at home - Born in the United States (%)
Residents speaking other language at home - Native, born elsewhere (%)
Residents speaking other language at home - Foreign born (%)
Marital status - Never married (%)
Marital status - Now married (%)
Marital status - Separated (%)
Marital status - Widowed (%)
Marital status - Divorced (%)
Ancestries Reported - Arab (%)
Ancestries Reported - Czech (%)
Ancestries Reported - Danish (%)
Ancestries Reported - Dutch (%)
Ancestries Reported - English (%)
Ancestries Reported - French (%)
Ancestries Reported - French Canadian (%)
Ancestries Reported - German (%)
Ancestries Reported - Greek (%)
Ancestries Reported - Hungarian (%)
Ancestries Reported - Irish (%)
Ancestries Reported - Italian (%)
Ancestries Reported - Lithuanian (%)
Ancestries Reported - Norwegian (%)
Ancestries Reported - Polish (%)
Ancestries Reported - Portuguese (%)
Ancestries Reported - Russian (%)
Ancestries Reported - Scotch-Irish (%)
Ancestries Reported - Scottish (%)
Ancestries Reported - Slovak (%)
Ancestries Reported - Subsaharan African (%)
Ancestries Reported - Swedish (%)
Ancestries Reported - Swiss (%)
Ancestries Reported - Ukrainian (%)
Ancestries Reported - United States (%)
Ancestries Reported - Welsh (%)
Ancestries Reported - West Indian (%)
Ancestries Reported - Other (%)
Geographical mobility - Same house 1 year ago (%)
Geographical mobility - Same house 1 year ago (%) - White
Geographical mobility - Same house 1 year ago (%) - Black or African American
Geographical mobility - Same house 1 year ago (%) - Asian
Geographical mobility - Same house 1 year ago (%) - Hispanic or Latino
Geographical mobility - Same house 1 year ago (%) - American Indian and Alaska Native
Geographical mobility - Same house 1 year ago (%) - Multirace
Geographical mobility - Same house 1 year ago (%) - Other Race
Geographical mobility - Moved within same county (%)
Geographical mobility - Moved within same county (%) - White
Geographical mobility - Moved within same county (%) - Black or African American
Geographical mobility - Moved within same county (%) - Asian
Geographical mobility - Moved within same county (%) - Hispanic or Latino
Geographical mobility - Moved within same county (%) - American Indian and Alaska Native
Geographical mobility - Moved within same county (%) - Multirace
Geographical mobility - Moved within same county (%) - Other Race
Geographical mobility - Moved from different county within same state (%)
Geographical mobility - Moved from different county within same state (%) - White
Geographical mobility - Moved from different county within same state (%) - Black or African American
Geographical mobility - Moved from different county within same state (%) - Asian
Geographical mobility - Moved from different county within same state (%) - Hispanic or Latino
Geographical mobility - Moved from different county within same state (%) - American Indian and Alaska Native
Geographical mobility - Moved from different county within same state (%) - Multirace
Geographical mobility - Moved from different county within same state (%) - Other Race
Geographical mobility - Moved from different state (%)
Geographical mobility - Moved from different state (%) - White
Geographical mobility - Moved from different state (%) - Black or African American
Geographical mobility - Moved from different state (%) - Asian
Geographical mobility - Moved from different state (%) - Hispanic or Latino
Geographical mobility - Moved from different state (%) - American Indian and Alaska Native
Geographical mobility - Moved from different state (%) - Multirace
Geographical mobility - Moved from different state (%) - Other Race
Geographical mobility - Moved from abroad (%)
Geographical mobility - Moved from abroad (%) - White
Geographical mobility - Moved from abroad (%) - Black or African American
Geographical mobility - Moved from abroad (%) - Asian
Geographical mobility - Moved from abroad (%) - Hispanic or Latino
Geographical mobility - Moved from abroad (%) - American Indian and Alaska Native
Geographical mobility - Moved from abroad (%) - Multirace
Geographical mobility - Moved from abroad (%) - Other Race
Place of birth for the foreign-born population - Ireland (%)
Place of birth for the foreign-born population - Denmark (%)
Place of birth for the foreign-born population - Norway (%)
Place of birth for the foreign-born population - Sweden (%)
Place of birth for the foreign-born population - United Kingdom (%)
Place of birth for the foreign-born population - England (%)
Place of birth for the foreign-born population - Scotland (%)
Place of birth for the foreign-born population - Other Northern Europe (%)
Place of birth for the foreign-born population - Austria (%)
Place of birth for the foreign-born population - Belgium (%)
Place of birth for the foreign-born population - France (%)
Place of birth for the foreign-born population - Germany (%)
Place of birth for the foreign-born population - Netherlands (%)
Place of birth for the foreign-born population - Switzerland (%)
Place of birth for the foreign-born population - Other Western Europe (%)
Place of birth for the foreign-born population - Greece (%)
Place of birth for the foreign-born population - Italy (%)
Place of birth for the foreign-born population - Portugal (%)
Place of birth for the foreign-born population - Spain (%)
Place of birth for the foreign-born population - Other Southern Europe (%)
Place of birth for the foreign-born population - Albania (%)
Place of birth for the foreign-born population - Belarus (%)
Place of birth for the foreign-born population - Bosnia and Herzegovina (%)
Place of birth for the foreign-born population - Bulgaria (%)
Place of birth for the foreign-born population - Croatia (%)
Place of birth for the foreign-born population - Czechoslovakia (%)
Place of birth for the foreign-born population - Hungary (%)
Place of birth for the foreign-born population - Latvia (%)
Place of birth for the foreign-born population - Lithuania (%)
Place of birth for the foreign-born population - North Macedonia (Macedonia) (%)
Place of birth for the foreign-born population - Moldova (%)
Place of birth for the foreign-born population - Poland (%)
Place of birth for the foreign-born population - Romania (%)
Place of birth for the foreign-born population - Russia (%)
Place of birth for the foreign-born population - Serbia (%)
Place of birth for the foreign-born population - Ukraine (%)
Place of birth for the foreign-born population - Other Eastern Europe (%)
Place of birth for the foreign-born population - China (%)
Place of birth for the foreign-born population - Hong Kong (%)
Place of birth for the foreign-born population - Taiwan (%)
Place of birth for the foreign-born population - Japan (%)
Place of birth for the foreign-born population - Korea (%)
Place of birth for the foreign-born population - Other Eastern Asia (%)
Place of birth for the foreign-born population - Afghanistan (%)
Place of birth for the foreign-born population - Bangladesh (%)
Place of birth for the foreign-born population - India (%)
Place of birth for the foreign-born population - Iran (%)
Place of birth for the foreign-born population - Kazakhstan (%)
Place of birth for the foreign-born population - Nepal (%)
Place of birth for the foreign-born population - Pakistan (%)
Place of birth for the foreign-born population - Sri Lanka (%)
Place of birth for the foreign-born population - Uzbekistan (%)
Place of birth for the foreign-born population - Other South Central Asia (%)
Place of birth for the foreign-born population - Burma (%)
Place of birth for the foreign-born population - Cambodia (%)
Place of birth for the foreign-born population - Indonesia (%)
Place of birth for the foreign-born population - Laos (%)
Place of birth for the foreign-born population - Malaysia (%)
Place of birth for the foreign-born population - Philippines (%)
Place of birth for the foreign-born population - Singapore (%)
Place of birth for the foreign-born population - Thailand (%)
Place of birth for the foreign-born population - Vietnam (%)
Place of birth for the foreign-born population - Other South Eastern Asia (%)
Place of birth for the foreign-born population - Armenia (%)
Place of birth for the foreign-born population - Iraq (%)
Place of birth for the foreign-born population - Israel (%)
Place of birth for the foreign-born population - Jordan (%)
Place of birth for the foreign-born population - Kuwait (%)
Place of birth for the foreign-born population - Lebanon (%)
Place of birth for the foreign-born population - Saudi Arabia (%)
Place of birth for the foreign-born population - Syria (%)
Place of birth for the foreign-born population - Turkey (%)
Place of birth for the foreign-born population - Yemen (%)
Place of birth for the foreign-born population - Other Western Asia (%)
Place of birth for the foreign-born population - Eritrea (%)
Place of birth for the foreign-born population - Ethiopia (%)
Place of birth for the foreign-born population - Kenya (%)
Place of birth for the foreign-born population - Somalia (%)
Place of birth for the foreign-born population - Uganda (%)
Place of birth for the foreign-born population - Zimbabwe (%)
Place of birth for the foreign-born population - Other Eastern Africa (%)
Place of birth for the foreign-born population - Cameroon (%)
Place of birth for the foreign-born population - Congo (%)
Place of birth for the foreign-born population - Democratic Republic of Congo (Zaire) (%)
Place of birth for the foreign-born population - Other Middle Africa (%)
Place of birth for the foreign-born population - Egypt (%)
Place of birth for the foreign-born population - Morocco (%)
Place of birth for the foreign-born population - Sudan (%)
Place of birth for the foreign-born population - Other Northern Africa (%)
Place of birth for the foreign-born population - South Africa (%)
Place of birth for the foreign-born population - Other Southern Africa (%)
Place of birth for the foreign-born population - Cabo Verde (%)
Place of birth for the foreign-born population - Ghana (%)
Place of birth for the foreign-born population - Liberia (%)
Place of birth for the foreign-born population - Nigeria (%)
Place of birth for the foreign-born population - Senegal (%)
Place of birth for the foreign-born population - Sierra Leone (%)
Place of birth for the foreign-born population - Other Western Africa (%)
Place of birth for the foreign-born population - Australia (%)
Place of birth for the foreign-born population - New Zealand (%)
Place of birth for the foreign-born population - Fiji (%)
Place of birth for the foreign-born population - Micronesia (%)
Place of birth for the foreign-born population - Bahamas (%)
Place of birth for the foreign-born population - Barbados (%)
Place of birth for the foreign-born population - Cuba (%)
Place of birth for the foreign-born population - Dominica (%)
Place of birth for the foreign-born population - Dominican Republic (%)
Place of birth for the foreign-born population - Grenada (%)
Place of birth for the foreign-born population - Haiti (%)
Place of birth for the foreign-born population - Jamaica (%)
Place of birth for the foreign-born population - St. Vincent and the Grenadines (%)
Place of birth for the foreign-born population - Trinidad and Tobago (%)
Place of birth for the foreign-born population - West Indies (%)
Place of birth for the foreign-born population - Other Caribbean (%)
Place of birth for the foreign-born population - Belize (%)
Place of birth for the foreign-born population - Costa Rica (%)
Place of birth for the foreign-born population - El Salvador (%)
Place of birth for the foreign-born population - Guatemala (%)
Place of birth for the foreign-born population - Honduras (%)
Place of birth for the foreign-born population - Mexico (%)
Place of birth for the foreign-born population - Nicaragua (%)
Place of birth for the foreign-born population - Panama (%)
Place of birth for the foreign-born population - Other Central America (%)
Place of birth for the foreign-born population - Argentina (%)
Place of birth for the foreign-born population - Bolivia (%)
Place of birth for the foreign-born population - Brazil (%)
Place of birth for the foreign-born population - Chile (%)
Place of birth for the foreign-born population - Colombia (%)
Place of birth for the foreign-born population - Ecuador (%)
Place of birth for the foreign-born population - Guyana (%)
Place of birth for the foreign-born population - Peru (%)
Place of birth for the foreign-born population - Uruguay (%)
Place of birth for the foreign-born population - Venezuela (%)
Place of birth for the foreign-born population - Other South America (%)
Place of birth for the foreign-born population - Canada (%)
Place of birth for the foreign-born population - Other Northern America (%)
Place of birth for the foreign-born population - Other (%)
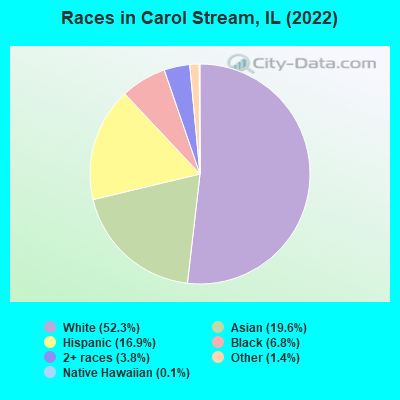
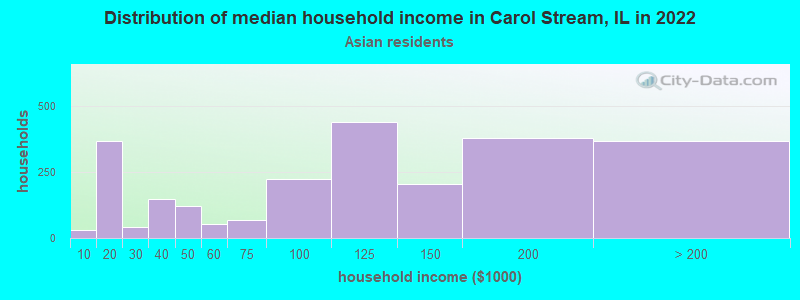
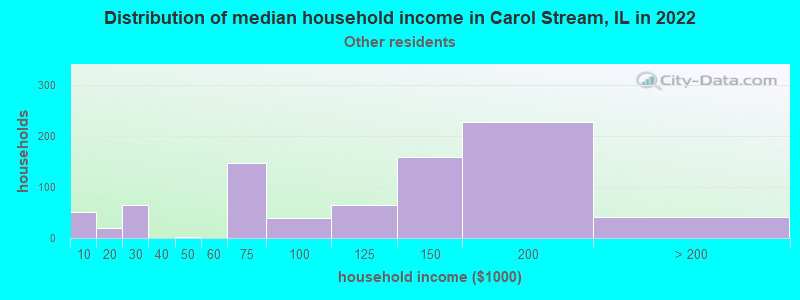
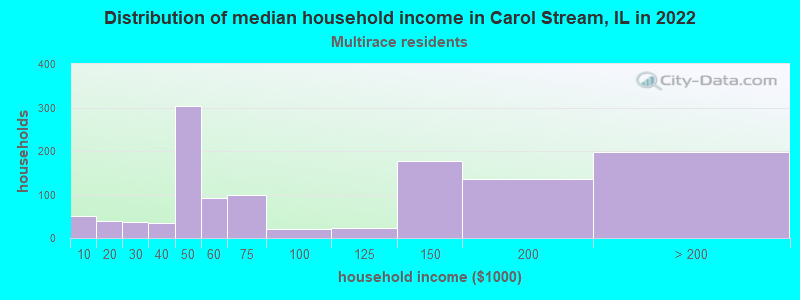
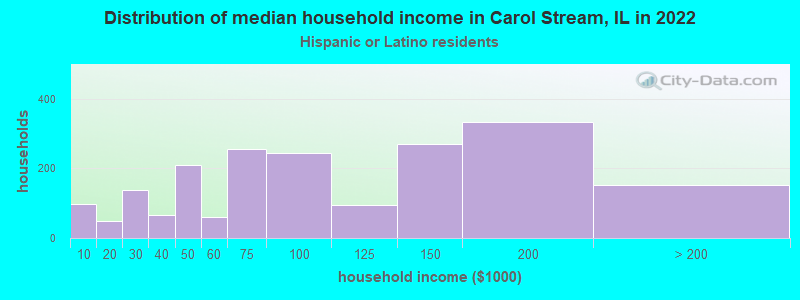
According to 2022 data, the most numerous races in Carol Stream, IL are White alone (20,522 residents), Hispanic (6,620 residents), and Black alone (2,654 residents). 63.8% of Carol Stream residents speak English at home. 26.4% of Carol Stream, IL residents are foreign-born (14.2% born in Asia, 6.4% born in Latin America, 4.2% born in Europe), which is 46.9% greater than the foreign-born rate of 14.0% across the entire state of Illinois.
Race distribution in Carol Stream
2000 2022
8,424,140 67.8% White alone 1,856,152 14.9% Black alone 1,530,262 12.3% Hispanic 419,916 3.4% Asian alone 153,996 1.2% Two or more races 13,479 0.1% Other race alone 18,232 0.1% American Indian alone 3,116 0.03% Native Hawaiian and Other
7,356,301 58.5% White alone 2,299,726 18.3% Hispanic 1,660,423 13.2% Black alone 747,296 5.9% Asian alone 458,599 3.6% Two or more races 45,386 0.4% Other race alone 10,405 0.08% American Indian alone 3,896 0.03% Native Hawaiian and Other
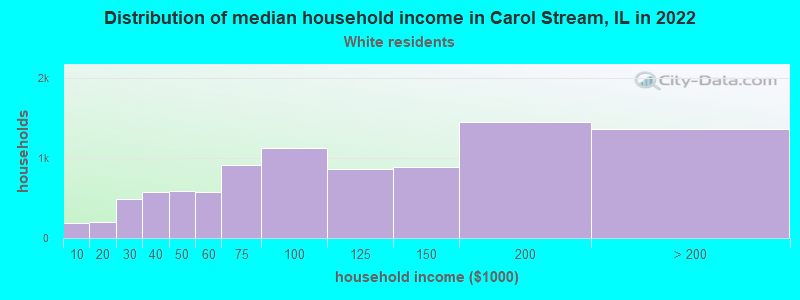
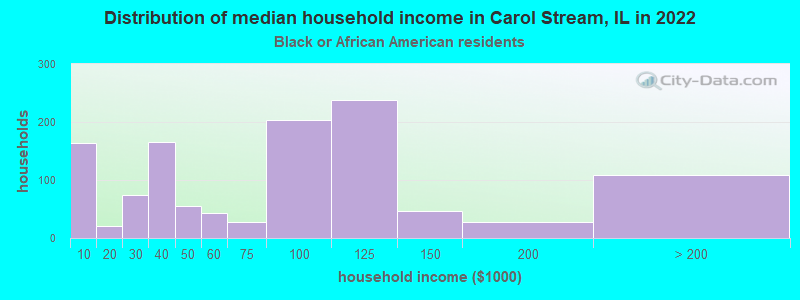
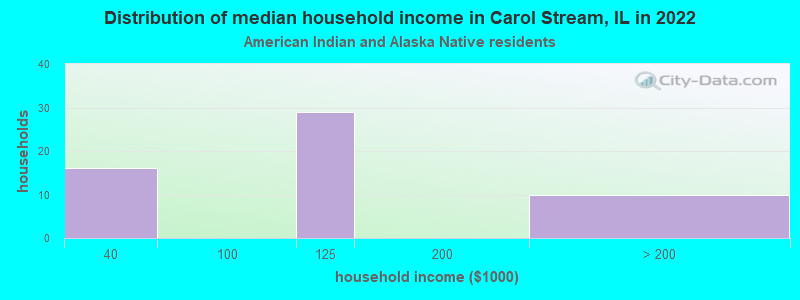
Income and house value in Carol Stream Median household income in 2022 $99,912 White non-Hispanic householders$72,601 Black householders$96,941 American Indian and Alaska Native householders$112,429 Asian householders$111,018 Some other race householders$64,063 Two or more races householders$78,284 Hispanic or Latino race householdersMedian 2022 house value $306,013 White Non-Hispanic householders$297,703 Black or African American householders $344,852 Asian householders$293,549 Some other race householders$254,710 Two or more races householders$299,149 Hispanic or Latino householders
Median age by race in Carol Stream
45.4 Median age for White residents40.9 49.8 34.7 Median age for Black or African American residents30.3 34.9 30.3 Median age for American Indian / Alaska Native residents50.5 22.9 42.3 Median age for Asian residents42.1 42.2 39.7 Median age for Native Hawaiian / Pacific Islander residents-658,536,584.7 -576,015,108.0 28.5 Median age for Other race residents29.3 29.6 26.1 Median age for Two or more races residents27.5 24.1 47.2 Median age for White alone residents42.7 52.0 28.9 Median age for Hispanic or Latino residents26.4 29.3
Owner/renter occupied households by race in Carol Stream
House owners and renters - White residents 6,813 74.9% Owner occupied2,277 25.1% Renter occupiedHouse owners and renters - Black or African American residents 254 23.8% Owner occupied814 76.2% Renter occupiedHouse owners and renters - American Indian / Alaska Native residents 26 77.8% Owner occupied7 22.2% Renter occupiedHouse owners and renters - Asian residents 1,938 78.8% Owner occupied522 21.2% Renter occupiedHouse owners and renters - Other race residents 325 43.8% Owner occupied417 56.2% Renter occupiedHouse owners and renters - Two or more races residents 910 72.1% Owner occupied353 27.9% Renter occupiedHouse owners and renters - White alone residents 6,535 74.9% Owner occupied2,191 25.1% Renter occupiedHouse owners and renters - Hispanic or Latino residents 1,169 58.5% Owner occupied830 41.5% Renter occupied
Language usage in Carol Stream
English speakers - Total 63.8% of residents of Carol Stream speak English at home.
13.1% of residents speak Spanish at home 3,047 62.3% Speak English very well1,846 37.7% Speak English less than very well23.1% of residents speak other language at home 4,654 54.1% Speak English very well3,952 45.9% Speak English less than very well
English speakers - Born in the United States 88.3% of residents of Carol Stream speak English at home.
6.6% of residents speak Spanish at home 293 86.7% Speak English very well45 13.3% Speak English less than very well4.0% of residents speak other language at home 194 93.7% Speak English very well13 6.3% Speak English less than very well
English speakers - Native, born elsewhere 32.4% of residents of Carol Stream speak English at home.
33.4% of residents speak Spanish at home 125 55.1% Speak English very well102 44.9% Speak English less than very well35.8% of residents speak other language at home 237 97.5% Speak English very well6 2.5% Speak English less than very well
English speakers - Foreign-born 12.4% of residents of Carol Stream speak English at home.
22.2% of residents speak Spanish at home 774 33.9% Speak English very well1,507 66.1% Speak English less than very well65.3% of residents speak other language at home 3,103 46.2% Speak English very well3,612 53.8% Speak English less than very well
White (Caucasian) - Speak only English Native:
93.8% (17,147)Foreign-born:
17.3% (428)
White (Caucasian) - Speak another language Native:
6.1% (1,116)Foreign-born:
82.6% (2,044)
Black or African American - Speak only English Native:
99.7% (2,383)Foreign-born:
91.3% (137)
Black or African American - Speak another language Native:
1.3% (30)Foreign-born:
73.3% (110)
American Indian / Alaska Native - Speak another language Native:
100.0% (92)Foreign-born:
100.0% (72)
Asian - Speak only English Native:
48.9% (1,048)Foreign-born:
8.5% (442)
Asian - Speak another language Native:
48.7% (1,045)Foreign-born:
91.6% (4,775)
Native Hawaiian / Pacific Islander - Speak another language Native:
30.5% (14)Foreign-born:
100.0% (30)
Other race - Speak only English Native:
22.0% (355)Foreign-born:
7.6% (101)
Other race - Speak another language Native:
75.5% (1,218)Foreign-born:
92.1% (1,228)
Two or more races - Speak only English Native:
59.4% (1,671)Foreign-born:
10.4% (113)
Two or more races - Speak another language Native:
41.7% (1,172)Foreign-born:
89.6% (968)
White alone - Speak only English Native:
95.5% (16,734)Foreign-born:
16.4% (387)
White alone - Speak another language Native:
4.5% (791)Foreign-born:
83.5% (1,966)
Hispanic or Latino - Speak only English Native:
32.1% (1,192)Foreign-born:
7.1% (171)
Hispanic or Latino - Speak another language Native:
68.3% (2,536)Foreign-born:
92.8% (2,216)
Foreign-born residents in Carol Stream 10,344 residents are foreign born (14.2% Asia , 6.4% Latin America , 4.2% Europe ).
This city:
26.4%Illinois:
14.1%
Marital status for residents in Carol Stream Marital status - White (Caucasian) population 15 years and over
Males 34.0% Never married57.0% Now married0.1% Separated1.6% Widowed7.4% DivorcedFemales 23.3% Never married53.5% Now married0.1% Separated9.8% Widowed13.3% DivorcedWomen who gave birth in the past 12 months Now married:
84.3% (185)Unmarried:
15.7% (34)
Women who did not give birth in the past 12 months Now married:
45.6% (1,857)Unmarried:
54.4% (2,212)
Marital status - Black or African American population 15 years and over
Males 53.6% Never married31.3% Now married1.2% Separated0.0% Widowed13.9% DivorcedFemales 53.7% Never married18.3% Now married3.5% Separated6.4% Widowed18.0% DivorcedWomen who did not give birth in the past 12 months Now married:
18.1% (165)Unmarried:
81.9% (746)
Marital status - American Indian / Alaska Native population 15 years and over
Males 33.3% Never married52.1% Now married0.0% Separated0.0% Widowed14.6% DivorcedFemales 72.9% Never married27.1% Now married0.0% Separated0.0% Widowed0.0% DivorcedWomen who did not give birth in the past 12 months Now married:
11.4% (13)Unmarried:
88.6% (103)
Marital status - Asian population 15 years and over
Males 31.0% Never married65.7% Now married0.5% Separated0.0% Widowed2.8% DivorcedFemales 23.1% Never married67.6% Now married0.0% Separated7.6% Widowed1.8% DivorcedWomen who gave birth in the past 12 months Now married:
81.7% (155)Unmarried:
18.3% (35)
Women who did not give birth in the past 12 months Now married:
63.3% (1,027)Unmarried:
36.7% (595)
Marital status - Native Hawaiian / Pacific Islander population 15 years and over
Males 0.0% Never married100.0% Now married0.0% Separated0.0% Widowed0.0% DivorcedFemales 55.0% Never married45.0% Now married0.0% Separated0.0% Widowed0.0% DivorcedWomen who did not give birth in the past 12 months Now married:
45.0% (27)Unmarried:
55.0% (33)
Marital status - Other race population 15 years and over
Males 43.4% Never married47.9% Now married0.0% Separated0.0% Widowed8.8% DivorcedFemales 31.7% Never married49.3% Now married6.8% Separated4.2% Widowed8.0% DivorcedWomen who gave birth in the past 12 months Now married:
100.0% (109)Unmarried:
0.0% (0)
Women who did not give birth in the past 12 months Now married:
51.5% (544)Unmarried:
48.5% (512)
Marital status - Two or more races population 15 years and over
Males 36.2% Never married40.7% Now married0.0% Separated0.2% Widowed23.0% DivorcedFemales 40.4% Never married41.0% Now married0.0% Separated5.9% Widowed12.8% DivorcedWomen who gave birth in the past 12 months Now married:
100.0% (10)Unmarried:
0.0% (0)
Women who did not give birth in the past 12 months Now married:
31.3% (286)Unmarried:
68.7% (629)
Marital status - White alone, not Hispanic / Latino population 15 years and over
Males 33.1% Never married57.5% Now married0.1% Separated1.7% Widowed7.5% DivorcedFemales 22.0% Never married54.0% Now married0.1% Separated10.6% Widowed13.3% DivorcedWomen who gave birth in the past 12 months Now married:
83.0% (180)Unmarried:
17.0% (37)
Women who did not give birth in the past 12 months Now married:
46.2% (1,752)Unmarried:
53.8% (2,039)
Marital status - Hispanic or Latino population 15 years and over
Males 39.7% Never married45.7% Now married0.0% Separated0.0% Widowed14.6% DivorcedFemales 36.8% Never married45.9% Now married1.9% Separated3.0% Widowed12.4% DivorcedWomen who gave birth in the past 12 months Now married:
100.0% (75)Unmarried:
0.0% (0)
Women who did not give birth in the past 12 months Now married:
41.4% (758)Unmarried:
58.6% (1,071)
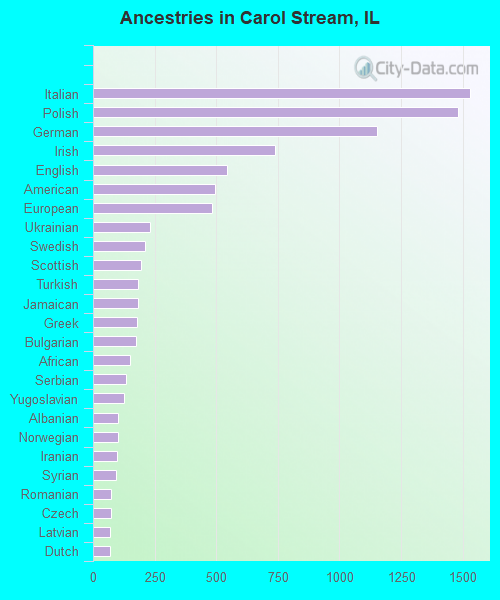
Ancestries in Carol Stream
1,530 7.2% Italian1,479 7.0% Polish1,152 5.4% German738 3.5% Irish542 2.5% English493 2.3% American483 2.3% European232 1.1% Ukrainian211 1.0% Swedish194 0.9% Scottish184 0.9% Turkish183 0.9% Jamaican177 0.8% Greek175 0.8% Bulgarian149 0.7% African134 0.6% Serbian127 0.6% Yugoslavian102 0.5% Albanian100 0.5% Norwegian97 0.5% Iranian94 0.4% Syrian74 0.3% Romanian74 0.3% Czech69 0.3% Latvian68 0.3% Dutch54 0.3% Croatian50 0.2% Scotch-Irish41 0.2% Lithuanian37 0.2% Russian33 0.2% Iraqi27 0.1% Eastern European27 0.1% Canadian27 0.1% Egyptian26 0.1% Macedonian24 0.1% Brazilian17 0.08% Icelander15 0.07% Danish15 0.07% Slovak11 0.05% Scandinavian11 0.05% Belgian11 0.05% Swiss10 0.05% Finnish10 0.05% Northern European9 0.04% Austrian8 0.04% Czechoslovakian7 0.03% Estonian7 0.03% Haitian6 0.03% French6 0.03% British6 0.03% Slavic6 0.03% Moroccan5 0.02% Cajun5 0.02% Arab3 0.01% French Canadian
Geographical mobility in Carol Stream Same house 1 year ago 19,578 91.4% White (Caucasian)2,237 84.6% Black or African American219 99.7% American Indian / Alaska Native6,319 83.2% Asian61 100.0% Native Hawaiian / Pacific Islander2,626 78.5% Other race3,215 77.6% Two or more races18,882 92.6% White alone, not Hispanic / Latino5,141 79.6% Hispanic or LatinoMoved within same county 1,009 4.7% White / Caucasian260 9.8% Black or African American557 7.3% Asian604 18.0% Other race360 8.7% Two or more races736 3.6% White alone, not Hispanic / Latino811 12.6% Hispanic or LatinoMoved within same state 604 2.8% White / Caucasian179 6.8% Black or African American464 6.1% Asian7 0.2% Other race275 6.6% Two or more races605 3.0% White alone, not Hispanic / Latino82 1.3% Hispanic or LatinoMoved from different state 66 0.3% White / Caucasian178 2.3% Asian216 5.2% Two or more races69 0.3% White alone, not Hispanic / Latino267 4.1% Hispanic or LatinoMoved from abroad 80 0.4% White20 0.8% Black or African American72 0.9% Asian16 0.5% Other race79 1.9% Two or more races59 0.3% White alone, not Hispanic / Latino161 2.5% Hispanic or Latino
Children Nativity (place of birth) in Carol Stream
Children under 6 years - Living with two parents Both parents native 993 99.9% Native1 0.1% Foreign-bornBoth parents foreign-born 526 98.4% Native8 1.6% Foreign-bornOne native, one foreign-born parent 416 100.0% NativeChildren under 6 years - Living with one parent Native parent 303 95.2% Native15 4.8% Foreign-bornForeign-born parent 101 93.7% Native7 6.3% Foreign-bornChildren 6 to 17 years - Living with two parents Both parents native 2,128 100.0% NativeBoth parents foreign-born 1,000 68.5% Native459 31.5% Foreign-bornOne native, one foreign-born parent 446 100.0% NativeChildren 6 to 17 years - Living with one parent Native parent 652 100.0% NativeForeign-born parent 748 53.7% Native644 46.3% Foreign-born
Place of birth for residents in Carol Stream 5,639 Asia3,662 South Central Asia2,756 Americas2,561 Latin America1,680 South Eastern Asia1,674 Europe1,561 Central America1,187 Eastern Europe755 South America246 Africa244 Caribbean241 Southern Europe194 Northern America167 Eastern Asia154 Western Europe149 Eastern Africa129 Western Asia70 China42 Northern Europe28 Oceania22 Northern Africa10 Australia and New Zealand Subregion1 Western Africa2,297 India1,384 Mexico791 Vietnam680 Philippines673 Pakistan374 Poland371 Colombia206 Nepal194 Canada185 Italy169 Jamaica168 Bhutan165 Peru164 Guatemala163 Ukraine162 Bosnia and Herzegovina131 Burma (Myanmar)127 Bulgaria125 Germany122 Uzbekistan105 Bangladesh99 Brazil96 Ecuador89 Iran81 Albania68 Iraq56 Greece55 Russia52 Romania49 Korea48 Japan43 China42 Uganda42 Serbia39 Cuba36 Barbados36 United Kingdom35 Thailand33 Latvia26 Syria25 Cambodia24 Lithuania23 Chile21 Ethiopia19 Saudi Arabia18 Micronesia18 North Macedonia (Macedonia)17 Belarus17 Malaysia17 Taiwan16 France16 Turkey15 Egypt14 Croatia14 Kenya13 Austria13 Costa Rica10 Hong Kong10 New Zealand7 Morocco6 Norway1 Ghana
Grandparents responsible for own grandchildren in Carol Stream
Grandparents (30 to 59 years) White / Caucasian 8 18.7% Responsible for grandchildren35 81.3% Not responsible for grandchildrenAsian 22 100.0% Not responsible for grandchildrenNative Hawaiian / Pacific Islander 17 100.0% Not responsible for grandchildrenOther race 24 100.0% Not responsible for grandchildrenTwo or more races 4 18.8% Responsible for grandchildren16 81.2% Not responsible for grandchildrenWhite alone, not Hispanic / Latino 9 20.2% Responsible for grandchildren35 79.8% Not responsible for grandchildrenHispanic or Latino 51 100.0% Not responsible for grandchildrenGrandparents (60 years and over) White / Caucasian 45 35.5% Responsible for grandchildren82 64.5% Not responsible for grandchildrenAsian 10 2.1% Responsible for grandchildren451 97.9% Not responsible for grandchildrenOther race 17 100.0% Not responsible for grandchildrenWhite alone, not Hispanic / Latino 50 39.2% Responsible for grandchildren77 60.8% Not responsible for grandchildrenHispanic or Latino 32 100.0% Not responsible for grandchildren