Races in Carneys Point, New Jersey (NJ) Detailed Stats
Data:
Races - White alone (%)
Races - White alone (% change since 2000)
Races - Black alone (%)
Races - Black alone (% change since 2000)
Races - American Indian alone (%)
Races - American Indian alone (% change since 2000)
Races - Asian alone (%)
Races - Asian alone (% change since 2000)
Races - Hispanic (%)
Races - Hispanic (% change since 2000)
Races - Native Hawaiian and Other Pacific Islander alone (%)
Races - Native Hawaiian and Other Pacific Islander alone (% change since 2000)
Races - Two or more races(%)
Races - Two or more races(% change since 2000)
Races - Other race alone (%)
Races - Other race alone (% change since 2000)
Racial diversity
Place of birth - Born in state of residence (%)
Place of birth - Born in state of residence (%) - White
Place of birth - Born in state of residence (%) - Black or African American
Place of birth - Born in state of residence (%) - Asian
Place of birth - Born in state of residence (%) - Hispanic or Latino
Place of birth - Born in state of residence (%) - American Indian and Alaska Native
Place of birth - Born in state of residence (%) - Multirace
Place of birth - Born in state of residence (%) - Other Race
Place of birth - Born in other state (%)
Place of birth - Born in other state (%) - White
Place of birth - Born in other state (%) - Black or African American
Place of birth - Born in other state (%) - Asian
Place of birth - Born in other state (%) - Hispanic or Latino
Place of birth - Born in other state (%) - American Indian and Alaska Native
Place of birth - Born in other state (%) - Multirace
Place of birth - Born in other state (%) - Other Race
Place of birth - Native, outside of US (%)
Place of birth - Native, outside of US (%) - White
Place of birth - Native, outside of US (%) - Black or African American
Place of birth - Native, outside of US (%) - Asian
Place of birth - Native, outside of US (%) - Hispanic or Latino
Place of birth - Native, outside of US (%) - American Indian and Alaska Native
Place of birth - Native, outside of US (%) - Multirace
Place of birth - Native, outside of US (%) - Other Race
Place of birth - Foreign born (%)
Place of birth - Foreign born (%) - White
Place of birth - Foreign born (%) - Black or African American
Place of birth - Foreign born (%) - Asian
Place of birth - Foreign born (%) - Hispanic or Latino
Place of birth - Foreign born (%) - American Indian and Alaska Native
Place of birth - Foreign born (%) - Multirace
Place of birth - Foreign born (%) - Other Race
Residents speaking English at home (%)
Residents speaking English at home - Born in the United States (%)
Residents speaking English at home - Native, born elsewhere (%)
Residents speaking English at home - Foreign born (%)
Residents speaking Spanish at home (%)
Residents speaking Spanish at home - Born in the United States (%)
Residents speaking Spanish at home - Native, born elsewhere (%)
Residents speaking Spanish at home - Foreign born (%)
Residents speaking other language at home (%)
Residents speaking other language at home - Born in the United States (%)
Residents speaking other language at home - Native, born elsewhere (%)
Residents speaking other language at home - Foreign born (%)
Marital status - Never married (%)
Marital status - Now married (%)
Marital status - Separated (%)
Marital status - Widowed (%)
Marital status - Divorced (%)
Ancestries Reported - Arab (%)
Ancestries Reported - Czech (%)
Ancestries Reported - Danish (%)
Ancestries Reported - Dutch (%)
Ancestries Reported - English (%)
Ancestries Reported - French (%)
Ancestries Reported - French Canadian (%)
Ancestries Reported - German (%)
Ancestries Reported - Greek (%)
Ancestries Reported - Hungarian (%)
Ancestries Reported - Irish (%)
Ancestries Reported - Italian (%)
Ancestries Reported - Lithuanian (%)
Ancestries Reported - Norwegian (%)
Ancestries Reported - Polish (%)
Ancestries Reported - Portuguese (%)
Ancestries Reported - Russian (%)
Ancestries Reported - Scotch-Irish (%)
Ancestries Reported - Scottish (%)
Ancestries Reported - Slovak (%)
Ancestries Reported - Subsaharan African (%)
Ancestries Reported - Swedish (%)
Ancestries Reported - Swiss (%)
Ancestries Reported - Ukrainian (%)
Ancestries Reported - United States (%)
Ancestries Reported - Welsh (%)
Ancestries Reported - West Indian (%)
Ancestries Reported - Other (%)
Geographical mobility - Same house 1 year ago (%)
Geographical mobility - Same house 1 year ago (%) - White
Geographical mobility - Same house 1 year ago (%) - Black or African American
Geographical mobility - Same house 1 year ago (%) - Asian
Geographical mobility - Same house 1 year ago (%) - Hispanic or Latino
Geographical mobility - Same house 1 year ago (%) - American Indian and Alaska Native
Geographical mobility - Same house 1 year ago (%) - Multirace
Geographical mobility - Same house 1 year ago (%) - Other Race
Geographical mobility - Moved within same county (%)
Geographical mobility - Moved within same county (%) - White
Geographical mobility - Moved within same county (%) - Black or African American
Geographical mobility - Moved within same county (%) - Asian
Geographical mobility - Moved within same county (%) - Hispanic or Latino
Geographical mobility - Moved within same county (%) - American Indian and Alaska Native
Geographical mobility - Moved within same county (%) - Multirace
Geographical mobility - Moved within same county (%) - Other Race
Geographical mobility - Moved from different county within same state (%)
Geographical mobility - Moved from different county within same state (%) - White
Geographical mobility - Moved from different county within same state (%) - Black or African American
Geographical mobility - Moved from different county within same state (%) - Asian
Geographical mobility - Moved from different county within same state (%) - Hispanic or Latino
Geographical mobility - Moved from different county within same state (%) - American Indian and Alaska Native
Geographical mobility - Moved from different county within same state (%) - Multirace
Geographical mobility - Moved from different county within same state (%) - Other Race
Geographical mobility - Moved from different state (%)
Geographical mobility - Moved from different state (%) - White
Geographical mobility - Moved from different state (%) - Black or African American
Geographical mobility - Moved from different state (%) - Asian
Geographical mobility - Moved from different state (%) - Hispanic or Latino
Geographical mobility - Moved from different state (%) - American Indian and Alaska Native
Geographical mobility - Moved from different state (%) - Multirace
Geographical mobility - Moved from different state (%) - Other Race
Geographical mobility - Moved from abroad (%)
Geographical mobility - Moved from abroad (%) - White
Geographical mobility - Moved from abroad (%) - Black or African American
Geographical mobility - Moved from abroad (%) - Asian
Geographical mobility - Moved from abroad (%) - Hispanic or Latino
Geographical mobility - Moved from abroad (%) - American Indian and Alaska Native
Geographical mobility - Moved from abroad (%) - Multirace
Geographical mobility - Moved from abroad (%) - Other Race
Place of birth for the foreign-born population - Ireland (%)
Place of birth for the foreign-born population - Denmark (%)
Place of birth for the foreign-born population - Norway (%)
Place of birth for the foreign-born population - Sweden (%)
Place of birth for the foreign-born population - United Kingdom (%)
Place of birth for the foreign-born population - England (%)
Place of birth for the foreign-born population - Scotland (%)
Place of birth for the foreign-born population - Other Northern Europe (%)
Place of birth for the foreign-born population - Austria (%)
Place of birth for the foreign-born population - Belgium (%)
Place of birth for the foreign-born population - France (%)
Place of birth for the foreign-born population - Germany (%)
Place of birth for the foreign-born population - Netherlands (%)
Place of birth for the foreign-born population - Switzerland (%)
Place of birth for the foreign-born population - Other Western Europe (%)
Place of birth for the foreign-born population - Greece (%)
Place of birth for the foreign-born population - Italy (%)
Place of birth for the foreign-born population - Portugal (%)
Place of birth for the foreign-born population - Spain (%)
Place of birth for the foreign-born population - Other Southern Europe (%)
Place of birth for the foreign-born population - Albania (%)
Place of birth for the foreign-born population - Belarus (%)
Place of birth for the foreign-born population - Bosnia and Herzegovina (%)
Place of birth for the foreign-born population - Bulgaria (%)
Place of birth for the foreign-born population - Croatia (%)
Place of birth for the foreign-born population - Czechoslovakia (%)
Place of birth for the foreign-born population - Hungary (%)
Place of birth for the foreign-born population - Latvia (%)
Place of birth for the foreign-born population - Lithuania (%)
Place of birth for the foreign-born population - North Macedonia (Macedonia) (%)
Place of birth for the foreign-born population - Moldova (%)
Place of birth for the foreign-born population - Poland (%)
Place of birth for the foreign-born population - Romania (%)
Place of birth for the foreign-born population - Russia (%)
Place of birth for the foreign-born population - Serbia (%)
Place of birth for the foreign-born population - Ukraine (%)
Place of birth for the foreign-born population - Other Eastern Europe (%)
Place of birth for the foreign-born population - China (%)
Place of birth for the foreign-born population - Hong Kong (%)
Place of birth for the foreign-born population - Taiwan (%)
Place of birth for the foreign-born population - Japan (%)
Place of birth for the foreign-born population - Korea (%)
Place of birth for the foreign-born population - Other Eastern Asia (%)
Place of birth for the foreign-born population - Afghanistan (%)
Place of birth for the foreign-born population - Bangladesh (%)
Place of birth for the foreign-born population - India (%)
Place of birth for the foreign-born population - Iran (%)
Place of birth for the foreign-born population - Kazakhstan (%)
Place of birth for the foreign-born population - Nepal (%)
Place of birth for the foreign-born population - Pakistan (%)
Place of birth for the foreign-born population - Sri Lanka (%)
Place of birth for the foreign-born population - Uzbekistan (%)
Place of birth for the foreign-born population - Other South Central Asia (%)
Place of birth for the foreign-born population - Burma (%)
Place of birth for the foreign-born population - Cambodia (%)
Place of birth for the foreign-born population - Indonesia (%)
Place of birth for the foreign-born population - Laos (%)
Place of birth for the foreign-born population - Malaysia (%)
Place of birth for the foreign-born population - Philippines (%)
Place of birth for the foreign-born population - Singapore (%)
Place of birth for the foreign-born population - Thailand (%)
Place of birth for the foreign-born population - Vietnam (%)
Place of birth for the foreign-born population - Other South Eastern Asia (%)
Place of birth for the foreign-born population - Armenia (%)
Place of birth for the foreign-born population - Iraq (%)
Place of birth for the foreign-born population - Israel (%)
Place of birth for the foreign-born population - Jordan (%)
Place of birth for the foreign-born population - Kuwait (%)
Place of birth for the foreign-born population - Lebanon (%)
Place of birth for the foreign-born population - Saudi Arabia (%)
Place of birth for the foreign-born population - Syria (%)
Place of birth for the foreign-born population - Turkey (%)
Place of birth for the foreign-born population - Yemen (%)
Place of birth for the foreign-born population - Other Western Asia (%)
Place of birth for the foreign-born population - Eritrea (%)
Place of birth for the foreign-born population - Ethiopia (%)
Place of birth for the foreign-born population - Kenya (%)
Place of birth for the foreign-born population - Somalia (%)
Place of birth for the foreign-born population - Uganda (%)
Place of birth for the foreign-born population - Zimbabwe (%)
Place of birth for the foreign-born population - Other Eastern Africa (%)
Place of birth for the foreign-born population - Cameroon (%)
Place of birth for the foreign-born population - Congo (%)
Place of birth for the foreign-born population - Democratic Republic of Congo (Zaire) (%)
Place of birth for the foreign-born population - Other Middle Africa (%)
Place of birth for the foreign-born population - Egypt (%)
Place of birth for the foreign-born population - Morocco (%)
Place of birth for the foreign-born population - Sudan (%)
Place of birth for the foreign-born population - Other Northern Africa (%)
Place of birth for the foreign-born population - South Africa (%)
Place of birth for the foreign-born population - Other Southern Africa (%)
Place of birth for the foreign-born population - Cabo Verde (%)
Place of birth for the foreign-born population - Ghana (%)
Place of birth for the foreign-born population - Liberia (%)
Place of birth for the foreign-born population - Nigeria (%)
Place of birth for the foreign-born population - Senegal (%)
Place of birth for the foreign-born population - Sierra Leone (%)
Place of birth for the foreign-born population - Other Western Africa (%)
Place of birth for the foreign-born population - Australia (%)
Place of birth for the foreign-born population - New Zealand (%)
Place of birth for the foreign-born population - Fiji (%)
Place of birth for the foreign-born population - Micronesia (%)
Place of birth for the foreign-born population - Bahamas (%)
Place of birth for the foreign-born population - Barbados (%)
Place of birth for the foreign-born population - Cuba (%)
Place of birth for the foreign-born population - Dominica (%)
Place of birth for the foreign-born population - Dominican Republic (%)
Place of birth for the foreign-born population - Grenada (%)
Place of birth for the foreign-born population - Haiti (%)
Place of birth for the foreign-born population - Jamaica (%)
Place of birth for the foreign-born population - St. Vincent and the Grenadines (%)
Place of birth for the foreign-born population - Trinidad and Tobago (%)
Place of birth for the foreign-born population - West Indies (%)
Place of birth for the foreign-born population - Other Caribbean (%)
Place of birth for the foreign-born population - Belize (%)
Place of birth for the foreign-born population - Costa Rica (%)
Place of birth for the foreign-born population - El Salvador (%)
Place of birth for the foreign-born population - Guatemala (%)
Place of birth for the foreign-born population - Honduras (%)
Place of birth for the foreign-born population - Mexico (%)
Place of birth for the foreign-born population - Nicaragua (%)
Place of birth for the foreign-born population - Panama (%)
Place of birth for the foreign-born population - Other Central America (%)
Place of birth for the foreign-born population - Argentina (%)
Place of birth for the foreign-born population - Bolivia (%)
Place of birth for the foreign-born population - Brazil (%)
Place of birth for the foreign-born population - Chile (%)
Place of birth for the foreign-born population - Colombia (%)
Place of birth for the foreign-born population - Ecuador (%)
Place of birth for the foreign-born population - Guyana (%)
Place of birth for the foreign-born population - Peru (%)
Place of birth for the foreign-born population - Uruguay (%)
Place of birth for the foreign-born population - Venezuela (%)
Place of birth for the foreign-born population - Other South America (%)
Place of birth for the foreign-born population - Canada (%)
Place of birth for the foreign-born population - Other Northern America (%)
Place of birth for the foreign-born population - Other (%)
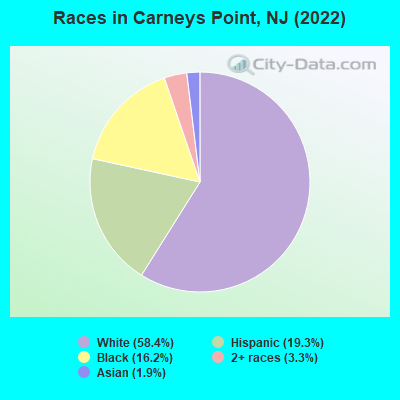
According to 2022 data, the most numerous races in Carneys Point, NJ are White alone (4,759 residents), Hispanic (1,570 residents), and Black alone (1,316 residents). 86.3% of Carneys Point residents speak English at home. 6.8% of Carneys Point, NJ residents are foreign-born (4.6% born in Latin America, 1.1% born in Asia), which is 237.4% less than the foreign-born rate of 23.0% across the entire state of New Jersey.
Race distribution in Carneys Point
2000 2022
5,557,209 66.0% White alone 1,117,191 13.3% Hispanic 1,096,171 13.0% Black alone 477,012 5.7% Asian alone 133,689 1.6% Two or more races 19,565 0.2% Other race alone 11,338 0.1% American Indian alone 2,175 0.03% Native Hawaiian and Other
4,766,476 51.5% White alone 2,028,470 21.9% Hispanic 1,111,632 12.0% Black alone 923,546 10.0% Asian alone 332,237 3.6% Two or more races 89,847 1.0% Other race alone 8,557 0.09% American Indian alone 934 0.01% Native Hawaiian and Other
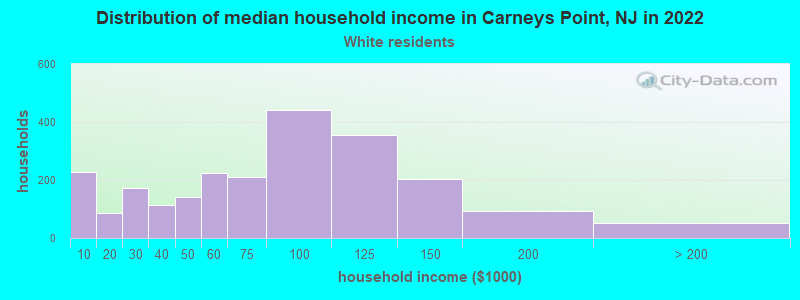
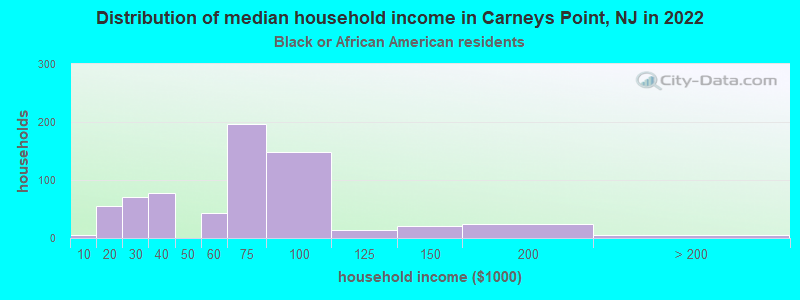
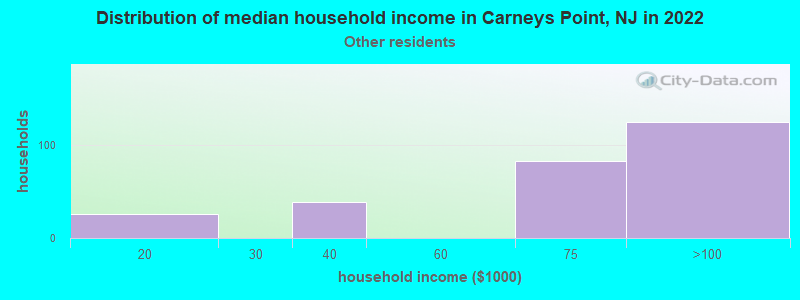
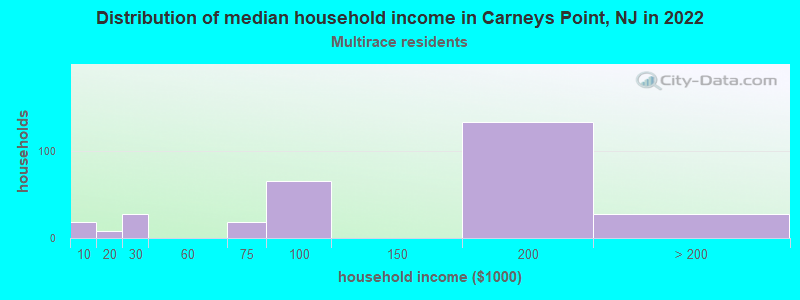
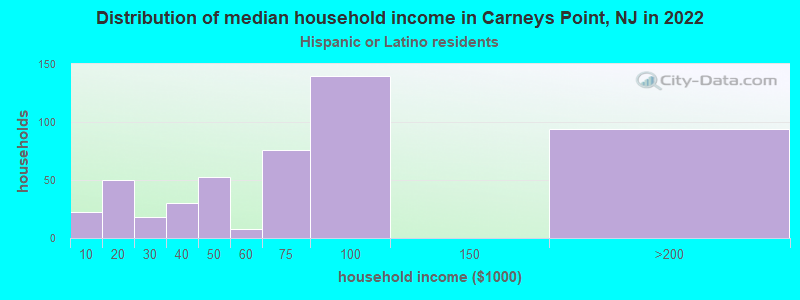
Income and house value in Carneys Point Median household income in 2022 $75,276 White non-Hispanic householders$87,600 Black householders$64,018 Some other race householders$149,342 Two or more races householders$82,530 Hispanic or Latino race householdersMedian 2022 house value $183,144 White Non-Hispanic householders$168,961 Black or African American householders$215,826 American Indian or Alaska Native householders $200,410 Asian householders$139,156 Some other race householders$183,555 Two or more races householders$139,156 Hispanic or Latino householders
Median age by race in Carneys Point
49.9 Median age for White residents48.5 51.9 57.6 Median age for Black or African American residents49.2 70.9 -676,272,813.9 Median age for American Indian / Alaska Native residents-670,465,336.5 -688,298,917.7 41.2 Median age for Asian residents-666,666,666.0 -668,312,756.5 -666,666,666.0 Median age for Native Hawaiian / Pacific Islander residents-666,666,666.0 -666,666,666.0 31.9 Median age for Other race residents16.5 39.9 36.0 Median age for Two or more races residents36.7 57.4 50.6 Median age for White alone residents48.8 51.4 34.4 Median age for Hispanic or Latino residents29.7 50.0
Owner/renter occupied households by race in Carneys Point
House owners and renters - White residents 1,725 77.5% Owner occupied502 22.5% Renter occupiedHouse owners and renters - Black or African American residents 384 61.8% Owner occupied237 38.2% Renter occupiedHouse owners and renters - Asian residents 67 100.0% Renter occupiedHouse owners and renters - Other race residents 147 84.3% Owner occupied27 15.7% Renter occupiedHouse owners and renters - Two or more races residents 146 56.6% Owner occupied112 43.4% Renter occupiedHouse owners and renters - White alone residents 1,699 79.5% Owner occupied438 20.5% Renter occupiedHouse owners and renters - Hispanic or Latino residents 215 57.9% Owner occupied157 42.1% Renter occupied
Language usage in Carneys Point
English speakers - Total 86.3% of residents of Carneys Point speak English at home.
11.1% of residents speak Spanish at home 519 58.8% Speak English very well363 41.2% Speak English less than very well2.6% of residents speak other language at home 43 21.1% Speak English very well161 78.9% Speak English less than very well
English speakers - Born in the United States 92.3% of residents of Carneys Point speak English at home.
9.5% of residents speak Spanish at home 246 74.1% Speak English very well86 25.9% Speak English less than very well0.4% of residents speak other language at home 15 100.0% Speak English very well
English speakers - Native, born elsewhere 50.3% of residents of Carneys Point speak English at home.
42.4% of residents speak Spanish at home 73 50.3% Speak English very well72 49.7% Speak English less than very well19.0% of residents speak other language at home 65 100.0% Speak English less than very well
English speakers - Foreign-born 42.3% of residents of Carneys Point speak English at home.
41.8% of residents speak Spanish at home 133 54.3% Speak English very well112 45.7% Speak English less than very well13.0% of residents speak other language at home 9 11.8% Speak English very well67 88.2% Speak English less than very well
White (Caucasian) - Speak only English Native:
96.3% (4,365)Foreign-born:
65.4% (67)
White (Caucasian) - Speak another language Native:
4.5% (204)Foreign-born:
44.7% (46)
Black or African American - Speak only English Native:
98.4% (1,279)Foreign-born:
32.8% (8)
Black or African American - Speak another language Native:
2.1% (27)Foreign-born:
66.6% (16)
Asian - Speak another language Native:
96.5% (69)Foreign-born:
82.9% (73)
Other race - Speak only English Native:
56.2% (487)Foreign-born:
34.6% (119)
Other race - Speak another language Native:
43.9% (380)Foreign-born:
29.9% (103)
Two or more races - Speak another language Native:
9.4% (72)Foreign-born:
98.9% (122)
White alone - Speak only English Native:
97.4% (4,378)Foreign-born:
65.9% (66)
White alone - Speak another language Native:
2.7% (119)Foreign-born:
32.1% (32)
Hispanic or Latino - Speak only English Native:
47.7% (586)Foreign-born:
36.5% (160)
Hispanic or Latino - Speak another language Native:
48.2% (592)Foreign-born:
37.7% (165)
Foreign-born residents in Carneys Point 557 residents are foreign born (4.6% Latin America , 1.1% Asia ).
This city:
6.8%New Jersey:
23.2%
Marital status for residents in Carneys Point Marital status - White (Caucasian) population 15 years and over
Males 32.3% Never married48.1% Now married4.1% Separated4.2% Widowed11.2% DivorcedFemales 23.6% Never married46.2% Now married2.0% Separated13.0% Widowed15.2% DivorcedWomen who gave birth in the past 12 months Now married:
100.0% (21)Unmarried:
0.0% (0)
Women who did not give birth in the past 12 months Now married:
44.9% (448)Unmarried:
55.1% (550)
Marital status - Black or African American population 15 years and over
Males 57.0% Never married26.7% Now married1.7% Separated3.3% Widowed11.3% DivorcedFemales 48.5% Never married22.8% Now married3.8% Separated14.5% Widowed10.3% DivorcedWomen who did not give birth in the past 12 months Now married:
14.1% (44)Unmarried:
85.9% (268)
Marital status - Asian population 15 years and over
Males 0.0% Never married100.0% Now married0.0% Separated0.0% Widowed0.0% DivorcedFemales 0.0% Never married100.0% Now married0.0% Separated0.0% Widowed0.0% DivorcedWomen who did not give birth in the past 12 months Now married:
100.0% (73)Unmarried:
0.0% (0)
Marital status - Other race population 15 years and over
Males 75.1% Never married24.9% Now married0.0% Separated0.0% Widowed0.0% DivorcedFemales 35.0% Never married36.2% Now married9.6% Separated0.0% Widowed19.2% DivorcedWomen who did not give birth in the past 12 months Now married:
53.6% (102)Unmarried:
46.4% (88)
Marital status - Two or more races population 15 years and over
Males 70.9% Never married14.1% Now married0.0% Separated0.0% Widowed15.0% DivorcedFemales 15.8% Never married50.9% Now married0.0% Separated14.0% Widowed19.3% DivorcedWomen who did not give birth in the past 12 months Now married:
28.1% (23)Unmarried:
71.9% (58)
Marital status - White alone, not Hispanic / Latino population 15 years and over
Males 32.7% Never married49.1% Now married2.1% Separated4.4% Widowed11.7% DivorcedFemales 23.6% Never married47.2% Now married2.2% Separated13.8% Widowed13.3% DivorcedWomen who gave birth in the past 12 months Now married:
100.0% (22)Unmarried:
0.0% (0)
Women who did not give birth in the past 12 months Now married:
48.8% (456)Unmarried:
51.2% (479)
Marital status - Hispanic or Latino population 15 years and over
Males 66.4% Never married21.7% Now married5.7% Separated0.0% Widowed6.3% DivorcedFemales 37.9% Never married27.2% Now married3.6% Separated6.4% Widowed24.8% DivorcedWomen who did not give birth in the past 12 months Now married:
25.9% (90)Unmarried:
74.1% (259)
Ancestries in Carneys Point
299 8.8% German283 8.4% Irish276 8.2% Italian239 7.1% English143 4.2% American50 1.5% Polish41 1.2% Scottish30 0.9% Croatian25 0.7% Dutch25 0.7% Ukrainian19 0.6% Brazilian15 0.4% Austrian14 0.4% Lithuanian12 0.4% Romanian10 0.3% French10 0.3% French Canadian10 0.3% Greek8 0.2% Scandinavian8 0.2% Scotch-Irish7 0.2% Jamaican6 0.2% Swedish5 0.1% European5 0.1% Russian4 0.1% Finnish
Children Nativity (place of birth) in Carneys Point
Children under 6 years - Living with two parents Both parents native 165 100.0% NativeOne native, one foreign-born parent 38 100.0% NativeChildren under 6 years - Living with one parent Native parent 127 100.0% NativeChildren 6 to 17 years - Living with two parents Both parents native 368 100.0% NativeBoth parents foreign-born 38 100.0% NativeOne native, one foreign-born parent 9 100.0% NativeChildren 6 to 17 years - Living with one parent Native parent 284 100.0% NativeForeign-born parent 70 50.5% Native68 49.5% Foreign-born
Grandparents responsible for own grandchildren in Carneys Point
Grandparents (30 to 59 years) White / Caucasian 79 76.6% Responsible for grandchildren24 23.4% Not responsible for grandchildrenBlack or African American 7 100.0% Not responsible for grandchildrenWhite alone, not Hispanic / Latino 79 76.6% Responsible for grandchildren24 23.4% Not responsible for grandchildrenGrandparents (60 years and over) White / Caucasian 65 70.8% Responsible for grandchildren27 29.2% Not responsible for grandchildrenBlack or African American 5 100.0% Not responsible for grandchildrenWhite alone, not Hispanic / Latino 65 70.8% Responsible for grandchildren27 29.2% Not responsible for grandchildren