Races in Cape Girardeau, Missouri (MO) Detailed Stats
Data:
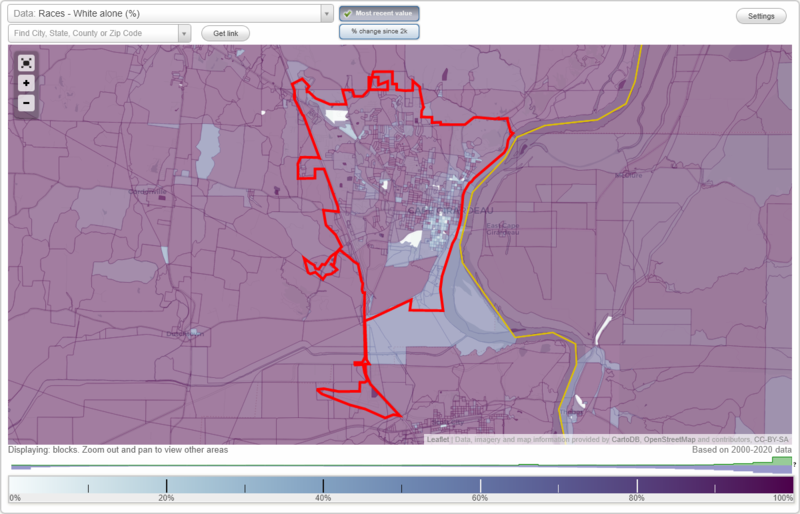
Races - White alone (%)
Races - White alone (% change since 2000)
Races - Black alone (%)
Races - Black alone (% change since 2000)
Races - American Indian alone (%)
Races - American Indian alone (% change since 2000)
Races - Asian alone (%)
Races - Asian alone (% change since 2000)
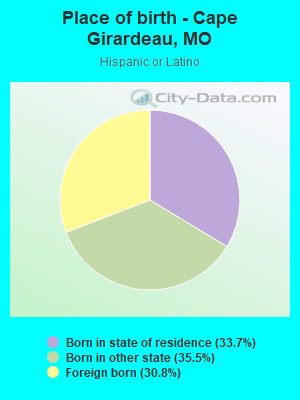
Races - Hispanic (%)
Races - Hispanic (% change since 2000)
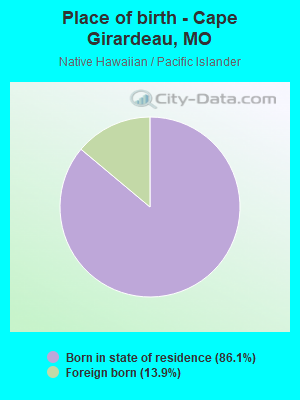
Races - Native Hawaiian and Other Pacific Islander alone (%)
Races - Native Hawaiian and Other Pacific Islander alone (% change since 2000)
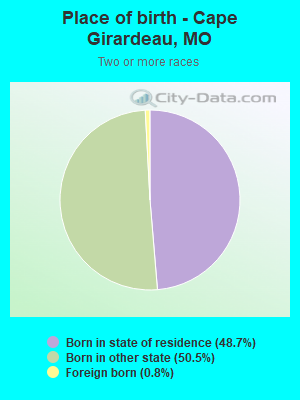
Races - Two or more races(%)
Races - Two or more races(% change since 2000)
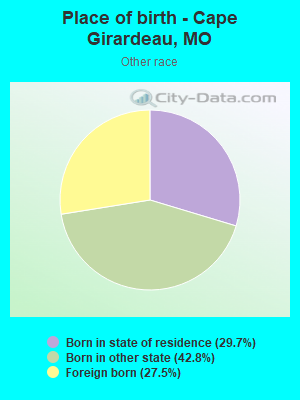
Races - Other race alone (%)
Races - Other race alone (% change since 2000)
Racial diversity
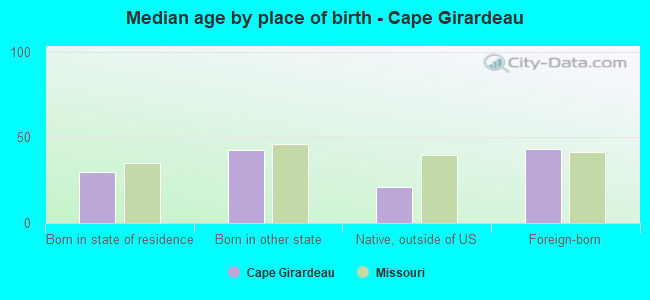
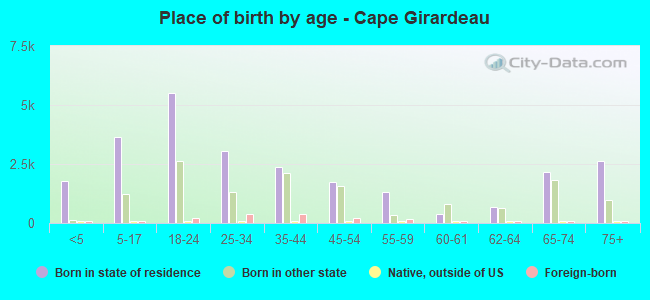
Place of birth - Born in state of residence (%)
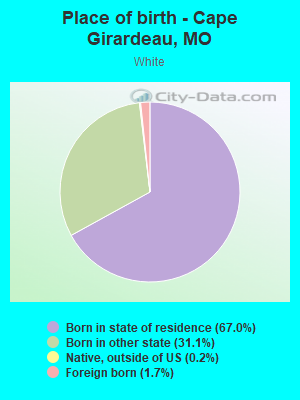
Place of birth - Born in state of residence (%) - White
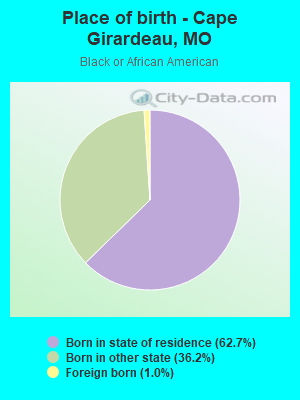
Place of birth - Born in state of residence (%) - Black or African American
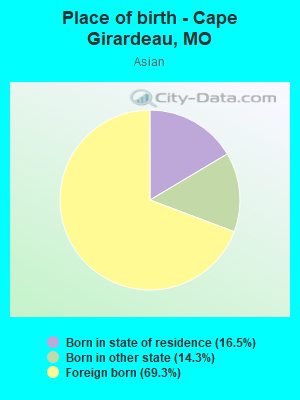
Place of birth - Born in state of residence (%) - Asian
Place of birth - Born in state of residence (%) - Hispanic or Latino
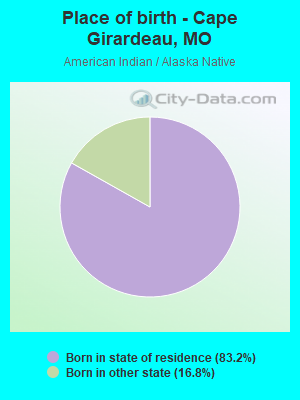
Place of birth - Born in state of residence (%) - American Indian and Alaska Native
Place of birth - Born in state of residence (%) - Multirace
Place of birth - Born in state of residence (%) - Other Race
Place of birth - Born in other state (%)
Place of birth - Born in other state (%) - White
Place of birth - Born in other state (%) - Black or African American
Place of birth - Born in other state (%) - Asian
Place of birth - Born in other state (%) - Hispanic or Latino
Place of birth - Born in other state (%) - American Indian and Alaska Native
Place of birth - Born in other state (%) - Multirace
Place of birth - Born in other state (%) - Other Race
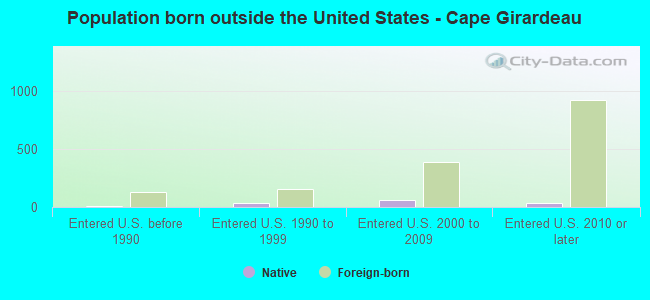
Place of birth - Native, outside of US (%)
Place of birth - Native, outside of US (%) - White
Place of birth - Native, outside of US (%) - Black or African American
Place of birth - Native, outside of US (%) - Asian
Place of birth - Native, outside of US (%) - Hispanic or Latino
Place of birth - Native, outside of US (%) - American Indian and Alaska Native
Place of birth - Native, outside of US (%) - Multirace
Place of birth - Native, outside of US (%) - Other Race
Place of birth - Foreign born (%)
Place of birth - Foreign born (%) - White
Place of birth - Foreign born (%) - Black or African American
Place of birth - Foreign born (%) - Asian
Place of birth - Foreign born (%) - Hispanic or Latino
Place of birth - Foreign born (%) - American Indian and Alaska Native
Place of birth - Foreign born (%) - Multirace
Place of birth - Foreign born (%) - Other Race
Residents speaking English at home (%)
Residents speaking English at home - Born in the United States (%)
Residents speaking English at home - Native, born elsewhere (%)
Residents speaking English at home - Foreign born (%)
Residents speaking Spanish at home (%)
Residents speaking Spanish at home - Born in the United States (%)
Residents speaking Spanish at home - Native, born elsewhere (%)
Residents speaking Spanish at home - Foreign born (%)
Residents speaking other language at home (%)
Residents speaking other language at home - Born in the United States (%)
Residents speaking other language at home - Native, born elsewhere (%)
Residents speaking other language at home - Foreign born (%)
Marital status - Never married (%)
Marital status - Now married (%)
Marital status - Separated (%)
Marital status - Widowed (%)
Marital status - Divorced (%)
Ancestries Reported - Arab (%)
Ancestries Reported - Czech (%)
Ancestries Reported - Danish (%)
Ancestries Reported - Dutch (%)
Ancestries Reported - English (%)
Ancestries Reported - French (%)
Ancestries Reported - French Canadian (%)
Ancestries Reported - German (%)
Ancestries Reported - Greek (%)
Ancestries Reported - Hungarian (%)
Ancestries Reported - Irish (%)
Ancestries Reported - Italian (%)
Ancestries Reported - Lithuanian (%)
Ancestries Reported - Norwegian (%)
Ancestries Reported - Polish (%)
Ancestries Reported - Portuguese (%)
Ancestries Reported - Russian (%)
Ancestries Reported - Scotch-Irish (%)
Ancestries Reported - Scottish (%)
Ancestries Reported - Slovak (%)
Ancestries Reported - Subsaharan African (%)
Ancestries Reported - Swedish (%)
Ancestries Reported - Swiss (%)
Ancestries Reported - Ukrainian (%)
Ancestries Reported - United States (%)
Ancestries Reported - Welsh (%)
Ancestries Reported - West Indian (%)
Ancestries Reported - Other (%)
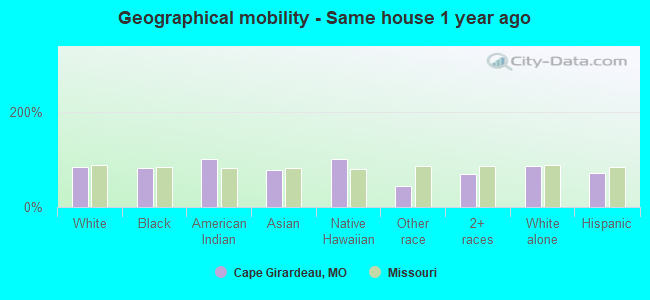
Geographical mobility - Same house 1 year ago (%)
Geographical mobility - Same house 1 year ago (%) - White
Geographical mobility - Same house 1 year ago (%) - Black or African American
Geographical mobility - Same house 1 year ago (%) - Asian
Geographical mobility - Same house 1 year ago (%) - Hispanic or Latino
Geographical mobility - Same house 1 year ago (%) - American Indian and Alaska Native
Geographical mobility - Same house 1 year ago (%) - Multirace
Geographical mobility - Same house 1 year ago (%) - Other Race
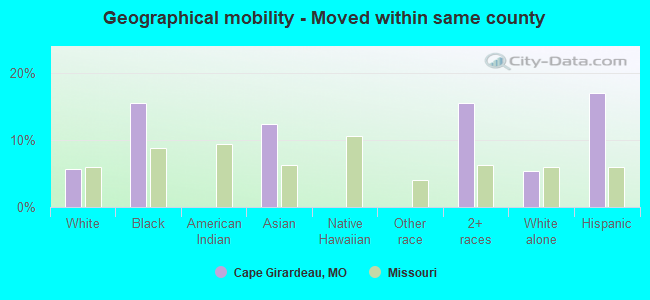
Geographical mobility - Moved within same county (%)
Geographical mobility - Moved within same county (%) - White
Geographical mobility - Moved within same county (%) - Black or African American
Geographical mobility - Moved within same county (%) - Asian
Geographical mobility - Moved within same county (%) - Hispanic or Latino
Geographical mobility - Moved within same county (%) - American Indian and Alaska Native
Geographical mobility - Moved within same county (%) - Multirace
Geographical mobility - Moved within same county (%) - Other Race
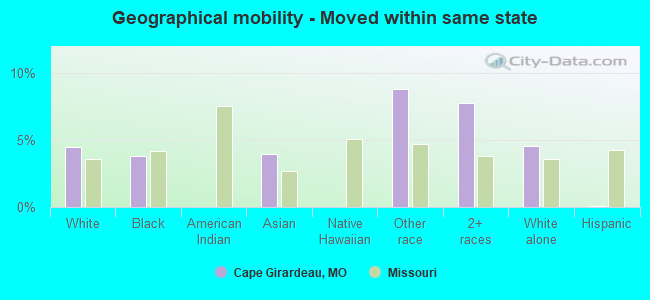
Geographical mobility - Moved from different county within same state (%)
Geographical mobility - Moved from different county within same state (%) - White
Geographical mobility - Moved from different county within same state (%) - Black or African American
Geographical mobility - Moved from different county within same state (%) - Asian
Geographical mobility - Moved from different county within same state (%) - Hispanic or Latino
Geographical mobility - Moved from different county within same state (%) - American Indian and Alaska Native
Geographical mobility - Moved from different county within same state (%) - Multirace
Geographical mobility - Moved from different county within same state (%) - Other Race
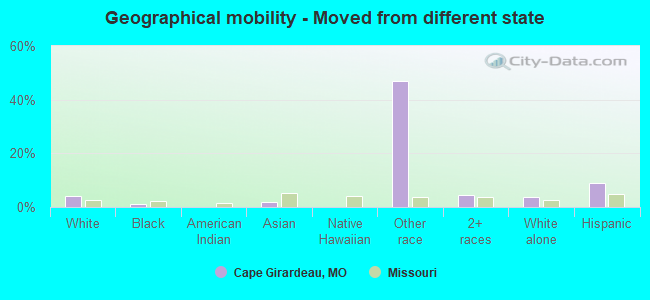
Geographical mobility - Moved from different state (%)
Geographical mobility - Moved from different state (%) - White
Geographical mobility - Moved from different state (%) - Black or African American
Geographical mobility - Moved from different state (%) - Asian
Geographical mobility - Moved from different state (%) - Hispanic or Latino
Geographical mobility - Moved from different state (%) - American Indian and Alaska Native
Geographical mobility - Moved from different state (%) - Multirace
Geographical mobility - Moved from different state (%) - Other Race
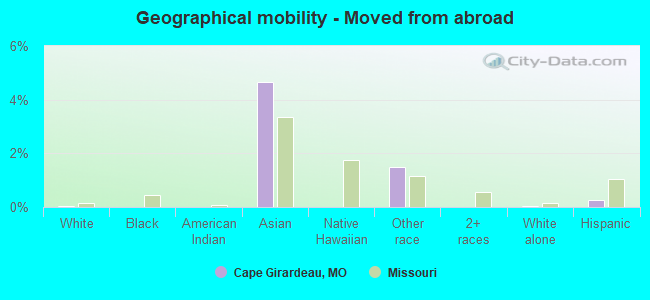
Geographical mobility - Moved from abroad (%)
Geographical mobility - Moved from abroad (%) - White
Geographical mobility - Moved from abroad (%) - Black or African American
Geographical mobility - Moved from abroad (%) - Asian
Geographical mobility - Moved from abroad (%) - Hispanic or Latino
Geographical mobility - Moved from abroad (%) - American Indian and Alaska Native
Geographical mobility - Moved from abroad (%) - Multirace
Geographical mobility - Moved from abroad (%) - Other Race
Place of birth for the foreign-born population - Ireland (%)
Place of birth for the foreign-born population - Denmark (%)
Place of birth for the foreign-born population - Norway (%)
Place of birth for the foreign-born population - Sweden (%)
Place of birth for the foreign-born population - United Kingdom (%)
Place of birth for the foreign-born population - England (%)
Place of birth for the foreign-born population - Scotland (%)
Place of birth for the foreign-born population - Other Northern Europe (%)
Place of birth for the foreign-born population - Austria (%)
Place of birth for the foreign-born population - Belgium (%)
Place of birth for the foreign-born population - France (%)
Place of birth for the foreign-born population - Germany (%)
Place of birth for the foreign-born population - Netherlands (%)
Place of birth for the foreign-born population - Switzerland (%)
Place of birth for the foreign-born population - Other Western Europe (%)
Place of birth for the foreign-born population - Greece (%)
Place of birth for the foreign-born population - Italy (%)
Place of birth for the foreign-born population - Portugal (%)
Place of birth for the foreign-born population - Spain (%)
Place of birth for the foreign-born population - Other Southern Europe (%)
Place of birth for the foreign-born population - Albania (%)
Place of birth for the foreign-born population - Belarus (%)
Place of birth for the foreign-born population - Bosnia and Herzegovina (%)
Place of birth for the foreign-born population - Bulgaria (%)
Place of birth for the foreign-born population - Croatia (%)
Place of birth for the foreign-born population - Czechoslovakia (%)
Place of birth for the foreign-born population - Hungary (%)
Place of birth for the foreign-born population - Latvia (%)
Place of birth for the foreign-born population - Lithuania (%)
Place of birth for the foreign-born population - North Macedonia (Macedonia) (%)
Place of birth for the foreign-born population - Moldova (%)
Place of birth for the foreign-born population - Poland (%)
Place of birth for the foreign-born population - Romania (%)
Place of birth for the foreign-born population - Russia (%)
Place of birth for the foreign-born population - Serbia (%)
Place of birth for the foreign-born population - Ukraine (%)
Place of birth for the foreign-born population - Other Eastern Europe (%)
Place of birth for the foreign-born population - China (%)
Place of birth for the foreign-born population - Hong Kong (%)
Place of birth for the foreign-born population - Taiwan (%)
Place of birth for the foreign-born population - Japan (%)
Place of birth for the foreign-born population - Korea (%)
Place of birth for the foreign-born population - Other Eastern Asia (%)
Place of birth for the foreign-born population - Afghanistan (%)
Place of birth for the foreign-born population - Bangladesh (%)
Place of birth for the foreign-born population - India (%)
Place of birth for the foreign-born population - Iran (%)
Place of birth for the foreign-born population - Kazakhstan (%)
Place of birth for the foreign-born population - Nepal (%)
Place of birth for the foreign-born population - Pakistan (%)
Place of birth for the foreign-born population - Sri Lanka (%)
Place of birth for the foreign-born population - Uzbekistan (%)
Place of birth for the foreign-born population - Other South Central Asia (%)
Place of birth for the foreign-born population - Burma (%)
Place of birth for the foreign-born population - Cambodia (%)
Place of birth for the foreign-born population - Indonesia (%)
Place of birth for the foreign-born population - Laos (%)
Place of birth for the foreign-born population - Malaysia (%)
Place of birth for the foreign-born population - Philippines (%)
Place of birth for the foreign-born population - Singapore (%)
Place of birth for the foreign-born population - Thailand (%)
Place of birth for the foreign-born population - Vietnam (%)
Place of birth for the foreign-born population - Other South Eastern Asia (%)
Place of birth for the foreign-born population - Armenia (%)
Place of birth for the foreign-born population - Iraq (%)
Place of birth for the foreign-born population - Israel (%)
Place of birth for the foreign-born population - Jordan (%)
Place of birth for the foreign-born population - Kuwait (%)
Place of birth for the foreign-born population - Lebanon (%)
Place of birth for the foreign-born population - Saudi Arabia (%)
Place of birth for the foreign-born population - Syria (%)
Place of birth for the foreign-born population - Turkey (%)
Place of birth for the foreign-born population - Yemen (%)
Place of birth for the foreign-born population - Other Western Asia (%)
Place of birth for the foreign-born population - Eritrea (%)
Place of birth for the foreign-born population - Ethiopia (%)
Place of birth for the foreign-born population - Kenya (%)
Place of birth for the foreign-born population - Somalia (%)
Place of birth for the foreign-born population - Uganda (%)
Place of birth for the foreign-born population - Zimbabwe (%)
Place of birth for the foreign-born population - Other Eastern Africa (%)
Place of birth for the foreign-born population - Cameroon (%)
Place of birth for the foreign-born population - Congo (%)
Place of birth for the foreign-born population - Democratic Republic of Congo (Zaire) (%)
Place of birth for the foreign-born population - Other Middle Africa (%)
Place of birth for the foreign-born population - Egypt (%)
Place of birth for the foreign-born population - Morocco (%)
Place of birth for the foreign-born population - Sudan (%)
Place of birth for the foreign-born population - Other Northern Africa (%)
Place of birth for the foreign-born population - South Africa (%)
Place of birth for the foreign-born population - Other Southern Africa (%)
Place of birth for the foreign-born population - Cabo Verde (%)
Place of birth for the foreign-born population - Ghana (%)
Place of birth for the foreign-born population - Liberia (%)
Place of birth for the foreign-born population - Nigeria (%)
Place of birth for the foreign-born population - Senegal (%)
Place of birth for the foreign-born population - Sierra Leone (%)
Place of birth for the foreign-born population - Other Western Africa (%)
Place of birth for the foreign-born population - Australia (%)
Place of birth for the foreign-born population - New Zealand (%)
Place of birth for the foreign-born population - Fiji (%)
Place of birth for the foreign-born population - Micronesia (%)
Place of birth for the foreign-born population - Bahamas (%)
Place of birth for the foreign-born population - Barbados (%)
Place of birth for the foreign-born population - Cuba (%)
Place of birth for the foreign-born population - Dominica (%)
Place of birth for the foreign-born population - Dominican Republic (%)
Place of birth for the foreign-born population - Grenada (%)
Place of birth for the foreign-born population - Haiti (%)
Place of birth for the foreign-born population - Jamaica (%)
Place of birth for the foreign-born population - St. Vincent and the Grenadines (%)
Place of birth for the foreign-born population - Trinidad and Tobago (%)
Place of birth for the foreign-born population - West Indies (%)
Place of birth for the foreign-born population - Other Caribbean (%)
Place of birth for the foreign-born population - Belize (%)
Place of birth for the foreign-born population - Costa Rica (%)
Place of birth for the foreign-born population - El Salvador (%)
Place of birth for the foreign-born population - Guatemala (%)
Place of birth for the foreign-born population - Honduras (%)
Place of birth for the foreign-born population - Mexico (%)
Place of birth for the foreign-born population - Nicaragua (%)
Place of birth for the foreign-born population - Panama (%)
Place of birth for the foreign-born population - Other Central America (%)
Place of birth for the foreign-born population - Argentina (%)
Place of birth for the foreign-born population - Bolivia (%)
Place of birth for the foreign-born population - Brazil (%)
Place of birth for the foreign-born population - Chile (%)
Place of birth for the foreign-born population - Colombia (%)
Place of birth for the foreign-born population - Ecuador (%)
Place of birth for the foreign-born population - Guyana (%)
Place of birth for the foreign-born population - Peru (%)
Place of birth for the foreign-born population - Uruguay (%)
Place of birth for the foreign-born population - Venezuela (%)
Place of birth for the foreign-born population - Other South America (%)
Place of birth for the foreign-born population - Canada (%)
Place of birth for the foreign-born population - Other Northern America (%)
Place of birth for the foreign-born population - Other (%)
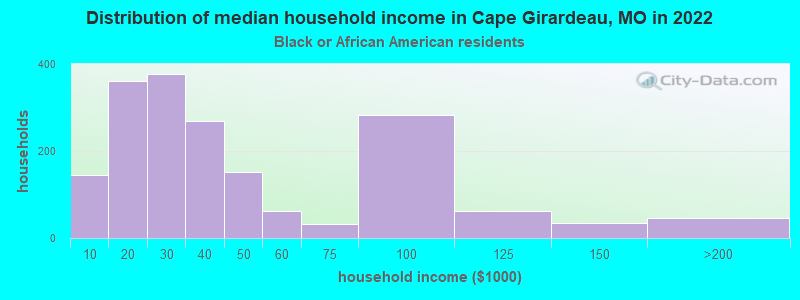
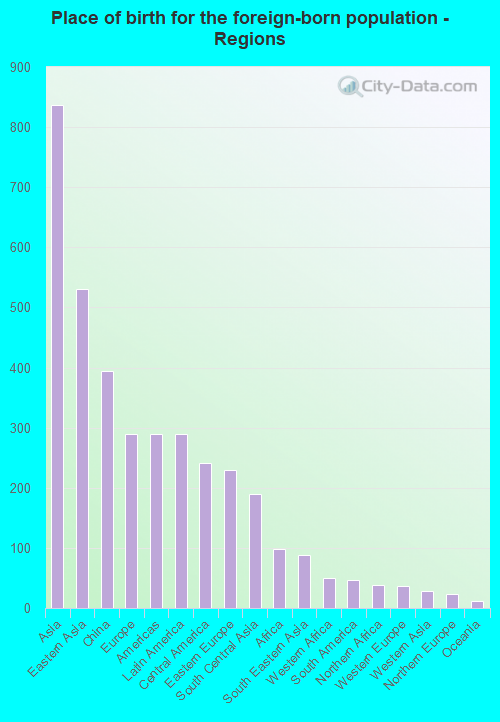
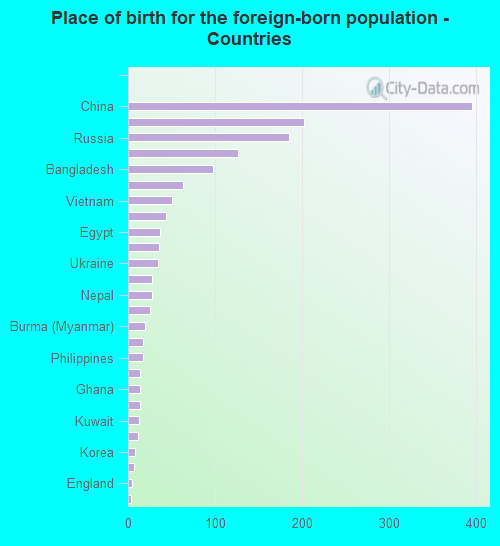
According to 2022 data, the most numerous races in Cape Girardeau, MO are White alone (29,635 residents), Black alone (5,213 residents), and Two or more races (2,094 residents). 94.0% of Cape Girardeau residents speak English at home. 3.8% of Cape Girardeau, MO residents are foreign-born (2.1% born in Asia, 0.7% born in Europe, 0.7% born in Latin America), which is 5.7% less than the foreign-born rate of 4.0% across the entire state of Missouri.
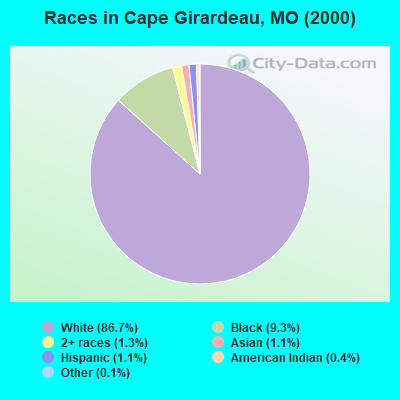
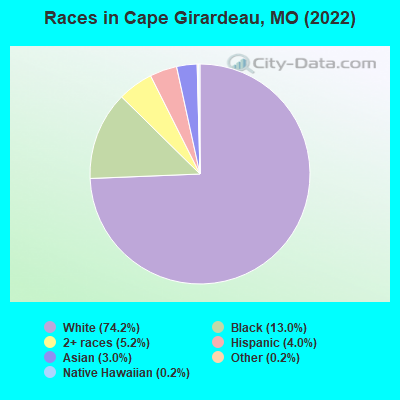
Race distribution in Cape Girardeau
2000 2022
4,686,474 83.8% White alone 625,667 11.2% Black alone 118,592 2.1% Hispanic 71,905 1.3% Two or more races 61,041 1.1% Asian alone 23,302 0.4% American Indian alone 5,291 0.09% Other race alone 2,939 0.05% Native Hawaiian and Other
4,733,411 76.6% White alone 656,739 10.6% Black alone 316,300 5.1% Two or more races 291,763 4.7% Hispanic 132,436 2.1% Asian alone 27,467 0.4% Other race alone 12,313 0.2% American Indian alone 7,528 0.1% Native Hawaiian and Other
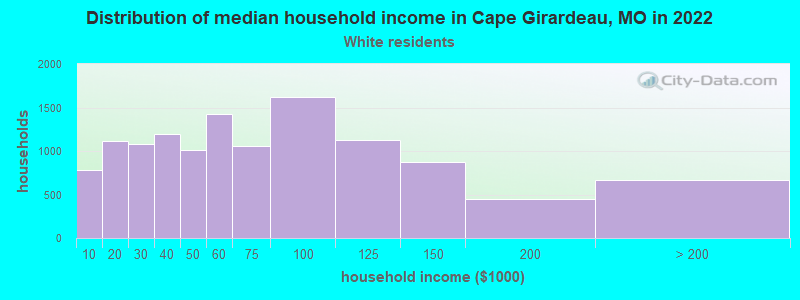
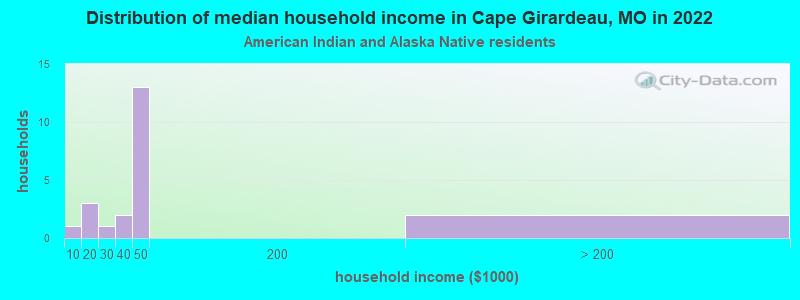
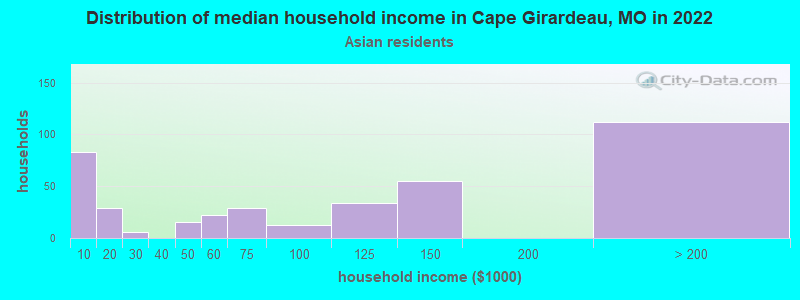
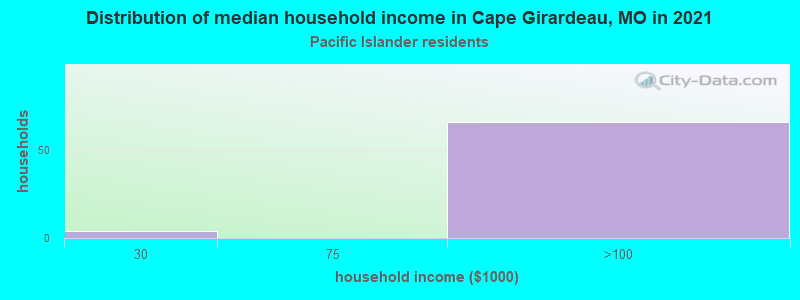
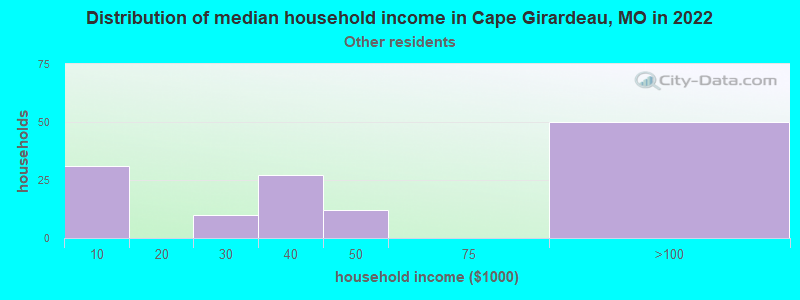
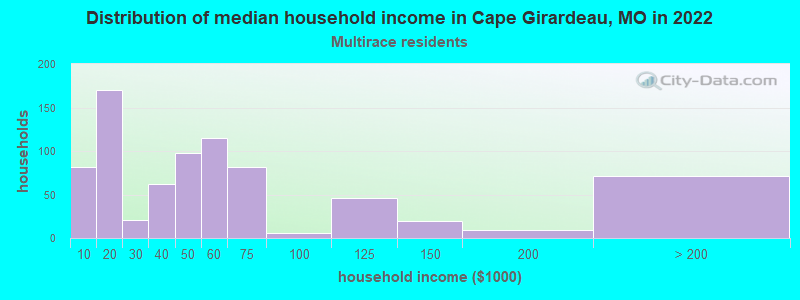
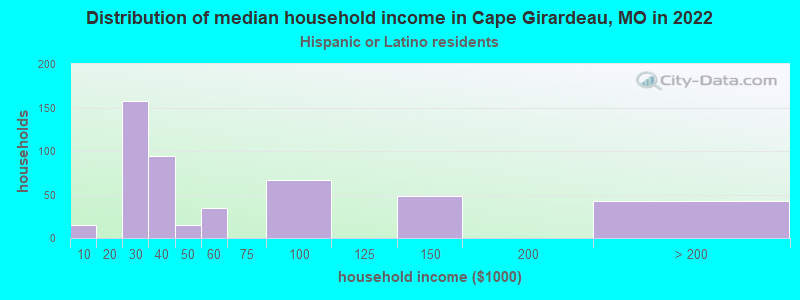
Income and house value in Cape Girardeau Median household income in 2022 $57,958 White non-Hispanic householders$20,715 Black householders$52,161 American Indian and Alaska Native householders$107,631 Asian householders$39,492 Two or more races householders$35,113 Hispanic or Latino race householdersMedian 2022 house value $195,041 White Non-Hispanic householders$122,138 Black or African American householders$105,656 American Indian or Alaska Native householders $433,190 Asian householders$161,231 Two or more races householders$77,551 Hispanic or Latino householders
Median age by race in Cape Girardeau
37.3 Median age for White residents35.9 39.5 24.5 Median age for Black or African American residents23.3 24.3 25.8 Median age for American Indian / Alaska Native residents27.6 24.7 45.7 Median age for Asian residents42.8 46.7 -693,430,656.2 Median age for Native Hawaiian / Pacific Islander residents-683,513,838.1 -666,666,666.0 28.6 Median age for Other race residents28.4 32.0 37.2 Median age for Two or more races residents39.6 29.0 38.0 Median age for White alone residents36.5 40.6 27.3 Median age for Hispanic or Latino residents43.6 18.1
Owner/renter occupied households by race in Cape Girardeau
House owners and renters - White residents 7,485 58.9% Owner occupied5,226 41.1% Renter occupiedHouse owners and renters - Black or African American residents 287 13.7% Owner occupied1,805 86.3% Renter occupiedHouse owners and renters - American Indian / Alaska Native residents 21 74.7% Owner occupied7 25.3% Renter occupiedHouse owners and renters - Asian residents 271 69.6% Owner occupied118 30.4% Renter occupiedHouse owners and renters - Native Hawaiian / Pacific Islander residents 53 81.9% Owner occupied12 18.1% Renter occupiedHouse owners and renters - Other race residents 56 45.0% Owner occupied69 55.0% Renter occupiedHouse owners and renters - Two or more races residents 517 54.8% Owner occupied427 45.2% Renter occupiedHouse owners and renters - White alone residents 7,458 59.6% Owner occupied5,063 40.4% Renter occupiedHouse owners and renters - Hispanic or Latino residents 189 42.4% Owner occupied257 57.6% Renter occupied
Language usage in Cape Girardeau
English speakers - Total 94.0% of residents of Cape Girardeau speak English at home.
2.6% of residents speak Spanish at home 769 79.5% Speak English very well198 20.5% Speak English less than very well3.4% of residents speak other language at home 633 49.0% Speak English very well658 51.0% Speak English less than very well
English speakers - Born in the United States 95.1% of residents of Cape Girardeau speak English at home.
3.6% of residents speak Spanish at home 408 91.9% Speak English very well36 8.1% Speak English less than very well1.3% of residents speak other language at home 121 78.1% Speak English very well34 21.9% Speak English less than very well
All residents speak only English at home
English speakers - Foreign-born 15.7% of residents of Cape Girardeau speak English at home.
19.3% of residents speak Spanish at home 153 51.7% Speak English very well143 48.3% Speak English less than very well65.3% of residents speak other language at home 379 37.9% Speak English very well621 62.1% Speak English less than very well
White (Caucasian) - Speak only English Native:
97.4% (28,203)Foreign-born:
12.6% (64)
White (Caucasian) - Speak another language Native:
3.0% (875)Foreign-born:
97.2% (496)
Black or African American - Speak only English Native:
99.1% (4,584)Foreign-born:
91.4% (58)
Black or African American - Speak another language Native:
0.2% (10)Foreign-born:
9.6% (6)
Asian - Speak only English Native:
79.2% (209)Foreign-born:
8.3% (69)
Asian - Speak another language Native:
25.2% (67)Foreign-born:
91.8% (761)
Native Hawaiian / Pacific Islander - Speak only English Native:
97.6% (57)Foreign-born:
100.0% (9)
Other race - Speak another language Native:
30.5% (58)Foreign-born:
94.9% (87)
Two or more races - Speak another language Native:
12.6% (277)Foreign-born:
100.0% (23)
White alone - Speak only English Native:
98.2% (27,997)Foreign-born:
14.4% (64)
White alone - Speak another language Native:
2.1% (607)Foreign-born:
100.0% (445)
Hispanic or Latino - Speak another language Native:
45.9% (482)Foreign-born:
99.4% (299)
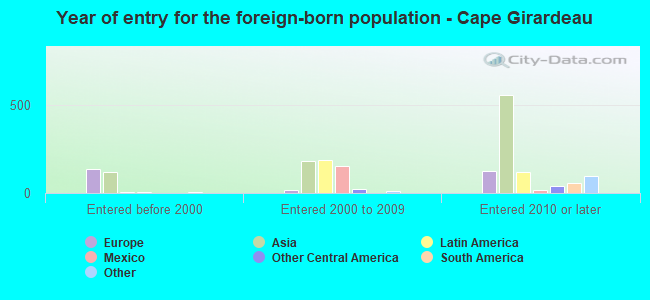
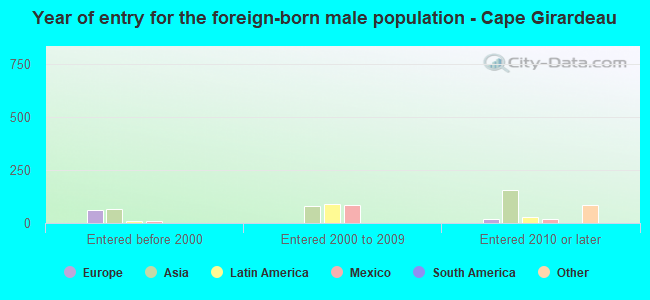
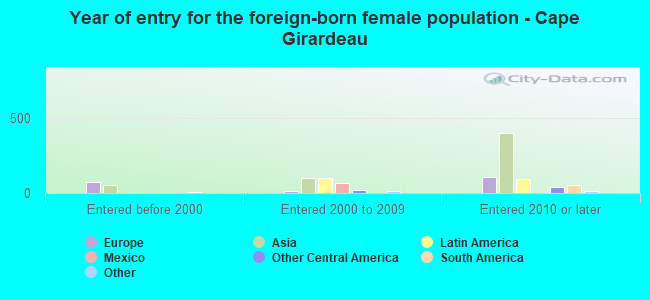
Foreign-born residents in Cape Girardeau 1,528 residents are foreign born (2.1% Asia , 0.7% Europe , 0.7% Latin America ).
This city:
3.8%Missouri:
4.2%
Marital status for residents in Cape Girardeau Marital status - White (Caucasian) population 15 years and over
Males 43.4% Never married43.6% Now married0.7% Separated2.9% Widowed9.4% DivorcedFemales 34.5% Never married40.3% Now married1.4% Separated12.1% Widowed11.7% DivorcedWomen who gave birth in the past 12 months Now married:
76.4% (207)Unmarried:
23.6% (64)
Women who did not give birth in the past 12 months Now married:
35.7% (2,765)Unmarried:
64.3% (4,984)
Marital status - Black or African American population 15 years and over
Males 58.0% Never married22.0% Now married1.0% Separated3.1% Widowed15.9% DivorcedFemales 66.3% Never married15.9% Now married3.5% Separated6.1% Widowed8.3% DivorcedWomen who gave birth in the past 12 months Now married:
48.9% (22)Unmarried:
51.1% (23)
Women who did not give birth in the past 12 months Now married:
15.1% (211)Unmarried:
84.9% (1,191)
Marital status - American Indian / Alaska Native population 15 years and over
Males 37.5% Never married43.8% Now married0.0% Separated0.0% Widowed18.8% DivorcedFemales 0.0% Never married93.7% Now married6.2% Separated0.0% Widowed0.0% DivorcedWomen who did not give birth in the past 12 months Now married:
100.0% (16)Unmarried:
0.0% (0)
Marital status - Asian population 15 years and over
Males 44.8% Never married55.2% Now married0.0% Separated0.0% Widowed0.0% DivorcedFemales 61.4% Never married35.0% Now married0.0% Separated3.6% Widowed0.0% DivorcedWomen who did not give birth in the past 12 months Now married:
32.9% (173)Unmarried:
67.1% (352)
Marital status - Other race population 15 years and over
Males 19.2% Never married75.8% Now married0.0% Separated0.0% Widowed5.1% DivorcedFemales 56.5% Never married43.5% Now married0.0% Separated0.0% Widowed0.0% DivorcedWomen who gave birth in the past 12 months Now married:
100.0% (55)Unmarried:
0.0% (0)
Women who did not give birth in the past 12 months Now married:
0.0% (0)Unmarried:
100.0% (58)
Marital status - Two or more races population 15 years and over
Males 73.0% Never married19.0% Now married0.0% Separated0.0% Widowed8.0% DivorcedFemales 52.9% Never married17.7% Now married8.3% Separated1.5% Widowed19.6% DivorcedWomen who gave birth in the past 12 months Now married:
59.6% (47)Unmarried:
40.4% (32)
Women who did not give birth in the past 12 months Now married:
20.5% (108)Unmarried:
79.5% (419)
Marital status - White alone, not Hispanic / Latino population 15 years and over
Males 43.6% Never married43.2% Now married0.7% Separated3.0% Widowed9.5% DivorcedFemales 34.5% Never married39.9% Now married1.4% Separated12.3% Widowed11.9% DivorcedWomen who gave birth in the past 12 months Now married:
73.8% (181)Unmarried:
26.2% (64)
Women who did not give birth in the past 12 months Now married:
35.3% (2,685)Unmarried:
64.7% (4,920)
Marital status - Hispanic or Latino population 15 years and over
Males 44.1% Never married53.1% Now married0.0% Separated0.0% Widowed2.8% DivorcedFemales 38.3% Never married60.1% Now married0.0% Separated0.0% Widowed1.6% DivorcedWomen who gave birth in the past 12 months Now married:
100.0% (78)Unmarried:
0.0% (0)
Women who did not give birth in the past 12 months Now married:
42.6% (116)Unmarried:
57.4% (157)
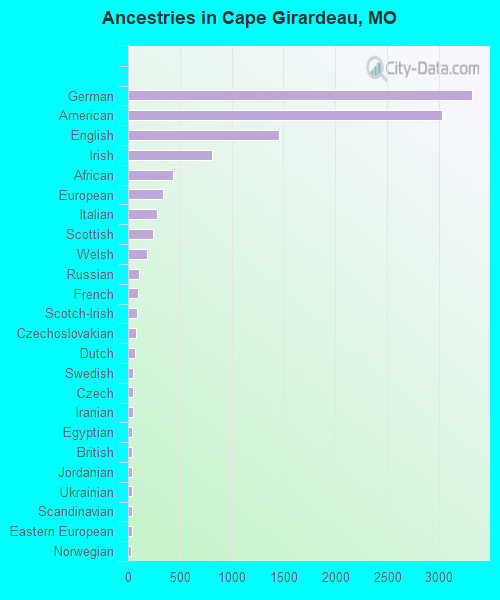
Ancestries in Cape Girardeau
3,317 19.7% German3,025 17.9% American1,455 8.6% English814 4.8% Irish436 2.6% African337 2.0% European276 1.6% Italian241 1.4% Scottish184 1.1% Welsh107 0.6% Russian98 0.6% French84 0.5% Scotch-Irish79 0.5% Czechoslovakian67 0.4% Dutch53 0.3% Swedish50 0.3% Czech45 0.3% Iranian41 0.2% Egyptian41 0.2% British40 0.2% Jordanian39 0.2% Ukrainian38 0.2% Scandinavian35 0.2% Eastern European33 0.2% Norwegian28 0.2% Nigerian18 0.1% Romanian14 0.08% Northern European10 0.06% Polish9 0.05% Bulgarian5 0.03% Macedonian4 0.02% Lithuanian4 0.02% Serbian
Geographical mobility in Cape Girardeau Same house 1 year ago 25,636 84.3% White (Caucasian)4,820 81.6% Black or African American46 100.0% American Indian / Alaska Native923 76.6% Asian80 100.0% Native Hawaiian / Pacific Islander124 44.3% Other race1,671 69.3% Two or more races25,260 84.8% White alone, not Hispanic / Latino1,068 71.6% Hispanic or LatinoMoved within same county 1,727 5.7% White / Caucasian919 15.5% Black or African American150 12.4% Asian372 15.4% Two or more races1,577 5.3% White alone, not Hispanic / Latino253 17.0% Hispanic or LatinoMoved within same state 1,353 4.4% White / Caucasian227 3.8% Black or African American48 4.0% Asian25 8.8% Other race187 7.8% Two or more races1,352 4.5% White alone, not Hispanic / Latino1 0.1% Hispanic or LatinoMoved from different state 1,271 4.2% White / Caucasian70 1.2% Black or African American22 1.8% Asian131 46.9% Other race111 4.6% Two or more races1,153 3.9% White alone, not Hispanic / Latino134 9.0% Hispanic or LatinoMoved from abroad 9 0.0% White56 4.7% Asian4 1.5% Other race9 0.0% White alone, not Hispanic / Latino4 0.2% Hispanic or Latino
Children Nativity (place of birth) in Cape Girardeau
Children under 6 years - Living with two parents Both parents native 1,074 100.0% NativeBoth parents foreign-born 133 100.0% NativeOne native, one foreign-born parent 158 100.0% NativeChildren under 6 years - Living with one parent Native parent 834 100.0% NativeChildren 6 to 17 years - Living with two parents Both parents native 2,594 100.0% NativeBoth parents foreign-born 65 100.0% NativeOne native, one foreign-born parent 275 97.5% Native7 2.5% Foreign-bornChildren 6 to 17 years - Living with one parent Native parent 1,496 99.3% Native11 0.7% Foreign-bornForeign-born parent 44 69.9% Native19 30.1% Foreign-born
Grandparents responsible for own grandchildren in Cape Girardeau
Grandparents (30 to 59 years) White / Caucasian 18 27.9% Responsible for grandchildren45 72.1% Not responsible for grandchildrenBlack or African American 36 40.5% Responsible for grandchildren53 59.5% Not responsible for grandchildrenTwo or more races 6 100.0% Not responsible for grandchildrenWhite alone, not Hispanic / Latino 18 27.8% Responsible for grandchildren46 72.2% Not responsible for grandchildrenGrandparents (60 years and over) White / Caucasian 126 70.5% Responsible for grandchildren53 29.5% Not responsible for grandchildrenBlack or African American 24 100.0% Responsible for grandchildrenTwo or more races 22 45.4% Responsible for grandchildren26 54.6% Not responsible for grandchildrenWhite alone, not Hispanic / Latino 127 70.2% Responsible for grandchildren54 29.8% Not responsible for grandchildren