Races in Camden, New Jersey (NJ) Detailed Stats
Data:
Races - White alone (%)
Races - White alone (% change since 2000)
Races - Black alone (%)
Races - Black alone (% change since 2000)
Races - American Indian alone (%)
Races - American Indian alone (% change since 2000)
Races - Asian alone (%)
Races - Asian alone (% change since 2000)
Races - Hispanic (%)
Races - Hispanic (% change since 2000)
Races - Native Hawaiian and Other Pacific Islander alone (%)
Races - Native Hawaiian and Other Pacific Islander alone (% change since 2000)
Races - Two or more races(%)
Races - Two or more races(% change since 2000)
Races - Other race alone (%)
Races - Other race alone (% change since 2000)
Racial diversity
Place of birth - Born in state of residence (%)
Place of birth - Born in state of residence (%) - White
Place of birth - Born in state of residence (%) - Black or African American
Place of birth - Born in state of residence (%) - Asian
Place of birth - Born in state of residence (%) - Hispanic or Latino
Place of birth - Born in state of residence (%) - American Indian and Alaska Native
Place of birth - Born in state of residence (%) - Multirace
Place of birth - Born in state of residence (%) - Other Race
Place of birth - Born in other state (%)
Place of birth - Born in other state (%) - White
Place of birth - Born in other state (%) - Black or African American
Place of birth - Born in other state (%) - Asian
Place of birth - Born in other state (%) - Hispanic or Latino
Place of birth - Born in other state (%) - American Indian and Alaska Native
Place of birth - Born in other state (%) - Multirace
Place of birth - Born in other state (%) - Other Race
Place of birth - Native, outside of US (%)
Place of birth - Native, outside of US (%) - White
Place of birth - Native, outside of US (%) - Black or African American
Place of birth - Native, outside of US (%) - Asian
Place of birth - Native, outside of US (%) - Hispanic or Latino
Place of birth - Native, outside of US (%) - American Indian and Alaska Native
Place of birth - Native, outside of US (%) - Multirace
Place of birth - Native, outside of US (%) - Other Race
Place of birth - Foreign born (%)
Place of birth - Foreign born (%) - White
Place of birth - Foreign born (%) - Black or African American
Place of birth - Foreign born (%) - Asian
Place of birth - Foreign born (%) - Hispanic or Latino
Place of birth - Foreign born (%) - American Indian and Alaska Native
Place of birth - Foreign born (%) - Multirace
Place of birth - Foreign born (%) - Other Race
Residents speaking English at home (%)
Residents speaking English at home - Born in the United States (%)
Residents speaking English at home - Native, born elsewhere (%)
Residents speaking English at home - Foreign born (%)
Residents speaking Spanish at home (%)
Residents speaking Spanish at home - Born in the United States (%)
Residents speaking Spanish at home - Native, born elsewhere (%)
Residents speaking Spanish at home - Foreign born (%)
Residents speaking other language at home (%)
Residents speaking other language at home - Born in the United States (%)
Residents speaking other language at home - Native, born elsewhere (%)
Residents speaking other language at home - Foreign born (%)
Marital status - Never married (%)
Marital status - Now married (%)
Marital status - Separated (%)
Marital status - Widowed (%)
Marital status - Divorced (%)
Ancestries Reported - Arab (%)
Ancestries Reported - Czech (%)
Ancestries Reported - Danish (%)
Ancestries Reported - Dutch (%)
Ancestries Reported - English (%)
Ancestries Reported - French (%)
Ancestries Reported - French Canadian (%)
Ancestries Reported - German (%)
Ancestries Reported - Greek (%)
Ancestries Reported - Hungarian (%)
Ancestries Reported - Irish (%)
Ancestries Reported - Italian (%)
Ancestries Reported - Lithuanian (%)
Ancestries Reported - Norwegian (%)
Ancestries Reported - Polish (%)
Ancestries Reported - Portuguese (%)
Ancestries Reported - Russian (%)
Ancestries Reported - Scotch-Irish (%)
Ancestries Reported - Scottish (%)
Ancestries Reported - Slovak (%)
Ancestries Reported - Subsaharan African (%)
Ancestries Reported - Swedish (%)
Ancestries Reported - Swiss (%)
Ancestries Reported - Ukrainian (%)
Ancestries Reported - United States (%)
Ancestries Reported - Welsh (%)
Ancestries Reported - West Indian (%)
Ancestries Reported - Other (%)
Geographical mobility - Same house 1 year ago (%)
Geographical mobility - Same house 1 year ago (%) - White
Geographical mobility - Same house 1 year ago (%) - Black or African American
Geographical mobility - Same house 1 year ago (%) - Asian
Geographical mobility - Same house 1 year ago (%) - Hispanic or Latino
Geographical mobility - Same house 1 year ago (%) - American Indian and Alaska Native
Geographical mobility - Same house 1 year ago (%) - Multirace
Geographical mobility - Same house 1 year ago (%) - Other Race
Geographical mobility - Moved within same county (%)
Geographical mobility - Moved within same county (%) - White
Geographical mobility - Moved within same county (%) - Black or African American
Geographical mobility - Moved within same county (%) - Asian
Geographical mobility - Moved within same county (%) - Hispanic or Latino
Geographical mobility - Moved within same county (%) - American Indian and Alaska Native
Geographical mobility - Moved within same county (%) - Multirace
Geographical mobility - Moved within same county (%) - Other Race
Geographical mobility - Moved from different county within same state (%)
Geographical mobility - Moved from different county within same state (%) - White
Geographical mobility - Moved from different county within same state (%) - Black or African American
Geographical mobility - Moved from different county within same state (%) - Asian
Geographical mobility - Moved from different county within same state (%) - Hispanic or Latino
Geographical mobility - Moved from different county within same state (%) - American Indian and Alaska Native
Geographical mobility - Moved from different county within same state (%) - Multirace
Geographical mobility - Moved from different county within same state (%) - Other Race
Geographical mobility - Moved from different state (%)
Geographical mobility - Moved from different state (%) - White
Geographical mobility - Moved from different state (%) - Black or African American
Geographical mobility - Moved from different state (%) - Asian
Geographical mobility - Moved from different state (%) - Hispanic or Latino
Geographical mobility - Moved from different state (%) - American Indian and Alaska Native
Geographical mobility - Moved from different state (%) - Multirace
Geographical mobility - Moved from different state (%) - Other Race
Geographical mobility - Moved from abroad (%)
Geographical mobility - Moved from abroad (%) - White
Geographical mobility - Moved from abroad (%) - Black or African American
Geographical mobility - Moved from abroad (%) - Asian
Geographical mobility - Moved from abroad (%) - Hispanic or Latino
Geographical mobility - Moved from abroad (%) - American Indian and Alaska Native
Geographical mobility - Moved from abroad (%) - Multirace
Geographical mobility - Moved from abroad (%) - Other Race
Place of birth for the foreign-born population - Ireland (%)
Place of birth for the foreign-born population - Denmark (%)
Place of birth for the foreign-born population - Norway (%)
Place of birth for the foreign-born population - Sweden (%)
Place of birth for the foreign-born population - United Kingdom (%)
Place of birth for the foreign-born population - England (%)
Place of birth for the foreign-born population - Scotland (%)
Place of birth for the foreign-born population - Other Northern Europe (%)
Place of birth for the foreign-born population - Austria (%)
Place of birth for the foreign-born population - Belgium (%)
Place of birth for the foreign-born population - France (%)
Place of birth for the foreign-born population - Germany (%)
Place of birth for the foreign-born population - Netherlands (%)
Place of birth for the foreign-born population - Switzerland (%)
Place of birth for the foreign-born population - Other Western Europe (%)
Place of birth for the foreign-born population - Greece (%)
Place of birth for the foreign-born population - Italy (%)
Place of birth for the foreign-born population - Portugal (%)
Place of birth for the foreign-born population - Spain (%)
Place of birth for the foreign-born population - Other Southern Europe (%)
Place of birth for the foreign-born population - Albania (%)
Place of birth for the foreign-born population - Belarus (%)
Place of birth for the foreign-born population - Bosnia and Herzegovina (%)
Place of birth for the foreign-born population - Bulgaria (%)
Place of birth for the foreign-born population - Croatia (%)
Place of birth for the foreign-born population - Czechoslovakia (%)
Place of birth for the foreign-born population - Hungary (%)
Place of birth for the foreign-born population - Latvia (%)
Place of birth for the foreign-born population - Lithuania (%)
Place of birth for the foreign-born population - North Macedonia (Macedonia) (%)
Place of birth for the foreign-born population - Moldova (%)
Place of birth for the foreign-born population - Poland (%)
Place of birth for the foreign-born population - Romania (%)
Place of birth for the foreign-born population - Russia (%)
Place of birth for the foreign-born population - Serbia (%)
Place of birth for the foreign-born population - Ukraine (%)
Place of birth for the foreign-born population - Other Eastern Europe (%)
Place of birth for the foreign-born population - China (%)
Place of birth for the foreign-born population - Hong Kong (%)
Place of birth for the foreign-born population - Taiwan (%)
Place of birth for the foreign-born population - Japan (%)
Place of birth for the foreign-born population - Korea (%)
Place of birth for the foreign-born population - Other Eastern Asia (%)
Place of birth for the foreign-born population - Afghanistan (%)
Place of birth for the foreign-born population - Bangladesh (%)
Place of birth for the foreign-born population - India (%)
Place of birth for the foreign-born population - Iran (%)
Place of birth for the foreign-born population - Kazakhstan (%)
Place of birth for the foreign-born population - Nepal (%)
Place of birth for the foreign-born population - Pakistan (%)
Place of birth for the foreign-born population - Sri Lanka (%)
Place of birth for the foreign-born population - Uzbekistan (%)
Place of birth for the foreign-born population - Other South Central Asia (%)
Place of birth for the foreign-born population - Burma (%)
Place of birth for the foreign-born population - Cambodia (%)
Place of birth for the foreign-born population - Indonesia (%)
Place of birth for the foreign-born population - Laos (%)
Place of birth for the foreign-born population - Malaysia (%)
Place of birth for the foreign-born population - Philippines (%)
Place of birth for the foreign-born population - Singapore (%)
Place of birth for the foreign-born population - Thailand (%)
Place of birth for the foreign-born population - Vietnam (%)
Place of birth for the foreign-born population - Other South Eastern Asia (%)
Place of birth for the foreign-born population - Armenia (%)
Place of birth for the foreign-born population - Iraq (%)
Place of birth for the foreign-born population - Israel (%)
Place of birth for the foreign-born population - Jordan (%)
Place of birth for the foreign-born population - Kuwait (%)
Place of birth for the foreign-born population - Lebanon (%)
Place of birth for the foreign-born population - Saudi Arabia (%)
Place of birth for the foreign-born population - Syria (%)
Place of birth for the foreign-born population - Turkey (%)
Place of birth for the foreign-born population - Yemen (%)
Place of birth for the foreign-born population - Other Western Asia (%)
Place of birth for the foreign-born population - Eritrea (%)
Place of birth for the foreign-born population - Ethiopia (%)
Place of birth for the foreign-born population - Kenya (%)
Place of birth for the foreign-born population - Somalia (%)
Place of birth for the foreign-born population - Uganda (%)
Place of birth for the foreign-born population - Zimbabwe (%)
Place of birth for the foreign-born population - Other Eastern Africa (%)
Place of birth for the foreign-born population - Cameroon (%)
Place of birth for the foreign-born population - Congo (%)
Place of birth for the foreign-born population - Democratic Republic of Congo (Zaire) (%)
Place of birth for the foreign-born population - Other Middle Africa (%)
Place of birth for the foreign-born population - Egypt (%)
Place of birth for the foreign-born population - Morocco (%)
Place of birth for the foreign-born population - Sudan (%)
Place of birth for the foreign-born population - Other Northern Africa (%)
Place of birth for the foreign-born population - South Africa (%)
Place of birth for the foreign-born population - Other Southern Africa (%)
Place of birth for the foreign-born population - Cabo Verde (%)
Place of birth for the foreign-born population - Ghana (%)
Place of birth for the foreign-born population - Liberia (%)
Place of birth for the foreign-born population - Nigeria (%)
Place of birth for the foreign-born population - Senegal (%)
Place of birth for the foreign-born population - Sierra Leone (%)
Place of birth for the foreign-born population - Other Western Africa (%)
Place of birth for the foreign-born population - Australia (%)
Place of birth for the foreign-born population - New Zealand (%)
Place of birth for the foreign-born population - Fiji (%)
Place of birth for the foreign-born population - Micronesia (%)
Place of birth for the foreign-born population - Bahamas (%)
Place of birth for the foreign-born population - Barbados (%)
Place of birth for the foreign-born population - Cuba (%)
Place of birth for the foreign-born population - Dominica (%)
Place of birth for the foreign-born population - Dominican Republic (%)
Place of birth for the foreign-born population - Grenada (%)
Place of birth for the foreign-born population - Haiti (%)
Place of birth for the foreign-born population - Jamaica (%)
Place of birth for the foreign-born population - St. Vincent and the Grenadines (%)
Place of birth for the foreign-born population - Trinidad and Tobago (%)
Place of birth for the foreign-born population - West Indies (%)
Place of birth for the foreign-born population - Other Caribbean (%)
Place of birth for the foreign-born population - Belize (%)
Place of birth for the foreign-born population - Costa Rica (%)
Place of birth for the foreign-born population - El Salvador (%)
Place of birth for the foreign-born population - Guatemala (%)
Place of birth for the foreign-born population - Honduras (%)
Place of birth for the foreign-born population - Mexico (%)
Place of birth for the foreign-born population - Nicaragua (%)
Place of birth for the foreign-born population - Panama (%)
Place of birth for the foreign-born population - Other Central America (%)
Place of birth for the foreign-born population - Argentina (%)
Place of birth for the foreign-born population - Bolivia (%)
Place of birth for the foreign-born population - Brazil (%)
Place of birth for the foreign-born population - Chile (%)
Place of birth for the foreign-born population - Colombia (%)
Place of birth for the foreign-born population - Ecuador (%)
Place of birth for the foreign-born population - Guyana (%)
Place of birth for the foreign-born population - Peru (%)
Place of birth for the foreign-born population - Uruguay (%)
Place of birth for the foreign-born population - Venezuela (%)
Place of birth for the foreign-born population - Other South America (%)
Place of birth for the foreign-born population - Canada (%)
Place of birth for the foreign-born population - Other Northern America (%)
Place of birth for the foreign-born population - Other (%)
Latest news about races in Camden, NJ collected exclusively by city-data.com from local newspapers, TV, and radio stations
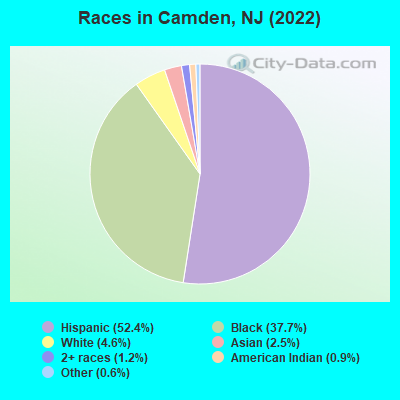
According to 2022 data, the most numerous races in Camden, NJ are White alone (3,268 residents), Hispanic (37,230 residents), and Black alone (26,793 residents). 54.8% of Camden residents speak English at home. 17.4% of Camden, NJ residents are foreign-born (15.1% born in Latin America), which is 32.3% less than the foreign-born rate of 23.0% across the entire state of New Jersey.
Race distribution in Camden
2000 2022
5,557,209 66.0% White alone 1,117,191 13.3% Hispanic 1,096,171 13.0% Black alone 477,012 5.7% Asian alone 133,689 1.6% Two or more races 19,565 0.2% Other race alone 11,338 0.1% American Indian alone 2,175 0.03% Native Hawaiian and Other
4,766,476 51.5% White alone 2,028,470 21.9% Hispanic 1,111,632 12.0% Black alone 923,546 10.0% Asian alone 332,237 3.6% Two or more races 89,847 1.0% Other race alone 8,557 0.09% American Indian alone 934 0.01% Native Hawaiian and Other
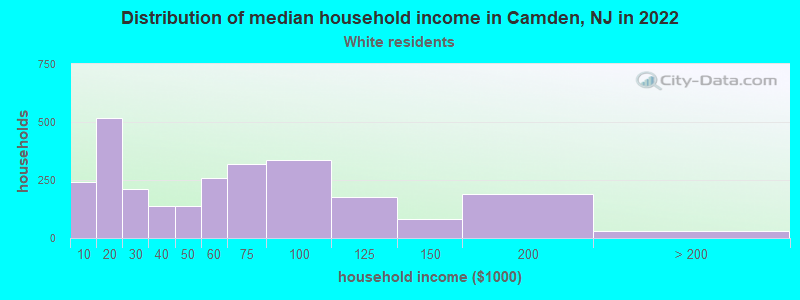
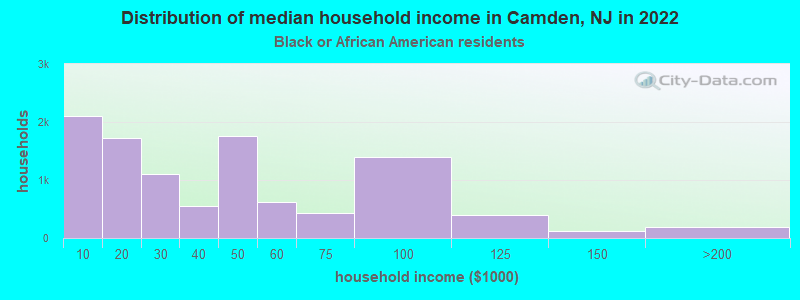
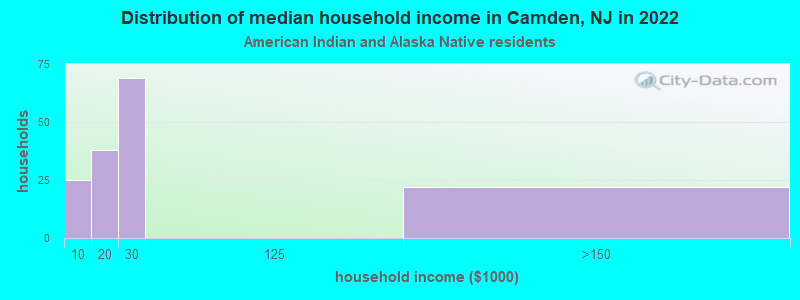
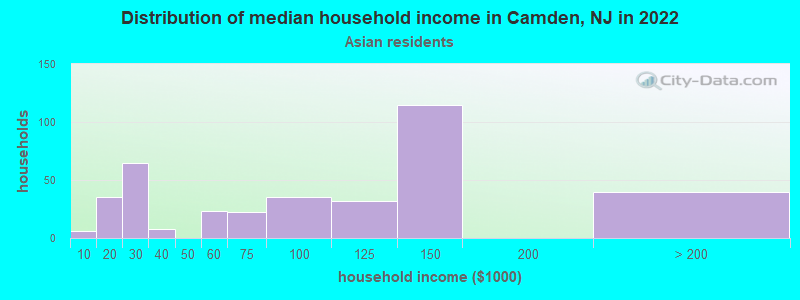
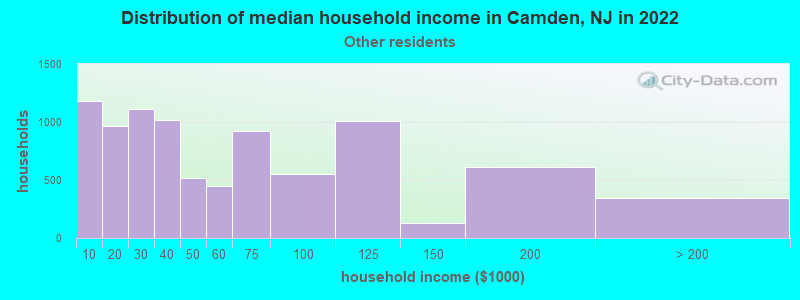
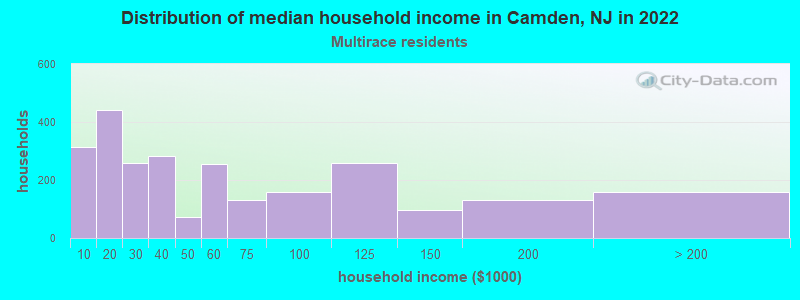
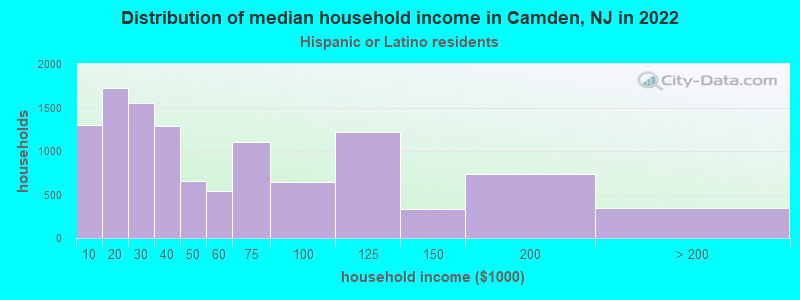
Income and house value in Camden Median household income in 2022 $49,157 White non-Hispanic householders$34,750 Black householders$2,499 American Indian and Alaska Native householders$89,580 Asian householders$42,878 Some other race householders$30,374 Two or more races householders$37,981 Hispanic or Latino race householdersMedian 2022 house value $98,355 White Non-Hispanic householders$92,352 Black or African American householders$86,811 American Indian or Alaska Native householders $101,357 Asian householders$92,583 Some other race householders$97,201 Two or more races householders$93,507 Hispanic or Latino householders
Median age by race in Camden
31.1 Median age for White residents28.5 31.4 35.1 Median age for Black or African American residents41.1 34.5 11.4 Median age for American Indian / Alaska Native residents13.7 11.4 30.7 Median age for Asian residents22.8 31.0 30.0 Median age for Native Hawaiian / Pacific Islander residents-666,666,666.0 -666,666,666.0 34.5 Median age for Other race residents35.3 33.4 22.3 Median age for Two or more races residents20.1 22.7 54.4 Median age for White alone residents58.8 36.9 30.7 Median age for Hispanic or Latino residents32.7 29.0
Owner/renter occupied households by race in Camden
House owners and renters - White residents 833 35.2% Owner occupied1,531 64.8% Renter occupiedHouse owners and renters - Black or African American residents 3,259 31.4% Owner occupied7,108 68.6% Renter occupiedHouse owners and renters - American Indian / Alaska Native residents 15 6.9% Owner occupied204 93.1% Renter occupiedHouse owners and renters - Asian residents 294 73.7% Owner occupied105 26.3% Renter occupiedHouse owners and renters - Native Hawaiian / Pacific Islander residents 21 100.0% Renter occupiedHouse owners and renters - Other race residents 3,247 36.9% Owner occupied5,552 63.1% Renter occupiedHouse owners and renters - Two or more races residents 1,012 52.8% Owner occupied903 47.2% Renter occupiedHouse owners and renters - White alone residents 754 42.4% Owner occupied1,023 57.6% Renter occupiedHouse owners and renters - Hispanic or Latino residents 4,098 35.8% Owner occupied7,341 64.2% Renter occupied
Language usage in Camden
English speakers - Total 54.8% of residents of Camden speak English at home.
42.3% of residents speak Spanish at home 13,443 47.2% Speak English very well15,066 52.8% Speak English less than very well3.0% of residents speak other language at home 1,116 55.7% Speak English very well886 44.3% Speak English less than very well
English speakers - Born in the United States 76.5% of residents of Camden speak English at home.
23.5% of residents speak Spanish at home 1,529 72.0% Speak English very well595 28.0% Speak English less than very well
English speakers - Native, born elsewhere 9.1% of residents of Camden speak English at home.
90.1% of residents speak Spanish at home 2,256 39.6% Speak English very well3,439 60.4% Speak English less than very well0.8% of residents speak other language at home 52 100.0% Speak English very well
English speakers - Foreign-born 16.5% of residents of Camden speak English at home.
74.7% of residents speak Spanish at home 2,560 21.2% Speak English very well9,509 78.8% Speak English less than very well8.9% of residents speak other language at home 649 45.4% Speak English very well782 54.6% Speak English less than very well
White (Caucasian) - Speak only English Native:
54.5% (2,849)Foreign-born:
7.0% (50)
White (Caucasian) - Speak another language Native:
41.6% (2,178)Foreign-born:
93.8% (668)
Black or African American - Speak only English Native:
97.5% (25,410)Foreign-born:
62.5% (670)
Black or African American - Speak another language Native:
2.8% (725)Foreign-born:
39.0% (418)
American Indian / Alaska Native - Speak only English Native:
62.9% (309)Foreign-born:
25.7% (28)
American Indian / Alaska Native - Speak another language Native:
20.3% (100)Foreign-born:
77.8% (85)
Asian - Speak only English Native:
50.1% (303)Foreign-born:
0.7% (6)
Asian - Speak another language Native:
47.6% (288)Foreign-born:
97.7% (871)
Other race - Speak only English Native:
28.9% (5,060)Foreign-born:
10.7% (1,091)
Other race - Speak another language Native:
71.1% (12,428)Foreign-born:
89.3% (9,113)
Two or more races - Speak another language Native:
43.5% (1,403)Foreign-born:
100.0% (2,331)
White alone - Speak only English Native:
91.1% (2,082)Foreign-born:
38.0% (19)
White alone - Speak another language Native:
10.4% (237)Foreign-born:
61.2% (31)
Hispanic or Latino - Speak only English Native:
32.0% (7,247)Foreign-born:
8.4% (1,100)
Hispanic or Latino - Speak another language Native:
68.0% (15,432)Foreign-born:
91.6% (12,069)
Foreign-born residents in Camden 12,539 residents are foreign born (15.1% Latin America ).
This city:
17.4%New Jersey:
23.2%
Marital status for residents in Camden Marital status - White (Caucasian) population 15 years and over
Males 59.1% Never married26.2% Now married1.1% Separated6.6% Widowed7.0% DivorcedFemales 64.0% Never married16.8% Now married3.7% Separated13.7% Widowed1.7% DivorcedWomen who gave birth in the past 12 months Now married:
66.7% (48)Unmarried:
33.3% (24)
Women who did not give birth in the past 12 months Now married:
24.2% (391)Unmarried:
75.8% (1,228)
Marital status - Black or African American population 15 years and over
Males 75.1% Never married17.6% Now married0.0% Separated2.6% Widowed4.7% DivorcedFemales 67.6% Never married12.5% Now married1.2% Separated9.5% Widowed9.1% DivorcedWomen who gave birth in the past 12 months Now married:
3.7% (17)Unmarried:
96.3% (455)
Women who did not give birth in the past 12 months Now married:
13.4% (1,007)Unmarried:
86.6% (6,532)
Marital status - American Indian / Alaska Native population 15 years and over
Males 54.9% Never married45.1% Now married0.0% Separated0.0% Widowed0.0% DivorcedFemales 85.8% Never married14.2% Now married0.0% Separated0.0% Widowed0.0% DivorcedWomen who did not give birth in the past 12 months Now married:
16.3% (23)Unmarried:
83.7% (119)
Marital status - Asian population 15 years and over
Males 52.8% Never married23.7% Now married9.3% Separated1.5% Widowed12.6% DivorcedFemales 52.7% Never married31.4% Now married2.2% Separated2.7% Widowed11.0% DivorcedWomen who did not give birth in the past 12 months Now married:
32.0% (109)Unmarried:
68.0% (232)
Marital status - Native Hawaiian / Pacific Islander population 15 years and over
Males 100.0% Never married0.0% Now married0.0% Separated0.0% Widowed0.0% DivorcedFemales 100.0% Never married0.0% Now married0.0% Separated0.0% Widowed0.0% DivorcedWomen who did not give birth in the past 12 months Now married:
0.0% (0)Unmarried:
100.0% (19)
Marital status - Other race population 15 years and over
Males 57.2% Never married23.0% Now married5.3% Separated0.0% Widowed14.6% DivorcedFemales 57.9% Never married20.6% Now married2.3% Separated6.9% Widowed12.4% DivorcedWomen who gave birth in the past 12 months Now married:
48.0% (252)Unmarried:
52.0% (274)
Women who did not give birth in the past 12 months Now married:
25.9% (1,870)Unmarried:
74.1% (5,341)
Marital status - Two or more races population 15 years and over
Males 56.5% Never married34.1% Now married0.0% Separated1.4% Widowed8.0% DivorcedFemales 46.8% Never married20.3% Now married20.8% Separated7.3% Widowed4.8% DivorcedWomen who gave birth in the past 12 months Now married:
0.0% (0)Unmarried:
100.0% (179)
Women who did not give birth in the past 12 months Now married:
30.7% (802)Unmarried:
69.3% (1,813)
Marital status - White alone, not Hispanic / Latino population 15 years and over
Males 53.3% Never married33.4% Now married1.5% Separated2.2% Widowed9.6% DivorcedFemales 51.9% Never married25.8% Now married1.8% Separated20.5% Widowed0.0% DivorcedWomen who did not give birth in the past 12 months Now married:
15.8% (79)Unmarried:
84.2% (422)
Marital status - Hispanic or Latino population 15 years and over
Males 56.3% Never married24.9% Now married4.4% Separated1.0% Widowed13.3% DivorcedFemales 58.4% Never married19.7% Now married5.2% Separated6.5% Widowed10.2% DivorcedWomen who gave birth in the past 12 months Now married:
12.9% (80)Unmarried:
87.1% (539)
Women who did not give birth in the past 12 months Now married:
23.6% (2,281)Unmarried:
76.4% (7,370)
Ancestries in Camden
530 1.2% Nigerian529 1.2% American473 1.1% Haitian337 0.8% Jamaican284 0.6% Irish268 0.6% Moroccan178 0.4% African171 0.4% German123 0.3% Trinidadian and Tobagonian97 0.2% Italian57 0.1% Ethiopian49 0.1% British West Indian33 0.07% Polish31 0.07% Guyanese24 0.05% Dutch24 0.05% Eastern European24 0.05% European17 0.04% Brazilian14 0.03% Hungarian11 0.02% French9 0.02% Palestinian6 0.01% English
Geographical mobility in Camden Same house 1 year ago 4,906 90.9% White (Caucasian)24,329 88.6% Black or African American652 96.6% American Indian / Alaska Native1,537 99.6% Asian62 75.2% Native Hawaiian / Pacific Islander25,062 89.5% Other race7,776 86.2% Two or more races2,775 84.9% White alone, not Hispanic / Latino33,182 90.4% Hispanic or LatinoMoved within same county 3 0.1% White / Caucasian1,833 6.7% Black or African American20 24.3% Native Hawaiian / Pacific Islander1,337 4.8% Other race414 4.6% Two or more races3 0.1% White alone, not Hispanic / Latino1,582 4.3% Hispanic or LatinoMoved within same state 32 0.6% White / Caucasian696 2.5% Black or African American5 0.4% Asian988 3.5% Other race46 0.5% Two or more races32 1.0% White alone, not Hispanic / Latino1,038 2.8% Hispanic or LatinoMoved from different state 458 8.5% White / Caucasian611 2.2% Black or African American490 1.8% Other race101 1.1% Two or more races458 14.0% White alone, not Hispanic / Latino493 1.3% Hispanic or LatinoMoved from abroad 18 1.1% Asian121 0.4% Other race243 2.7% Two or more races427 1.2% Hispanic or Latino
Children Nativity (place of birth) in Camden
Children under 6 years - Living with two parents Both parents native 237 100.0% NativeBoth parents foreign-born 490 88.6% Native63 11.4% Foreign-bornOne native, one foreign-born parent 112 100.0% NativeChildren under 6 years - Living with one parent Native parent 4,345 100.0% NativeForeign-born parent 352 84.4% Native65 15.6% Foreign-bornChildren 6 to 17 years - Living with two parents Both parents native 930 100.0% NativeBoth parents foreign-born 951 81.3% Native218 18.7% Foreign-bornOne native, one foreign-born parent 316 90.4% Native34 9.6% Foreign-bornChildren 6 to 17 years - Living with one parent Native parent 7,855 100.0% NativeForeign-born parent 2,611 59.6% Native1,771 40.4% Foreign-born
Grandparents responsible for own grandchildren in Camden
Grandparents (30 to 59 years) White / Caucasian 26 54.1% Responsible for grandchildren22 45.9% Not responsible for grandchildrenBlack or African American 420 61.1% Responsible for grandchildren267 38.9% Not responsible for grandchildrenOther race 362 46.8% Responsible for grandchildren412 53.2% Not responsible for grandchildrenTwo or more races 16 100.0% Not responsible for grandchildrenWhite alone, not Hispanic / Latino 7 100.0% Not responsible for grandchildrenHispanic or Latino 383 47.6% Responsible for grandchildren422 52.4% Not responsible for grandchildrenGrandparents (60 years and over) White / Caucasian 49 46.6% Responsible for grandchildren56 53.4% Not responsible for grandchildrenBlack or African American 317 42.4% Responsible for grandchildren430 57.6% Not responsible for grandchildrenOther race 162 22.8% Responsible for grandchildren551 77.2% Not responsible for grandchildrenTwo or more races 5 5.2% Responsible for grandchildren85 94.8% Not responsible for grandchildrenWhite alone, not Hispanic / Latino 13 100.0% Not responsible for grandchildrenHispanic or Latino 312 60.7% Responsible for grandchildren202 39.3% Not responsible for grandchildren