Races in California, Maryland (MD) Detailed Stats
Data:
Races - White alone (%)
Races - White alone (% change since 2000)
Races - Black alone (%)
Races - Black alone (% change since 2000)
Races - American Indian alone (%)
Races - American Indian alone (% change since 2000)
Races - Asian alone (%)
Races - Asian alone (% change since 2000)
Races - Hispanic (%)
Races - Hispanic (% change since 2000)
Races - Native Hawaiian and Other Pacific Islander alone (%)
Races - Native Hawaiian and Other Pacific Islander alone (% change since 2000)
Races - Two or more races(%)
Races - Two or more races(% change since 2000)
Races - Other race alone (%)
Races - Other race alone (% change since 2000)
Racial diversity
Place of birth - Born in state of residence (%)
Place of birth - Born in state of residence (%) - White
Place of birth - Born in state of residence (%) - Black or African American
Place of birth - Born in state of residence (%) - Asian
Place of birth - Born in state of residence (%) - Hispanic or Latino
Place of birth - Born in state of residence (%) - American Indian and Alaska Native
Place of birth - Born in state of residence (%) - Multirace
Place of birth - Born in state of residence (%) - Other Race
Place of birth - Born in other state (%)
Place of birth - Born in other state (%) - White
Place of birth - Born in other state (%) - Black or African American
Place of birth - Born in other state (%) - Asian
Place of birth - Born in other state (%) - Hispanic or Latino
Place of birth - Born in other state (%) - American Indian and Alaska Native
Place of birth - Born in other state (%) - Multirace
Place of birth - Born in other state (%) - Other Race
Place of birth - Native, outside of US (%)
Place of birth - Native, outside of US (%) - White
Place of birth - Native, outside of US (%) - Black or African American
Place of birth - Native, outside of US (%) - Asian
Place of birth - Native, outside of US (%) - Hispanic or Latino
Place of birth - Native, outside of US (%) - American Indian and Alaska Native
Place of birth - Native, outside of US (%) - Multirace
Place of birth - Native, outside of US (%) - Other Race
Place of birth - Foreign born (%)
Place of birth - Foreign born (%) - White
Place of birth - Foreign born (%) - Black or African American
Place of birth - Foreign born (%) - Asian
Place of birth - Foreign born (%) - Hispanic or Latino
Place of birth - Foreign born (%) - American Indian and Alaska Native
Place of birth - Foreign born (%) - Multirace
Place of birth - Foreign born (%) - Other Race
Residents speaking English at home (%)
Residents speaking English at home - Born in the United States (%)
Residents speaking English at home - Native, born elsewhere (%)
Residents speaking English at home - Foreign born (%)
Residents speaking Spanish at home (%)
Residents speaking Spanish at home - Born in the United States (%)
Residents speaking Spanish at home - Native, born elsewhere (%)
Residents speaking Spanish at home - Foreign born (%)
Residents speaking other language at home (%)
Residents speaking other language at home - Born in the United States (%)
Residents speaking other language at home - Native, born elsewhere (%)
Residents speaking other language at home - Foreign born (%)
Marital status - Never married (%)
Marital status - Now married (%)
Marital status - Separated (%)
Marital status - Widowed (%)
Marital status - Divorced (%)
Ancestries Reported - Arab (%)
Ancestries Reported - Czech (%)
Ancestries Reported - Danish (%)
Ancestries Reported - Dutch (%)
Ancestries Reported - English (%)
Ancestries Reported - French (%)
Ancestries Reported - French Canadian (%)
Ancestries Reported - German (%)
Ancestries Reported - Greek (%)
Ancestries Reported - Hungarian (%)
Ancestries Reported - Irish (%)
Ancestries Reported - Italian (%)
Ancestries Reported - Lithuanian (%)
Ancestries Reported - Norwegian (%)
Ancestries Reported - Polish (%)
Ancestries Reported - Portuguese (%)
Ancestries Reported - Russian (%)
Ancestries Reported - Scotch-Irish (%)
Ancestries Reported - Scottish (%)
Ancestries Reported - Slovak (%)
Ancestries Reported - Subsaharan African (%)
Ancestries Reported - Swedish (%)
Ancestries Reported - Swiss (%)
Ancestries Reported - Ukrainian (%)
Ancestries Reported - United States (%)
Ancestries Reported - Welsh (%)
Ancestries Reported - West Indian (%)
Ancestries Reported - Other (%)
Geographical mobility - Same house 1 year ago (%)
Geographical mobility - Same house 1 year ago (%) - White
Geographical mobility - Same house 1 year ago (%) - Black or African American
Geographical mobility - Same house 1 year ago (%) - Asian
Geographical mobility - Same house 1 year ago (%) - Hispanic or Latino
Geographical mobility - Same house 1 year ago (%) - American Indian and Alaska Native
Geographical mobility - Same house 1 year ago (%) - Multirace
Geographical mobility - Same house 1 year ago (%) - Other Race
Geographical mobility - Moved within same county (%)
Geographical mobility - Moved within same county (%) - White
Geographical mobility - Moved within same county (%) - Black or African American
Geographical mobility - Moved within same county (%) - Asian
Geographical mobility - Moved within same county (%) - Hispanic or Latino
Geographical mobility - Moved within same county (%) - American Indian and Alaska Native
Geographical mobility - Moved within same county (%) - Multirace
Geographical mobility - Moved within same county (%) - Other Race
Geographical mobility - Moved from different county within same state (%)
Geographical mobility - Moved from different county within same state (%) - White
Geographical mobility - Moved from different county within same state (%) - Black or African American
Geographical mobility - Moved from different county within same state (%) - Asian
Geographical mobility - Moved from different county within same state (%) - Hispanic or Latino
Geographical mobility - Moved from different county within same state (%) - American Indian and Alaska Native
Geographical mobility - Moved from different county within same state (%) - Multirace
Geographical mobility - Moved from different county within same state (%) - Other Race
Geographical mobility - Moved from different state (%)
Geographical mobility - Moved from different state (%) - White
Geographical mobility - Moved from different state (%) - Black or African American
Geographical mobility - Moved from different state (%) - Asian
Geographical mobility - Moved from different state (%) - Hispanic or Latino
Geographical mobility - Moved from different state (%) - American Indian and Alaska Native
Geographical mobility - Moved from different state (%) - Multirace
Geographical mobility - Moved from different state (%) - Other Race
Geographical mobility - Moved from abroad (%)
Geographical mobility - Moved from abroad (%) - White
Geographical mobility - Moved from abroad (%) - Black or African American
Geographical mobility - Moved from abroad (%) - Asian
Geographical mobility - Moved from abroad (%) - Hispanic or Latino
Geographical mobility - Moved from abroad (%) - American Indian and Alaska Native
Geographical mobility - Moved from abroad (%) - Multirace
Geographical mobility - Moved from abroad (%) - Other Race
Place of birth for the foreign-born population - Ireland (%)
Place of birth for the foreign-born population - Denmark (%)
Place of birth for the foreign-born population - Norway (%)
Place of birth for the foreign-born population - Sweden (%)
Place of birth for the foreign-born population - United Kingdom (%)
Place of birth for the foreign-born population - England (%)
Place of birth for the foreign-born population - Scotland (%)
Place of birth for the foreign-born population - Other Northern Europe (%)
Place of birth for the foreign-born population - Austria (%)
Place of birth for the foreign-born population - Belgium (%)
Place of birth for the foreign-born population - France (%)
Place of birth for the foreign-born population - Germany (%)
Place of birth for the foreign-born population - Netherlands (%)
Place of birth for the foreign-born population - Switzerland (%)
Place of birth for the foreign-born population - Other Western Europe (%)
Place of birth for the foreign-born population - Greece (%)
Place of birth for the foreign-born population - Italy (%)
Place of birth for the foreign-born population - Portugal (%)
Place of birth for the foreign-born population - Spain (%)
Place of birth for the foreign-born population - Other Southern Europe (%)
Place of birth for the foreign-born population - Albania (%)
Place of birth for the foreign-born population - Belarus (%)
Place of birth for the foreign-born population - Bosnia and Herzegovina (%)
Place of birth for the foreign-born population - Bulgaria (%)
Place of birth for the foreign-born population - Croatia (%)
Place of birth for the foreign-born population - Czechoslovakia (%)
Place of birth for the foreign-born population - Hungary (%)
Place of birth for the foreign-born population - Latvia (%)
Place of birth for the foreign-born population - Lithuania (%)
Place of birth for the foreign-born population - North Macedonia (Macedonia) (%)
Place of birth for the foreign-born population - Moldova (%)
Place of birth for the foreign-born population - Poland (%)
Place of birth for the foreign-born population - Romania (%)
Place of birth for the foreign-born population - Russia (%)
Place of birth for the foreign-born population - Serbia (%)
Place of birth for the foreign-born population - Ukraine (%)
Place of birth for the foreign-born population - Other Eastern Europe (%)
Place of birth for the foreign-born population - China (%)
Place of birth for the foreign-born population - Hong Kong (%)
Place of birth for the foreign-born population - Taiwan (%)
Place of birth for the foreign-born population - Japan (%)
Place of birth for the foreign-born population - Korea (%)
Place of birth for the foreign-born population - Other Eastern Asia (%)
Place of birth for the foreign-born population - Afghanistan (%)
Place of birth for the foreign-born population - Bangladesh (%)
Place of birth for the foreign-born population - India (%)
Place of birth for the foreign-born population - Iran (%)
Place of birth for the foreign-born population - Kazakhstan (%)
Place of birth for the foreign-born population - Nepal (%)
Place of birth for the foreign-born population - Pakistan (%)
Place of birth for the foreign-born population - Sri Lanka (%)
Place of birth for the foreign-born population - Uzbekistan (%)
Place of birth for the foreign-born population - Other South Central Asia (%)
Place of birth for the foreign-born population - Burma (%)
Place of birth for the foreign-born population - Cambodia (%)
Place of birth for the foreign-born population - Indonesia (%)
Place of birth for the foreign-born population - Laos (%)
Place of birth for the foreign-born population - Malaysia (%)
Place of birth for the foreign-born population - Philippines (%)
Place of birth for the foreign-born population - Singapore (%)
Place of birth for the foreign-born population - Thailand (%)
Place of birth for the foreign-born population - Vietnam (%)
Place of birth for the foreign-born population - Other South Eastern Asia (%)
Place of birth for the foreign-born population - Armenia (%)
Place of birth for the foreign-born population - Iraq (%)
Place of birth for the foreign-born population - Israel (%)
Place of birth for the foreign-born population - Jordan (%)
Place of birth for the foreign-born population - Kuwait (%)
Place of birth for the foreign-born population - Lebanon (%)
Place of birth for the foreign-born population - Saudi Arabia (%)
Place of birth for the foreign-born population - Syria (%)
Place of birth for the foreign-born population - Turkey (%)
Place of birth for the foreign-born population - Yemen (%)
Place of birth for the foreign-born population - Other Western Asia (%)
Place of birth for the foreign-born population - Eritrea (%)
Place of birth for the foreign-born population - Ethiopia (%)
Place of birth for the foreign-born population - Kenya (%)
Place of birth for the foreign-born population - Somalia (%)
Place of birth for the foreign-born population - Uganda (%)
Place of birth for the foreign-born population - Zimbabwe (%)
Place of birth for the foreign-born population - Other Eastern Africa (%)
Place of birth for the foreign-born population - Cameroon (%)
Place of birth for the foreign-born population - Congo (%)
Place of birth for the foreign-born population - Democratic Republic of Congo (Zaire) (%)
Place of birth for the foreign-born population - Other Middle Africa (%)
Place of birth for the foreign-born population - Egypt (%)
Place of birth for the foreign-born population - Morocco (%)
Place of birth for the foreign-born population - Sudan (%)
Place of birth for the foreign-born population - Other Northern Africa (%)
Place of birth for the foreign-born population - South Africa (%)
Place of birth for the foreign-born population - Other Southern Africa (%)
Place of birth for the foreign-born population - Cabo Verde (%)
Place of birth for the foreign-born population - Ghana (%)
Place of birth for the foreign-born population - Liberia (%)
Place of birth for the foreign-born population - Nigeria (%)
Place of birth for the foreign-born population - Senegal (%)
Place of birth for the foreign-born population - Sierra Leone (%)
Place of birth for the foreign-born population - Other Western Africa (%)
Place of birth for the foreign-born population - Australia (%)
Place of birth for the foreign-born population - New Zealand (%)
Place of birth for the foreign-born population - Fiji (%)
Place of birth for the foreign-born population - Micronesia (%)
Place of birth for the foreign-born population - Bahamas (%)
Place of birth for the foreign-born population - Barbados (%)
Place of birth for the foreign-born population - Cuba (%)
Place of birth for the foreign-born population - Dominica (%)
Place of birth for the foreign-born population - Dominican Republic (%)
Place of birth for the foreign-born population - Grenada (%)
Place of birth for the foreign-born population - Haiti (%)
Place of birth for the foreign-born population - Jamaica (%)
Place of birth for the foreign-born population - St. Vincent and the Grenadines (%)
Place of birth for the foreign-born population - Trinidad and Tobago (%)
Place of birth for the foreign-born population - West Indies (%)
Place of birth for the foreign-born population - Other Caribbean (%)
Place of birth for the foreign-born population - Belize (%)
Place of birth for the foreign-born population - Costa Rica (%)
Place of birth for the foreign-born population - El Salvador (%)
Place of birth for the foreign-born population - Guatemala (%)
Place of birth for the foreign-born population - Honduras (%)
Place of birth for the foreign-born population - Mexico (%)
Place of birth for the foreign-born population - Nicaragua (%)
Place of birth for the foreign-born population - Panama (%)
Place of birth for the foreign-born population - Other Central America (%)
Place of birth for the foreign-born population - Argentina (%)
Place of birth for the foreign-born population - Bolivia (%)
Place of birth for the foreign-born population - Brazil (%)
Place of birth for the foreign-born population - Chile (%)
Place of birth for the foreign-born population - Colombia (%)
Place of birth for the foreign-born population - Ecuador (%)
Place of birth for the foreign-born population - Guyana (%)
Place of birth for the foreign-born population - Peru (%)
Place of birth for the foreign-born population - Uruguay (%)
Place of birth for the foreign-born population - Venezuela (%)
Place of birth for the foreign-born population - Other South America (%)
Place of birth for the foreign-born population - Canada (%)
Place of birth for the foreign-born population - Other Northern America (%)
Place of birth for the foreign-born population - Other (%)
Latest news about races in California, MD collected exclusively by city-data.com from local newspapers, TV, and radio stations
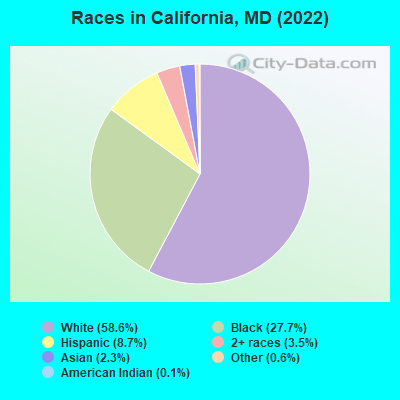
According to 2022 data, the most numerous races in California, MD are White alone (8,059 residents), Black alone (3,818 residents), and Hispanic (1,202 residents). 90.8% of California residents speak English at home. 7.2% of California, MD residents are foreign-born (3.2% born in Latin America, 1.9% born in Asia, 1.0% born in Africa), which is 123.8% less than the foreign-born rate of 16.0% across the entire state of Maryland.
Race distribution in California
2000 2022
3,286,547 62.1% White alone 1,464,735 27.7% Black alone 227,916 4.3% Hispanic 209,738 4.0% Asian alone 82,946 1.6% Two or more races 13,312 0.3% American Indian alone 9,379 0.2% Other race alone 1,913 0.04% Native Hawaiian and Other
2,906,492 47.1% White alone 1,800,914 29.2% Black alone 705,842 11.4% Hispanic 401,818 6.5% Asian alone 291,317 4.7% Two or more races 46,930 0.8% Other race alone 8,930 0.1% American Indian alone 2,417 0.04% Native Hawaiian and Other
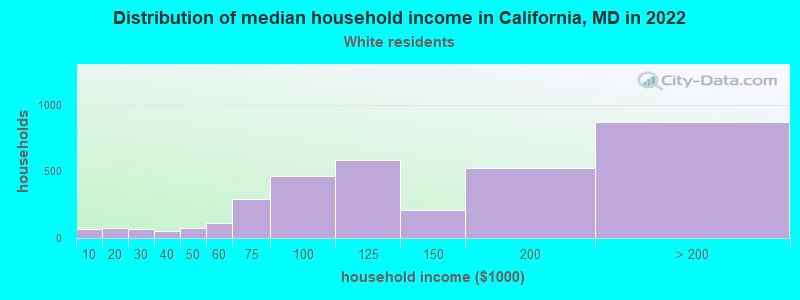
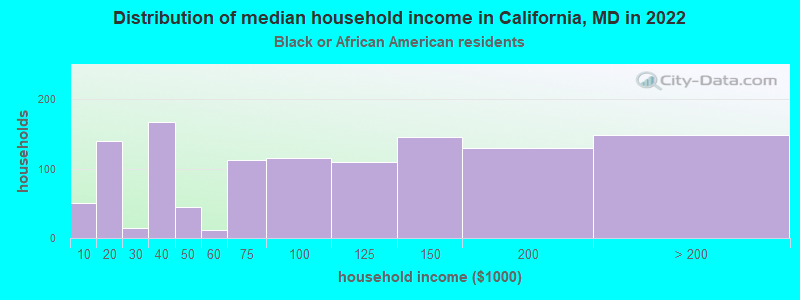
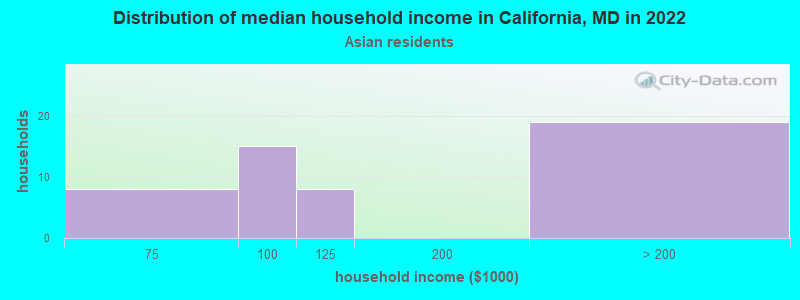
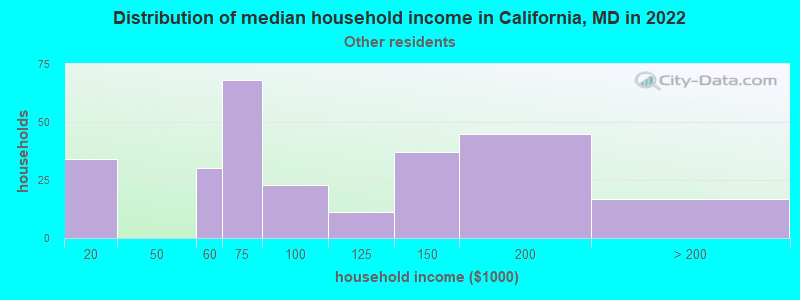
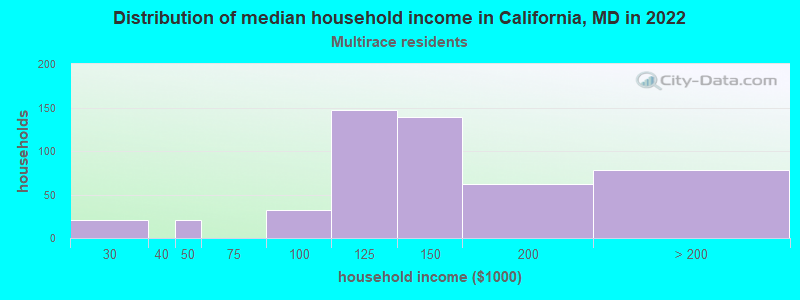
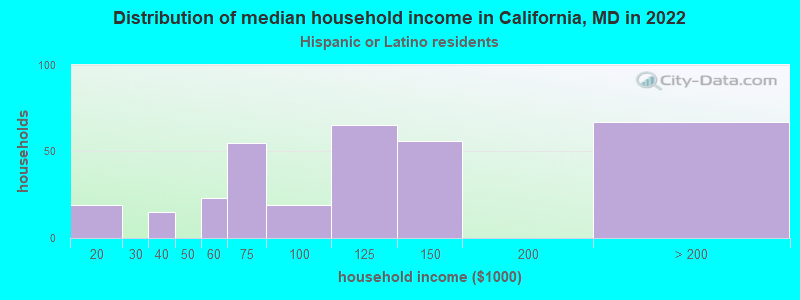
Income and house value in California Median household income in 2022 $118,074 White non-Hispanic householders$106,144 Black householders$112,534 Two or more races householders$89,777 Hispanic or Latino race householdersMedian 2022 house value $349,388 White Non-Hispanic householders$280,224 Black or African American householders$202,027 American Indian or Alaska Native householders $326,809 Asian householders$93,170 Two or more races householders$301,139 Hispanic or Latino householders
Median age by race in California
39.6 Median age for White residents37.5 42.9 31.6 Median age for Black or African American residents37.6 28.1 -647,863,247.2 Median age for American Indian / Alaska Native residents-642,487,046.0 -676,818,950.3 40.7 Median age for Asian residents50.8 37.0 -666,666,666.0 Median age for Native Hawaiian / Pacific Islander residents-666,666,666.0 -666,666,666.0 40.2 Median age for Other race residents29.7 45.0 32.0 Median age for Two or more races residents32.9 30.7 39.8 Median age for White alone residents37.6 43.1 35.8 Median age for Hispanic or Latino residents16.3 40.9
Owner/renter occupied households by race in California
House owners and renters - White residents 2,501 73.4% Owner occupied908 26.6% Renter occupiedHouse owners and renters - Black or African American residents 561 39.6% Owner occupied855 60.4% Renter occupiedHouse owners and renters - American Indian / Alaska Native residents 6 100.0% Renter occupiedHouse owners and renters - Asian residents 37 56.3% Owner occupied28 43.7% Renter occupiedHouse owners and renters - Other race residents 144 35.9% Owner occupied258 64.1% Renter occupiedHouse owners and renters - Two or more races residents 371 87.5% Owner occupied53 12.5% Renter occupiedHouse owners and renters - White alone residents 2,488 73.3% Owner occupied906 26.7% Renter occupiedHouse owners and renters - Hispanic or Latino residents 209 47.6% Owner occupied230 52.4% Renter occupied
Language usage in California
English speakers - Total 90.8% of residents of California speak English at home.
4.7% of residents speak Spanish at home 392 63.2% Speak English very well228 36.8% Speak English less than very well3.8% of residents speak other language at home 340 68.7% Speak English very well155 31.3% Speak English less than very well
English speakers - Born in the United States 96.2% of residents of California speak English at home.
0.7% of residents speak Spanish at home 42 87.5% Speak English very well6 12.5% Speak English less than very well1.1% of residents speak other language at home 23 30.3% Speak English very well53 69.7% Speak English less than very well
English speakers - Native, born elsewhere 87.9% of residents of California speak English at home.
11.8% of residents speak Spanish at home 67 100.0% Speak English very well
English speakers - Foreign-born 18.9% of residents of California speak English at home.
45.8% of residents speak Spanish at home 199 70.8% Speak English very well82 29.2% Speak English less than very well52.9% of residents speak other language at home 252 77.8% Speak English very well72 22.2% Speak English less than very well
White (Caucasian) - Speak only English Native:
96.4% (7,480)Foreign-born:
26.9% (40)
White (Caucasian) - Speak another language Native:
3.0% (229)Foreign-born:
57.7% (85)
Black or African American - Speak only English Native:
97.4% (2,987)Foreign-born:
49.2% (63)
Black or African American - Speak another language Native:
2.5% (78)Foreign-born:
50.0% (64)
American Indian / Alaska Native - Speak only English Native:
80.3% (12)Foreign-born:
42.1% (4)
Asian - Speak only English Native:
97.1% (69)Foreign-born:
9.0% (23)
Other race - Speak only English Native:
89.6% (425)Foreign-born:
8.0% (31)
Other race - Speak another language Native:
20.1% (95)Foreign-born:
91.6% (353)
Two or more races - Speak another language Native:
4.6% (36)Foreign-born:
100.0% (55)
White alone - Speak only English Native:
96.3% (7,472)Foreign-born:
69.7% (44)
White alone - Speak another language Native:
2.7% (208)Foreign-born:
80.5% (51)
Hispanic or Latino - Speak only English Native:
70.8% (505)Foreign-born:
7.2% (20)
Hispanic or Latino - Speak another language Native:
27.1% (193)Foreign-born:
92.4% (252)
Foreign-born residents in California 984 residents are foreign born (3.2% Latin America , 1.9% Asia , 1.0% Africa ).
This city:
7.2%Maryland:
15.7%
Marital status for residents in California Marital status - White (Caucasian) population 15 years and over
Males 36.4% Never married54.0% Now married0.0% Separated2.3% Widowed7.4% DivorcedFemales 21.8% Never married56.7% Now married2.1% Separated9.1% Widowed10.4% DivorcedWomen who gave birth in the past 12 months Now married:
72.0% (18)Unmarried:
28.0% (7)
Women who did not give birth in the past 12 months Now married:
57.9% (1,006)Unmarried:
42.1% (732)
Marital status - Black or African American population 15 years and over
Males 49.9% Never married33.5% Now married2.1% Separated8.2% Widowed6.3% DivorcedFemales 59.1% Never married28.6% Now married0.2% Separated0.7% Widowed11.4% DivorcedWomen who gave birth in the past 12 months Now married:
100.0% (23)Unmarried:
0.0% (0)
Women who did not give birth in the past 12 months Now married:
24.9% (256)Unmarried:
75.1% (773)
Marital status - Asian population 15 years and over
Males 15.5% Never married84.5% Now married0.0% Separated0.0% Widowed0.0% DivorcedFemales 5.6% Never married75.3% Now married11.6% Separated7.4% Widowed0.0% DivorcedWomen who gave birth in the past 12 months Now married:
100.0% (21)Unmarried:
0.0% (0)
Women who did not give birth in the past 12 months Now married:
88.9% (96)Unmarried:
11.1% (12)
Marital status - Other race population 15 years and over
Males 48.7% Never married43.1% Now married0.0% Separated0.0% Widowed8.2% DivorcedFemales 7.6% Never married78.4% Now married0.0% Separated0.0% Widowed14.0% DivorcedWomen who did not give birth in the past 12 months Now married:
91.2% (168)Unmarried:
8.8% (16)
Marital status - Two or more races population 15 years and over
Males 15.5% Never married59.0% Now married25.4% Separated0.0% Widowed0.0% DivorcedFemales 7.9% Never married60.3% Now married0.0% Separated0.0% Widowed31.7% DivorcedWomen who did not give birth in the past 12 months Now married:
62.2% (68)Unmarried:
37.8% (41)
Marital status - White alone, not Hispanic / Latino population 15 years and over
Males 36.8% Never married53.4% Now married0.0% Separated2.3% Widowed7.5% DivorcedFemales 21.5% Never married56.4% Now married2.2% Separated9.3% Widowed10.7% DivorcedWomen who gave birth in the past 12 months Now married:
72.0% (18)Unmarried:
28.0% (7)
Women who did not give birth in the past 12 months Now married:
57.4% (962)Unmarried:
42.6% (715)
Marital status - Hispanic or Latino population 15 years and over
Males 37.7% Never married55.3% Now married0.0% Separated0.0% Widowed6.9% DivorcedFemales 15.4% Never married67.0% Now married0.0% Separated2.8% Widowed14.8% DivorcedWomen who gave birth in the past 12 months Now married:
100.0% (28)Unmarried:
0.0% (0)
Women who did not give birth in the past 12 months Now married:
79.5% (274)Unmarried:
20.5% (71)
Ancestries in California
833 13.6% Irish545 8.9% American444 7.2% English380 6.2% German152 2.5% Polish129 2.1% African107 1.7% Italian87 1.4% European76 1.2% Nigerian58 0.9% Greek46 0.8% French46 0.8% Norwegian41 0.7% French Canadian40 0.7% Russian40 0.7% Scottish38 0.6% British38 0.6% Eastern European34 0.6% Czechoslovakian24 0.4% Scotch-Irish19 0.3% Portuguese19 0.3% Scandinavian19 0.3% Ukrainian10 0.2% Slovak7 0.1% Armenian7 0.1% Dutch
Children Nativity (place of birth) in California
Children under 6 years - Living with two parents Both parents native 630 100.0% NativeBoth parents foreign-born 35 100.0% NativeOne native, one foreign-born parent 9 100.0% NativeChildren under 6 years - Living with one parent Native parent 208 100.0% NativeChildren 6 to 17 years - Living with two parents Both parents native 1,183 100.0% NativeBoth parents foreign-born 107 59.4% Native73 40.6% Foreign-bornOne native, one foreign-born parent 117 87.1% Native17 12.9% Foreign-bornChildren 6 to 17 years - Living with one parent Native parent 745 100.0% Native
Grandparents responsible for own grandchildren in California
Grandparents (30 to 59 years) White / Caucasian 5 50.0% Responsible for grandchildren5 50.0% Not responsible for grandchildrenAsian 21 100.0% Not responsible for grandchildrenWhite alone, not Hispanic / Latino 5 48.5% Responsible for grandchildren6 51.5% Not responsible for grandchildrenGrandparents (60 years and over) White / Caucasian 36 32.1% Responsible for grandchildren77 67.9% Not responsible for grandchildrenAsian 46 100.0% Not responsible for grandchildrenWhite alone, not Hispanic / Latino 36 30.6% Responsible for grandchildren82 69.4% Not responsible for grandchildren