Races in Calhoun, Georgia (GA) Detailed Stats
Data:
Races - White alone (%)
Races - White alone (% change since 2000)
Races - Black alone (%)
Races - Black alone (% change since 2000)
Races - American Indian alone (%)
Races - American Indian alone (% change since 2000)
Races - Asian alone (%)
Races - Asian alone (% change since 2000)
Races - Hispanic (%)
Races - Hispanic (% change since 2000)
Races - Native Hawaiian and Other Pacific Islander alone (%)
Races - Native Hawaiian and Other Pacific Islander alone (% change since 2000)
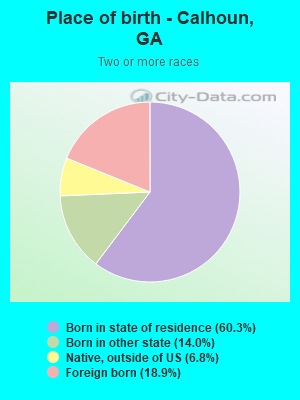
Races - Two or more races(%)
Races - Two or more races(% change since 2000)
Races - Other race alone (%)
Races - Other race alone (% change since 2000)
Racial diversity
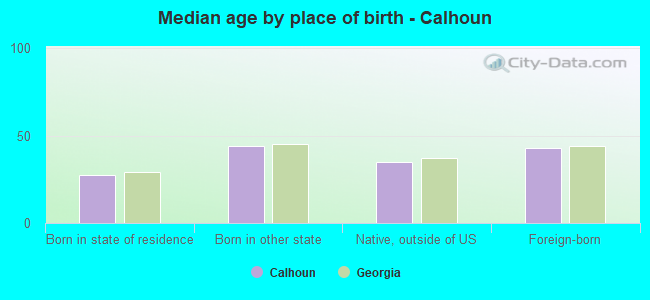
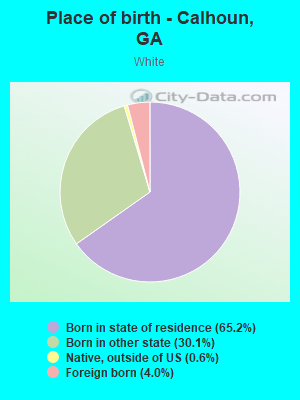
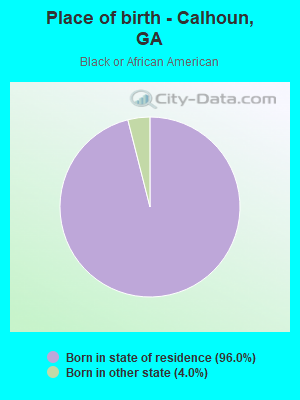
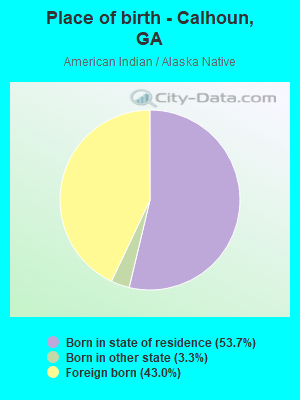
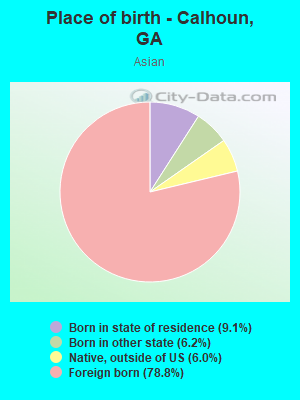
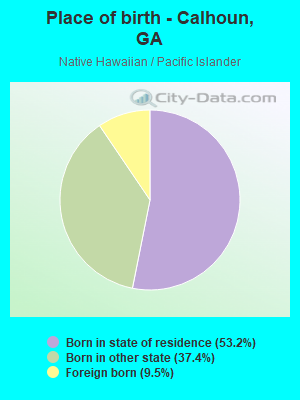
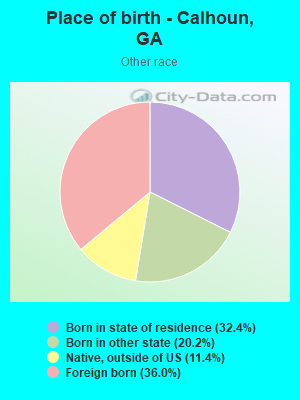
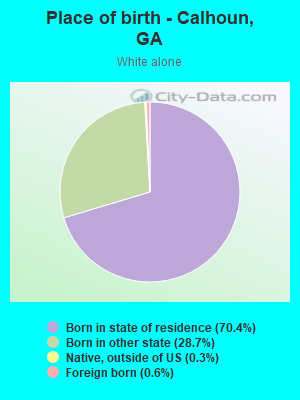
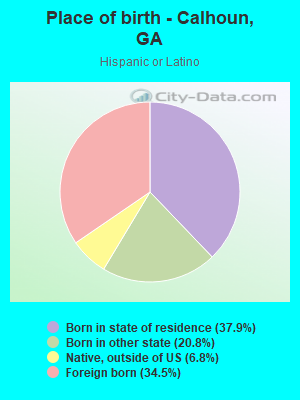
Place of birth - Born in state of residence (%)
Place of birth - Born in state of residence (%) - White
Place of birth - Born in state of residence (%) - Black or African American
Place of birth - Born in state of residence (%) - Asian
Place of birth - Born in state of residence (%) - Hispanic or Latino
Place of birth - Born in state of residence (%) - American Indian and Alaska Native
Place of birth - Born in state of residence (%) - Multirace
Place of birth - Born in state of residence (%) - Other Race
Place of birth - Born in other state (%)
Place of birth - Born in other state (%) - White
Place of birth - Born in other state (%) - Black or African American
Place of birth - Born in other state (%) - Asian
Place of birth - Born in other state (%) - Hispanic or Latino
Place of birth - Born in other state (%) - American Indian and Alaska Native
Place of birth - Born in other state (%) - Multirace
Place of birth - Born in other state (%) - Other Race
Place of birth - Native, outside of US (%)
Place of birth - Native, outside of US (%) - White
Place of birth - Native, outside of US (%) - Black or African American
Place of birth - Native, outside of US (%) - Asian
Place of birth - Native, outside of US (%) - Hispanic or Latino
Place of birth - Native, outside of US (%) - American Indian and Alaska Native
Place of birth - Native, outside of US (%) - Multirace
Place of birth - Native, outside of US (%) - Other Race
Place of birth - Foreign born (%)
Place of birth - Foreign born (%) - White
Place of birth - Foreign born (%) - Black or African American
Place of birth - Foreign born (%) - Asian
Place of birth - Foreign born (%) - Hispanic or Latino
Place of birth - Foreign born (%) - American Indian and Alaska Native
Place of birth - Foreign born (%) - Multirace
Place of birth - Foreign born (%) - Other Race
Residents speaking English at home (%)
Residents speaking English at home - Born in the United States (%)
Residents speaking English at home - Native, born elsewhere (%)
Residents speaking English at home - Foreign born (%)
Residents speaking Spanish at home (%)
Residents speaking Spanish at home - Born in the United States (%)
Residents speaking Spanish at home - Native, born elsewhere (%)
Residents speaking Spanish at home - Foreign born (%)
Residents speaking other language at home (%)
Residents speaking other language at home - Born in the United States (%)
Residents speaking other language at home - Native, born elsewhere (%)
Residents speaking other language at home - Foreign born (%)
Marital status - Never married (%)
Marital status - Now married (%)
Marital status - Separated (%)
Marital status - Widowed (%)
Marital status - Divorced (%)
Ancestries Reported - Arab (%)
Ancestries Reported - Czech (%)
Ancestries Reported - Danish (%)
Ancestries Reported - Dutch (%)
Ancestries Reported - English (%)
Ancestries Reported - French (%)
Ancestries Reported - French Canadian (%)
Ancestries Reported - German (%)
Ancestries Reported - Greek (%)
Ancestries Reported - Hungarian (%)
Ancestries Reported - Irish (%)
Ancestries Reported - Italian (%)
Ancestries Reported - Lithuanian (%)
Ancestries Reported - Norwegian (%)
Ancestries Reported - Polish (%)
Ancestries Reported - Portuguese (%)
Ancestries Reported - Russian (%)
Ancestries Reported - Scotch-Irish (%)
Ancestries Reported - Scottish (%)
Ancestries Reported - Slovak (%)
Ancestries Reported - Subsaharan African (%)
Ancestries Reported - Swedish (%)
Ancestries Reported - Swiss (%)
Ancestries Reported - Ukrainian (%)
Ancestries Reported - United States (%)
Ancestries Reported - Welsh (%)
Ancestries Reported - West Indian (%)
Ancestries Reported - Other (%)
Geographical mobility - Same house 1 year ago (%)
Geographical mobility - Same house 1 year ago (%) - White
Geographical mobility - Same house 1 year ago (%) - Black or African American
Geographical mobility - Same house 1 year ago (%) - Asian
Geographical mobility - Same house 1 year ago (%) - Hispanic or Latino
Geographical mobility - Same house 1 year ago (%) - American Indian and Alaska Native
Geographical mobility - Same house 1 year ago (%) - Multirace
Geographical mobility - Same house 1 year ago (%) - Other Race
Geographical mobility - Moved within same county (%)
Geographical mobility - Moved within same county (%) - White
Geographical mobility - Moved within same county (%) - Black or African American
Geographical mobility - Moved within same county (%) - Asian
Geographical mobility - Moved within same county (%) - Hispanic or Latino
Geographical mobility - Moved within same county (%) - American Indian and Alaska Native
Geographical mobility - Moved within same county (%) - Multirace
Geographical mobility - Moved within same county (%) - Other Race
Geographical mobility - Moved from different county within same state (%)
Geographical mobility - Moved from different county within same state (%) - White
Geographical mobility - Moved from different county within same state (%) - Black or African American
Geographical mobility - Moved from different county within same state (%) - Asian
Geographical mobility - Moved from different county within same state (%) - Hispanic or Latino
Geographical mobility - Moved from different county within same state (%) - American Indian and Alaska Native
Geographical mobility - Moved from different county within same state (%) - Multirace
Geographical mobility - Moved from different county within same state (%) - Other Race
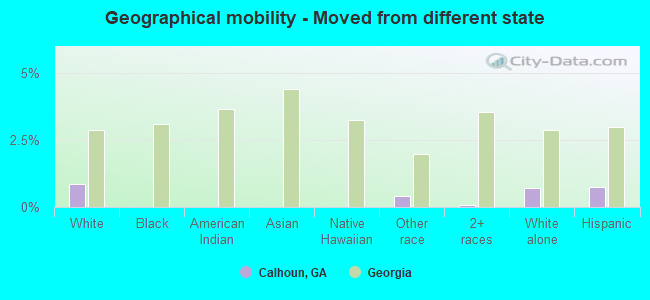
Geographical mobility - Moved from different state (%)
Geographical mobility - Moved from different state (%) - White
Geographical mobility - Moved from different state (%) - Black or African American
Geographical mobility - Moved from different state (%) - Asian
Geographical mobility - Moved from different state (%) - Hispanic or Latino
Geographical mobility - Moved from different state (%) - American Indian and Alaska Native
Geographical mobility - Moved from different state (%) - Multirace
Geographical mobility - Moved from different state (%) - Other Race
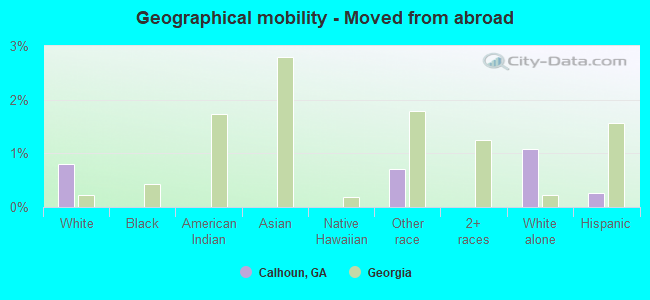
Geographical mobility - Moved from abroad (%)
Geographical mobility - Moved from abroad (%) - White
Geographical mobility - Moved from abroad (%) - Black or African American
Geographical mobility - Moved from abroad (%) - Asian
Geographical mobility - Moved from abroad (%) - Hispanic or Latino
Geographical mobility - Moved from abroad (%) - American Indian and Alaska Native
Geographical mobility - Moved from abroad (%) - Multirace
Geographical mobility - Moved from abroad (%) - Other Race
Place of birth for the foreign-born population - Ireland (%)
Place of birth for the foreign-born population - Denmark (%)
Place of birth for the foreign-born population - Norway (%)
Place of birth for the foreign-born population - Sweden (%)
Place of birth for the foreign-born population - United Kingdom (%)
Place of birth for the foreign-born population - England (%)
Place of birth for the foreign-born population - Scotland (%)
Place of birth for the foreign-born population - Other Northern Europe (%)
Place of birth for the foreign-born population - Austria (%)
Place of birth for the foreign-born population - Belgium (%)
Place of birth for the foreign-born population - France (%)
Place of birth for the foreign-born population - Germany (%)
Place of birth for the foreign-born population - Netherlands (%)
Place of birth for the foreign-born population - Switzerland (%)
Place of birth for the foreign-born population - Other Western Europe (%)
Place of birth for the foreign-born population - Greece (%)
Place of birth for the foreign-born population - Italy (%)
Place of birth for the foreign-born population - Portugal (%)
Place of birth for the foreign-born population - Spain (%)
Place of birth for the foreign-born population - Other Southern Europe (%)
Place of birth for the foreign-born population - Albania (%)
Place of birth for the foreign-born population - Belarus (%)
Place of birth for the foreign-born population - Bosnia and Herzegovina (%)
Place of birth for the foreign-born population - Bulgaria (%)
Place of birth for the foreign-born population - Croatia (%)
Place of birth for the foreign-born population - Czechoslovakia (%)
Place of birth for the foreign-born population - Hungary (%)
Place of birth for the foreign-born population - Latvia (%)
Place of birth for the foreign-born population - Lithuania (%)
Place of birth for the foreign-born population - North Macedonia (Macedonia) (%)
Place of birth for the foreign-born population - Moldova (%)
Place of birth for the foreign-born population - Poland (%)
Place of birth for the foreign-born population - Romania (%)
Place of birth for the foreign-born population - Russia (%)
Place of birth for the foreign-born population - Serbia (%)
Place of birth for the foreign-born population - Ukraine (%)
Place of birth for the foreign-born population - Other Eastern Europe (%)
Place of birth for the foreign-born population - China (%)
Place of birth for the foreign-born population - Hong Kong (%)
Place of birth for the foreign-born population - Taiwan (%)
Place of birth for the foreign-born population - Japan (%)
Place of birth for the foreign-born population - Korea (%)
Place of birth for the foreign-born population - Other Eastern Asia (%)
Place of birth for the foreign-born population - Afghanistan (%)
Place of birth for the foreign-born population - Bangladesh (%)
Place of birth for the foreign-born population - India (%)
Place of birth for the foreign-born population - Iran (%)
Place of birth for the foreign-born population - Kazakhstan (%)
Place of birth for the foreign-born population - Nepal (%)
Place of birth for the foreign-born population - Pakistan (%)
Place of birth for the foreign-born population - Sri Lanka (%)
Place of birth for the foreign-born population - Uzbekistan (%)
Place of birth for the foreign-born population - Other South Central Asia (%)
Place of birth for the foreign-born population - Burma (%)
Place of birth for the foreign-born population - Cambodia (%)
Place of birth for the foreign-born population - Indonesia (%)
Place of birth for the foreign-born population - Laos (%)
Place of birth for the foreign-born population - Malaysia (%)
Place of birth for the foreign-born population - Philippines (%)
Place of birth for the foreign-born population - Singapore (%)
Place of birth for the foreign-born population - Thailand (%)
Place of birth for the foreign-born population - Vietnam (%)
Place of birth for the foreign-born population - Other South Eastern Asia (%)
Place of birth for the foreign-born population - Armenia (%)
Place of birth for the foreign-born population - Iraq (%)
Place of birth for the foreign-born population - Israel (%)
Place of birth for the foreign-born population - Jordan (%)
Place of birth for the foreign-born population - Kuwait (%)
Place of birth for the foreign-born population - Lebanon (%)
Place of birth for the foreign-born population - Saudi Arabia (%)
Place of birth for the foreign-born population - Syria (%)
Place of birth for the foreign-born population - Turkey (%)
Place of birth for the foreign-born population - Yemen (%)
Place of birth for the foreign-born population - Other Western Asia (%)
Place of birth for the foreign-born population - Eritrea (%)
Place of birth for the foreign-born population - Ethiopia (%)
Place of birth for the foreign-born population - Kenya (%)
Place of birth for the foreign-born population - Somalia (%)
Place of birth for the foreign-born population - Uganda (%)
Place of birth for the foreign-born population - Zimbabwe (%)
Place of birth for the foreign-born population - Other Eastern Africa (%)
Place of birth for the foreign-born population - Cameroon (%)
Place of birth for the foreign-born population - Congo (%)
Place of birth for the foreign-born population - Democratic Republic of Congo (Zaire) (%)
Place of birth for the foreign-born population - Other Middle Africa (%)
Place of birth for the foreign-born population - Egypt (%)
Place of birth for the foreign-born population - Morocco (%)
Place of birth for the foreign-born population - Sudan (%)
Place of birth for the foreign-born population - Other Northern Africa (%)
Place of birth for the foreign-born population - South Africa (%)
Place of birth for the foreign-born population - Other Southern Africa (%)
Place of birth for the foreign-born population - Cabo Verde (%)
Place of birth for the foreign-born population - Ghana (%)
Place of birth for the foreign-born population - Liberia (%)
Place of birth for the foreign-born population - Nigeria (%)
Place of birth for the foreign-born population - Senegal (%)
Place of birth for the foreign-born population - Sierra Leone (%)
Place of birth for the foreign-born population - Other Western Africa (%)
Place of birth for the foreign-born population - Australia (%)
Place of birth for the foreign-born population - New Zealand (%)
Place of birth for the foreign-born population - Fiji (%)
Place of birth for the foreign-born population - Micronesia (%)
Place of birth for the foreign-born population - Bahamas (%)
Place of birth for the foreign-born population - Barbados (%)
Place of birth for the foreign-born population - Cuba (%)
Place of birth for the foreign-born population - Dominica (%)
Place of birth for the foreign-born population - Dominican Republic (%)
Place of birth for the foreign-born population - Grenada (%)
Place of birth for the foreign-born population - Haiti (%)
Place of birth for the foreign-born population - Jamaica (%)
Place of birth for the foreign-born population - St. Vincent and the Grenadines (%)
Place of birth for the foreign-born population - Trinidad and Tobago (%)
Place of birth for the foreign-born population - West Indies (%)
Place of birth for the foreign-born population - Other Caribbean (%)
Place of birth for the foreign-born population - Belize (%)
Place of birth for the foreign-born population - Costa Rica (%)
Place of birth for the foreign-born population - El Salvador (%)
Place of birth for the foreign-born population - Guatemala (%)
Place of birth for the foreign-born population - Honduras (%)
Place of birth for the foreign-born population - Mexico (%)
Place of birth for the foreign-born population - Nicaragua (%)
Place of birth for the foreign-born population - Panama (%)
Place of birth for the foreign-born population - Other Central America (%)
Place of birth for the foreign-born population - Argentina (%)
Place of birth for the foreign-born population - Bolivia (%)
Place of birth for the foreign-born population - Brazil (%)
Place of birth for the foreign-born population - Chile (%)
Place of birth for the foreign-born population - Colombia (%)
Place of birth for the foreign-born population - Ecuador (%)
Place of birth for the foreign-born population - Guyana (%)
Place of birth for the foreign-born population - Peru (%)
Place of birth for the foreign-born population - Uruguay (%)
Place of birth for the foreign-born population - Venezuela (%)
Place of birth for the foreign-born population - Other South America (%)
Place of birth for the foreign-born population - Canada (%)
Place of birth for the foreign-born population - Other Northern America (%)
Place of birth for the foreign-born population - Other (%)
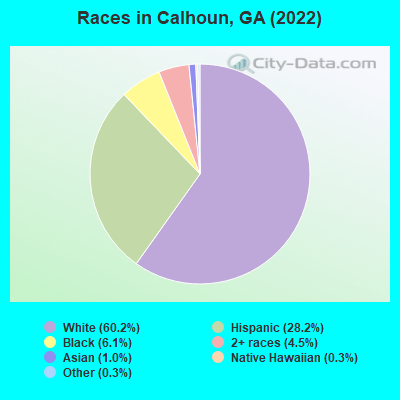
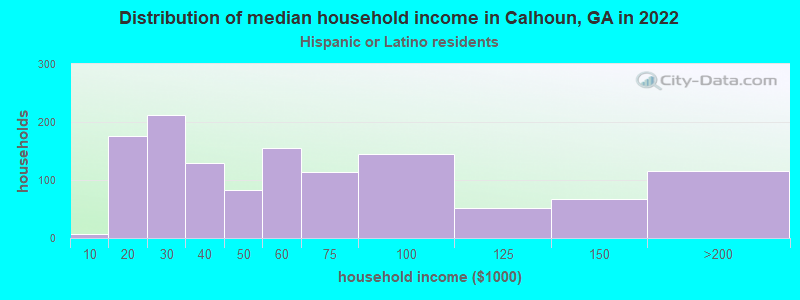
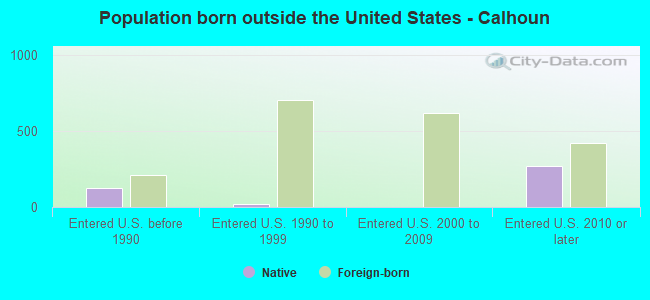
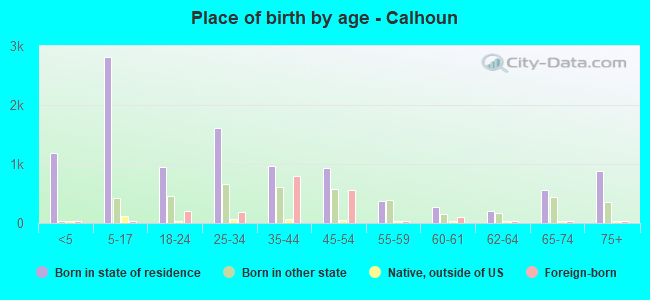
According to 2022 data, the most numerous races in Calhoun, GA are White alone (10,529 residents), Black alone (1,060 residents), and Hispanic (4,926 residents). 75.2% of Calhoun residents speak English at home. 11.4% of Calhoun, GA residents are foreign-born (9.7% born in Latin America), which is 12.4% greater than the foreign-born rate of 10.0% across the entire state of Georgia.
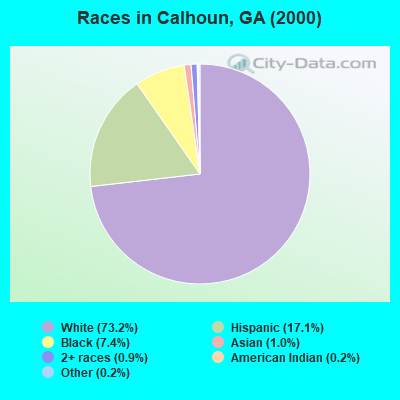
Race distribution in Calhoun
2000 2022
5,128,661 62.6% White alone 2,331,465 28.5% Black alone 435,227 5.3% Hispanic 171,513 2.1% Asian alone 87,364 1.1% Two or more races 17,670 0.2% American Indian alone 11,275 0.1% Other race alone 3,278 0.04% Native Hawaiian and Other
5,415,657 49.6% White alone 3,349,240 30.7% Black alone 1,132,604 10.4% Hispanic 479,156 4.4% Asian alone 462,923 4.2% Two or more races 54,416 0.5% Other race alone 11,923 0.1% American Indian alone 6,957 0.06% Native Hawaiian and Other
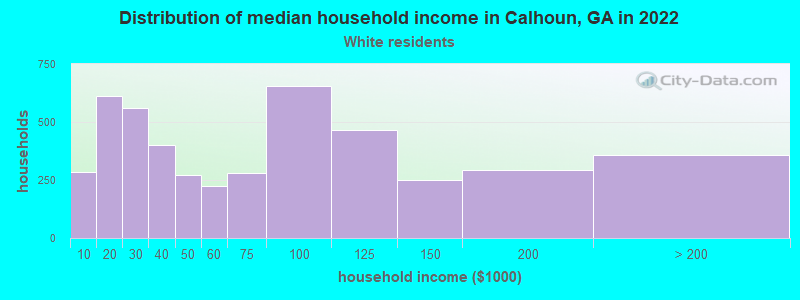
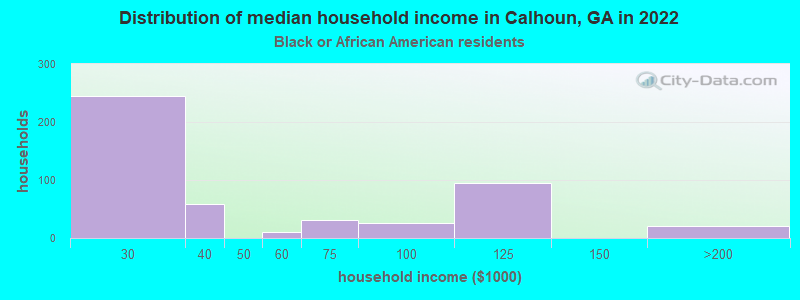
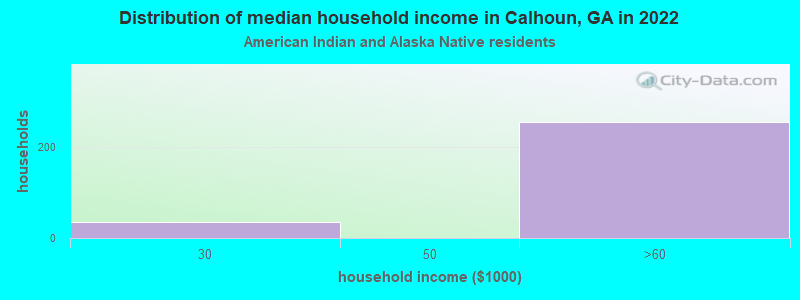
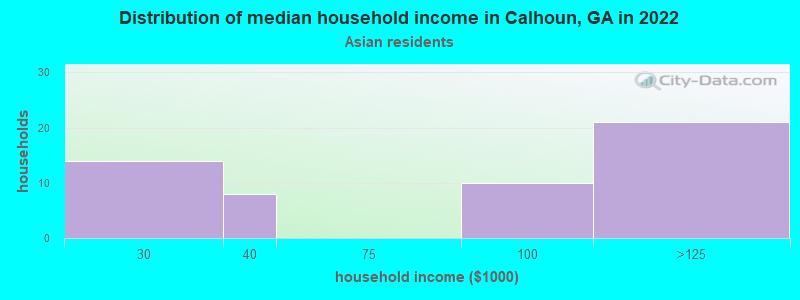
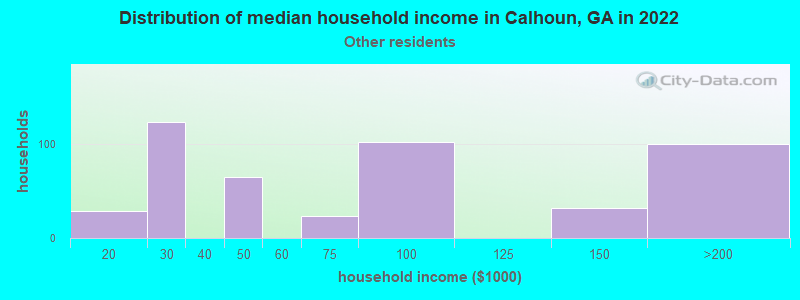
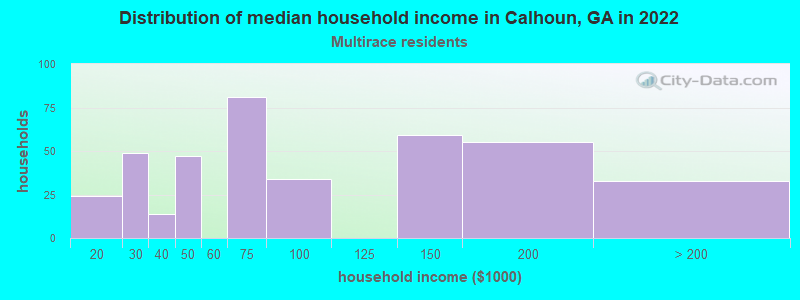
Income and house value in Calhoun Median household income in 2022 $61,539 White non-Hispanic householders$31,044 Black householders$74,740 Some other race householders$66,987 Two or more races householders$52,021 Hispanic or Latino race householdersMedian 2022 house value $274,302 White Non-Hispanic householders$215,504 Black or African American householders$376,038 American Indian or Alaska Native householders $324,897 Asian householders$130,451 Some other race householders$36,099 Two or more races householders$134,279 Hispanic or Latino householders
Median age by race in Calhoun
40.3 Median age for White residents39.8 41.9 34.2 Median age for Black or African American residents32.2 45.2 6.3 Median age for American Indian / Alaska Native residents6.4 2.7 26.6 Median age for Asian residents23.2 37.6 30.7 Median age for Native Hawaiian / Pacific Islander residents32.3 -776,776,776.0 31.3 Median age for Other race residents34.1 26.6 19.6 Median age for Two or more races residents18.4 21.2 41.2 Median age for White alone residents39.5 42.2 24.4 Median age for Hispanic or Latino residents24.1 24.9
Owner/renter occupied households by race in Calhoun
House owners and renters - White residents 2,639 56.6% Owner occupied2,022 43.4% Renter occupiedHouse owners and renters - Black or African American residents 140 27.9% Owner occupied362 72.1% Renter occupiedHouse owners and renters - American Indian / Alaska Native residents 229 100.0% Renter occupiedHouse owners and renters - Asian residents 46 82.2% Owner occupied10 17.8% Renter occupiedHouse owners and renters - Native Hawaiian / Pacific Islander residents 8 100.0% Renter occupiedHouse owners and renters - Other race residents 212 46.6% Owner occupied243 53.4% Renter occupiedHouse owners and renters - Two or more races residents 278 66.8% Owner occupied138 33.2% Renter occupiedHouse owners and renters - White alone residents 2,598 59.7% Owner occupied1,751 40.3% Renter occupiedHouse owners and renters - Hispanic or Latino residents 431 34.2% Owner occupied828 65.8% Renter occupied
Language usage in Calhoun
English speakers - Total 75.2% of residents of Calhoun speak English at home.
23.1% of residents speak Spanish at home 1,754 46.6% Speak English very well2,010 53.4% Speak English less than very well1.4% of residents speak other language at home 160 70.8% Speak English very well66 29.2% Speak English less than very well
English speakers - Born in the United States 80.4% of residents of Calhoun speak English at home.
18.3% of residents speak Spanish at home 659 84.7% Speak English very well119 15.3% Speak English less than very well0.8% of residents speak other language at home 23 67.6% Speak English very well11 32.4% Speak English less than very well
English speakers - Native, born elsewhere 27.6% of residents of Calhoun speak English at home.
74.5% of residents speak Spanish at home 56 19.9% Speak English very well225 80.1% Speak English less than very well3.2% of residents speak other language at home 12 100.0% Speak English very well
English speakers - Foreign-born 6.2% of residents of Calhoun speak English at home.
83.9% of residents speak Spanish at home 220 13.1% Speak English very well1,457 86.9% Speak English less than very well8.5% of residents speak other language at home 116 68.2% Speak English very well54 31.8% Speak English less than very well
White (Caucasian) - Speak only English Native:
92.6% (9,815)Foreign-born:
9.2% (43)
White (Caucasian) - Speak another language Native:
6.0% (636)Foreign-born:
82.9% (384)
American Indian / Alaska Native - Speak another language Native:
100.0% (126)Foreign-born:
100.0% (421)
Asian - Speak another language Native:
80.1% (31)Foreign-born:
100.0% (142)
Native Hawaiian / Pacific Islander - Speak another language Native:
54.3% (52)Foreign-born:
100.0% (12)
Other race - Speak another language Native:
61.8% (707)Foreign-born:
99.0% (658)
Two or more races - Speak only English Native:
50.2% (648)Foreign-born:
26.6% (102)
Two or more races - Speak another language Native:
49.1% (634)Foreign-born:
74.0% (283)
White alone - Speak only English Native:
98.5% (9,760)Foreign-born:
69.7% (47)
White alone - Speak another language Native:
1.5% (152)Foreign-born:
30.6% (21)
Hispanic or Latino - Speak only English Native:
29.3% (835)Foreign-born:
0.3% (4)
Hispanic or Latino - Speak another language Native:
69.9% (1,994)Foreign-born:
99.6% (1,697)
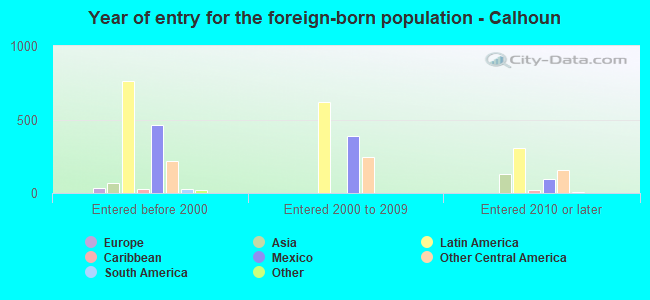
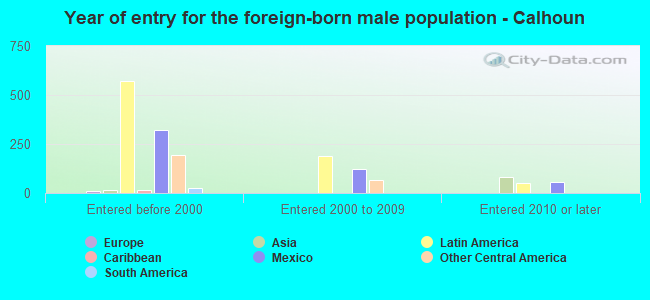
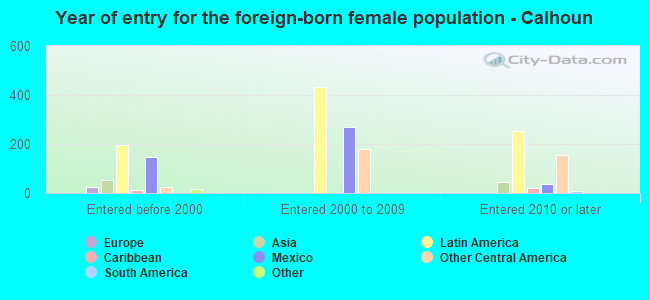
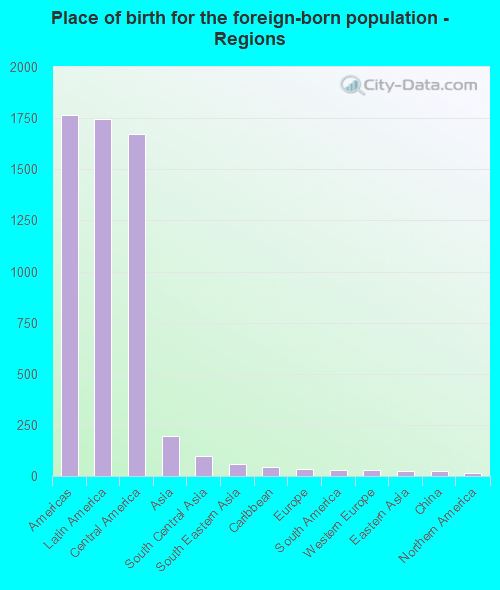
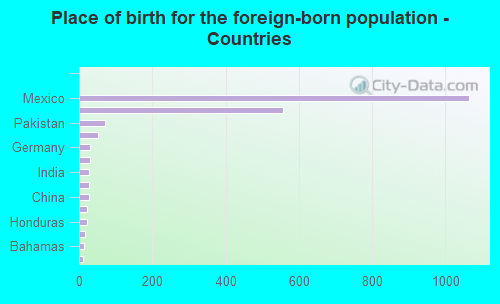
Foreign-born residents in Calhoun 1,996 residents are foreign born (9.7% Latin America ).
This city:
11.4%Georgia:
10.4%
Marital status for residents in Calhoun Marital status - White (Caucasian) population 15 years and over
Males 29.1% Never married48.5% Now married1.5% Separated4.3% Widowed16.6% DivorcedFemales 25.0% Never married44.2% Now married1.7% Separated8.7% Widowed20.4% DivorcedWomen who gave birth in the past 12 months Now married:
36.5% (26)Unmarried:
63.5% (45)
Women who did not give birth in the past 12 months Now married:
48.8% (1,358)Unmarried:
51.2% (1,426)
Marital status - Black or African American population 15 years and over
Males 13.2% Never married29.9% Now married4.1% Separated0.0% Widowed52.8% DivorcedFemales 63.0% Never married28.3% Now married0.0% Separated1.1% Widowed7.6% DivorcedWomen who did not give birth in the past 12 months Now married:
17.8% (45)Unmarried:
82.2% (206)
Marital status - American Indian / Alaska Native population 15 years and over
Males 0.0% Never married100.0% Now married0.0% Separated0.0% Widowed0.0% DivorcedFemales 0.0% Never married72.1% Now married27.9% Separated0.0% Widowed0.0% DivorcedWomen who did not give birth in the past 12 months Now married:
100.0% (176)Unmarried:
0.0% (0)
Marital status - Asian population 15 years and over
Males 73.0% Never married27.0% Now married0.0% Separated0.0% Widowed0.0% DivorcedFemales 30.5% Never married44.1% Now married0.0% Separated0.0% Widowed25.4% DivorcedWomen who did not give birth in the past 12 months Now married:
23.3% (10)Unmarried:
76.7% (34)
Marital status - Native Hawaiian / Pacific Islander population 15 years and over
Males 100.0% Never married0.0% Now married0.0% Separated0.0% Widowed0.0% DivorcedFemales 65.2% Never married0.0% Now married34.8% Separated0.0% Widowed0.0% DivorcedWomen who did not give birth in the past 12 months Now married:
0.0% (0)Unmarried:
100.0% (16)
Marital status - Other race population 15 years and over
Males 36.3% Never married57.0% Now married0.0% Separated0.0% Widowed6.7% DivorcedFemales 46.4% Never married47.2% Now married2.7% Separated0.0% Widowed3.8% DivorcedWomen who gave birth in the past 12 months Now married:
0.0% (0)Unmarried:
100.0% (60)
Women who did not give birth in the past 12 months Now married:
47.4% (248)Unmarried:
52.6% (275)
Marital status - Two or more races population 15 years and over
Males 59.8% Never married36.3% Now married0.0% Separated0.0% Widowed4.0% DivorcedFemales 34.6% Never married48.0% Now married9.8% Separated0.0% Widowed7.6% DivorcedWomen who gave birth in the past 12 months Now married:
100.0% (115)Unmarried:
0.0% (0)
Women who did not give birth in the past 12 months Now married:
39.3% (123)Unmarried:
60.7% (189)
Marital status - White alone, not Hispanic / Latino population 15 years and over
Males 26.0% Never married48.8% Now married1.7% Separated5.0% Widowed18.4% DivorcedFemales 23.2% Never married42.6% Now married2.0% Separated9.8% Widowed22.4% DivorcedWomen who gave birth in the past 12 months Now married:
36.5% (27)Unmarried:
63.5% (46)
Women who did not give birth in the past 12 months Now married:
48.8% (1,138)Unmarried:
51.2% (1,194)
Marital status - Hispanic or Latino population 15 years and over
Males 44.2% Never married50.8% Now married0.0% Separated0.0% Widowed5.0% DivorcedFemales 39.0% Never married49.2% Now married5.8% Separated0.4% Widowed5.6% DivorcedWomen who gave birth in the past 12 months Now married:
58.6% (70)Unmarried:
41.4% (50)
Women who did not give birth in the past 12 months Now married:
50.3% (671)Unmarried:
49.7% (663)
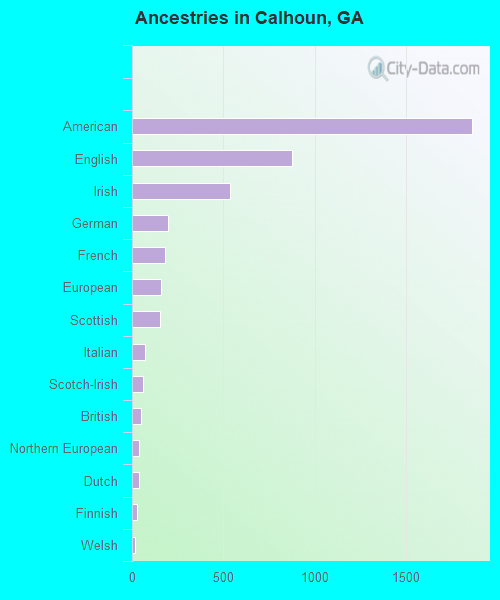
Ancestries in Calhoun
1,863 21.5% American879 10.1% English536 6.2% Irish195 2.2% German179 2.1% French160 1.8% European151 1.7% Scottish69 0.8% Italian61 0.7% Scotch-Irish51 0.6% British41 0.5% Northern European39 0.4% Dutch27 0.3% Finnish19 0.2% Welsh16 0.2% Ukrainian6 0.07% Polish6 0.07% Scandinavian
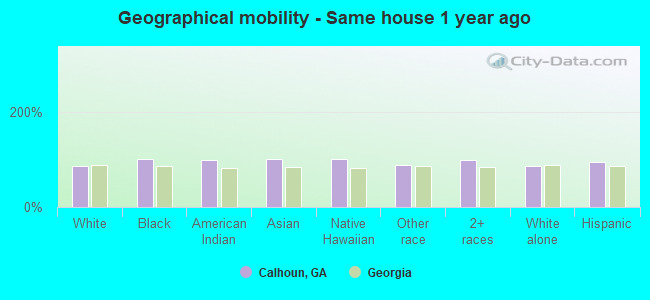
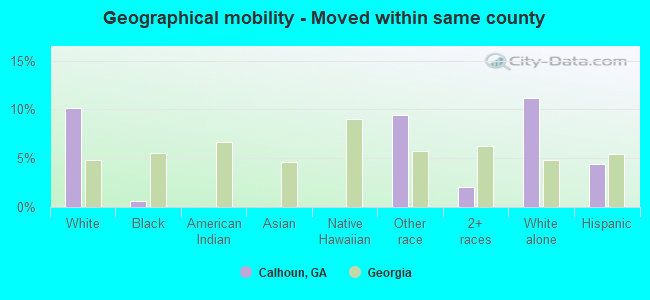
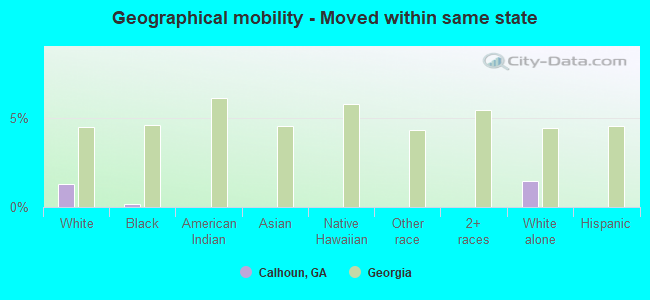
Geographical mobility in Calhoun Same house 1 year ago 9,963 86.1% White (Caucasian)1,227 100.0% Black or African American916 99.5% American Indian / Alaska Native181 99.9% Asian133 100.0% Native Hawaiian / Pacific Islander1,628 89.2% Other race1,950 97.7% Two or more races8,864 85.1% White alone, not Hispanic / Latino4,580 93.7% Hispanic or LatinoMoved within same county 1,178 10.2% White / Caucasian7 0.6% Black or African American172 9.4% Other race41 2.1% Two or more races1,159 11.1% White alone, not Hispanic / Latino216 4.4% Hispanic or LatinoMoved within same state 148 1.3% White / Caucasian2 0.2% Black or African American149 1.4% White alone, not Hispanic / LatinoMoved from different state 101 0.9% White / Caucasian7 0.4% Other race1 0.1% Two or more races73 0.7% White alone, not Hispanic / Latino37 0.8% Hispanic or LatinoMoved from abroad 93 0.8% White13 0.7% Other race112 1.1% White alone, not Hispanic / Latino12 0.3% Hispanic or Latino
Children Nativity (place of birth) in Calhoun
Children under 6 years - Living with two parents Both parents native 550 100.0% NativeBoth parents foreign-born 288 100.0% NativeOne native, one foreign-born parent 153 100.0% NativeChildren under 6 years - Living with one parent Native parent 420 100.0% NativeForeign-born parent 91 100.0% NativeChildren 6 to 17 years - Living with two parents Both parents native 1,130 100.0% NativeBoth parents foreign-born 462 98.6% Native6 1.4% Foreign-bornOne native, one foreign-born parent 52 100.0% NativeChildren 6 to 17 years - Living with one parent Native parent 805 100.0% NativeForeign-born parent 334 53.0% Native296 47.0% Foreign-born
Grandparents responsible for own grandchildren in Calhoun
Grandparents (30 to 59 years) White / Caucasian 77 100.0% Not responsible for grandchildrenOther race 115 81.1% Responsible for grandchildren27 18.9% Not responsible for grandchildrenWhite alone, not Hispanic / Latino 82 100.0% Not responsible for grandchildrenHispanic or Latino 112 85.3% Responsible for grandchildren19 14.7% Not responsible for grandchildrenGrandparents (60 years and over) White / Caucasian 100 81.0% Responsible for grandchildren23 19.0% Not responsible for grandchildrenWhite alone, not Hispanic / Latino 100 80.3% Responsible for grandchildren25 19.7% Not responsible for grandchildren