Races in Caldwell, Idaho (ID) Detailed Stats
Data:
Races - White alone (%)
Races - White alone (% change since 2000)
Races - Black alone (%)
Races - Black alone (% change since 2000)
Races - American Indian alone (%)
Races - American Indian alone (% change since 2000)
Races - Asian alone (%)
Races - Asian alone (% change since 2000)
Races - Hispanic (%)
Races - Hispanic (% change since 2000)
Races - Native Hawaiian and Other Pacific Islander alone (%)
Races - Native Hawaiian and Other Pacific Islander alone (% change since 2000)
Races - Two or more races(%)
Races - Two or more races(% change since 2000)
Races - Other race alone (%)
Races - Other race alone (% change since 2000)
Racial diversity
Place of birth - Born in state of residence (%)
Place of birth - Born in state of residence (%) - White
Place of birth - Born in state of residence (%) - Black or African American
Place of birth - Born in state of residence (%) - Asian
Place of birth - Born in state of residence (%) - Hispanic or Latino
Place of birth - Born in state of residence (%) - American Indian and Alaska Native
Place of birth - Born in state of residence (%) - Multirace
Place of birth - Born in state of residence (%) - Other Race
Place of birth - Born in other state (%)
Place of birth - Born in other state (%) - White
Place of birth - Born in other state (%) - Black or African American
Place of birth - Born in other state (%) - Asian
Place of birth - Born in other state (%) - Hispanic or Latino
Place of birth - Born in other state (%) - American Indian and Alaska Native
Place of birth - Born in other state (%) - Multirace
Place of birth - Born in other state (%) - Other Race
Place of birth - Native, outside of US (%)
Place of birth - Native, outside of US (%) - White
Place of birth - Native, outside of US (%) - Black or African American
Place of birth - Native, outside of US (%) - Asian
Place of birth - Native, outside of US (%) - Hispanic or Latino
Place of birth - Native, outside of US (%) - American Indian and Alaska Native
Place of birth - Native, outside of US (%) - Multirace
Place of birth - Native, outside of US (%) - Other Race
Place of birth - Foreign born (%)
Place of birth - Foreign born (%) - White
Place of birth - Foreign born (%) - Black or African American
Place of birth - Foreign born (%) - Asian
Place of birth - Foreign born (%) - Hispanic or Latino
Place of birth - Foreign born (%) - American Indian and Alaska Native
Place of birth - Foreign born (%) - Multirace
Place of birth - Foreign born (%) - Other Race
Residents speaking English at home (%)
Residents speaking English at home - Born in the United States (%)
Residents speaking English at home - Native, born elsewhere (%)
Residents speaking English at home - Foreign born (%)
Residents speaking Spanish at home (%)
Residents speaking Spanish at home - Born in the United States (%)
Residents speaking Spanish at home - Native, born elsewhere (%)
Residents speaking Spanish at home - Foreign born (%)
Residents speaking other language at home (%)
Residents speaking other language at home - Born in the United States (%)
Residents speaking other language at home - Native, born elsewhere (%)
Residents speaking other language at home - Foreign born (%)
Marital status - Never married (%)
Marital status - Now married (%)
Marital status - Separated (%)
Marital status - Widowed (%)
Marital status - Divorced (%)
Ancestries Reported - Arab (%)
Ancestries Reported - Czech (%)
Ancestries Reported - Danish (%)
Ancestries Reported - Dutch (%)
Ancestries Reported - English (%)
Ancestries Reported - French (%)
Ancestries Reported - French Canadian (%)
Ancestries Reported - German (%)
Ancestries Reported - Greek (%)
Ancestries Reported - Hungarian (%)
Ancestries Reported - Irish (%)
Ancestries Reported - Italian (%)
Ancestries Reported - Lithuanian (%)
Ancestries Reported - Norwegian (%)
Ancestries Reported - Polish (%)
Ancestries Reported - Portuguese (%)
Ancestries Reported - Russian (%)
Ancestries Reported - Scotch-Irish (%)
Ancestries Reported - Scottish (%)
Ancestries Reported - Slovak (%)
Ancestries Reported - Subsaharan African (%)
Ancestries Reported - Swedish (%)
Ancestries Reported - Swiss (%)
Ancestries Reported - Ukrainian (%)
Ancestries Reported - United States (%)
Ancestries Reported - Welsh (%)
Ancestries Reported - West Indian (%)
Ancestries Reported - Other (%)
Geographical mobility - Same house 1 year ago (%)
Geographical mobility - Same house 1 year ago (%) - White
Geographical mobility - Same house 1 year ago (%) - Black or African American
Geographical mobility - Same house 1 year ago (%) - Asian
Geographical mobility - Same house 1 year ago (%) - Hispanic or Latino
Geographical mobility - Same house 1 year ago (%) - American Indian and Alaska Native
Geographical mobility - Same house 1 year ago (%) - Multirace
Geographical mobility - Same house 1 year ago (%) - Other Race
Geographical mobility - Moved within same county (%)
Geographical mobility - Moved within same county (%) - White
Geographical mobility - Moved within same county (%) - Black or African American
Geographical mobility - Moved within same county (%) - Asian
Geographical mobility - Moved within same county (%) - Hispanic or Latino
Geographical mobility - Moved within same county (%) - American Indian and Alaska Native
Geographical mobility - Moved within same county (%) - Multirace
Geographical mobility - Moved within same county (%) - Other Race
Geographical mobility - Moved from different county within same state (%)
Geographical mobility - Moved from different county within same state (%) - White
Geographical mobility - Moved from different county within same state (%) - Black or African American
Geographical mobility - Moved from different county within same state (%) - Asian
Geographical mobility - Moved from different county within same state (%) - Hispanic or Latino
Geographical mobility - Moved from different county within same state (%) - American Indian and Alaska Native
Geographical mobility - Moved from different county within same state (%) - Multirace
Geographical mobility - Moved from different county within same state (%) - Other Race
Geographical mobility - Moved from different state (%)
Geographical mobility - Moved from different state (%) - White
Geographical mobility - Moved from different state (%) - Black or African American
Geographical mobility - Moved from different state (%) - Asian
Geographical mobility - Moved from different state (%) - Hispanic or Latino
Geographical mobility - Moved from different state (%) - American Indian and Alaska Native
Geographical mobility - Moved from different state (%) - Multirace
Geographical mobility - Moved from different state (%) - Other Race
Geographical mobility - Moved from abroad (%)
Geographical mobility - Moved from abroad (%) - White
Geographical mobility - Moved from abroad (%) - Black or African American
Geographical mobility - Moved from abroad (%) - Asian
Geographical mobility - Moved from abroad (%) - Hispanic or Latino
Geographical mobility - Moved from abroad (%) - American Indian and Alaska Native
Geographical mobility - Moved from abroad (%) - Multirace
Geographical mobility - Moved from abroad (%) - Other Race
Place of birth for the foreign-born population - Ireland (%)
Place of birth for the foreign-born population - Denmark (%)
Place of birth for the foreign-born population - Norway (%)
Place of birth for the foreign-born population - Sweden (%)
Place of birth for the foreign-born population - United Kingdom (%)
Place of birth for the foreign-born population - England (%)
Place of birth for the foreign-born population - Scotland (%)
Place of birth for the foreign-born population - Other Northern Europe (%)
Place of birth for the foreign-born population - Austria (%)
Place of birth for the foreign-born population - Belgium (%)
Place of birth for the foreign-born population - France (%)
Place of birth for the foreign-born population - Germany (%)
Place of birth for the foreign-born population - Netherlands (%)
Place of birth for the foreign-born population - Switzerland (%)
Place of birth for the foreign-born population - Other Western Europe (%)
Place of birth for the foreign-born population - Greece (%)
Place of birth for the foreign-born population - Italy (%)
Place of birth for the foreign-born population - Portugal (%)
Place of birth for the foreign-born population - Spain (%)
Place of birth for the foreign-born population - Other Southern Europe (%)
Place of birth for the foreign-born population - Albania (%)
Place of birth for the foreign-born population - Belarus (%)
Place of birth for the foreign-born population - Bosnia and Herzegovina (%)
Place of birth for the foreign-born population - Bulgaria (%)
Place of birth for the foreign-born population - Croatia (%)
Place of birth for the foreign-born population - Czechoslovakia (%)
Place of birth for the foreign-born population - Hungary (%)
Place of birth for the foreign-born population - Latvia (%)
Place of birth for the foreign-born population - Lithuania (%)
Place of birth for the foreign-born population - North Macedonia (Macedonia) (%)
Place of birth for the foreign-born population - Moldova (%)
Place of birth for the foreign-born population - Poland (%)
Place of birth for the foreign-born population - Romania (%)
Place of birth for the foreign-born population - Russia (%)
Place of birth for the foreign-born population - Serbia (%)
Place of birth for the foreign-born population - Ukraine (%)
Place of birth for the foreign-born population - Other Eastern Europe (%)
Place of birth for the foreign-born population - China (%)
Place of birth for the foreign-born population - Hong Kong (%)
Place of birth for the foreign-born population - Taiwan (%)
Place of birth for the foreign-born population - Japan (%)
Place of birth for the foreign-born population - Korea (%)
Place of birth for the foreign-born population - Other Eastern Asia (%)
Place of birth for the foreign-born population - Afghanistan (%)
Place of birth for the foreign-born population - Bangladesh (%)
Place of birth for the foreign-born population - India (%)
Place of birth for the foreign-born population - Iran (%)
Place of birth for the foreign-born population - Kazakhstan (%)
Place of birth for the foreign-born population - Nepal (%)
Place of birth for the foreign-born population - Pakistan (%)
Place of birth for the foreign-born population - Sri Lanka (%)
Place of birth for the foreign-born population - Uzbekistan (%)
Place of birth for the foreign-born population - Other South Central Asia (%)
Place of birth for the foreign-born population - Burma (%)
Place of birth for the foreign-born population - Cambodia (%)
Place of birth for the foreign-born population - Indonesia (%)
Place of birth for the foreign-born population - Laos (%)
Place of birth for the foreign-born population - Malaysia (%)
Place of birth for the foreign-born population - Philippines (%)
Place of birth for the foreign-born population - Singapore (%)
Place of birth for the foreign-born population - Thailand (%)
Place of birth for the foreign-born population - Vietnam (%)
Place of birth for the foreign-born population - Other South Eastern Asia (%)
Place of birth for the foreign-born population - Armenia (%)
Place of birth for the foreign-born population - Iraq (%)
Place of birth for the foreign-born population - Israel (%)
Place of birth for the foreign-born population - Jordan (%)
Place of birth for the foreign-born population - Kuwait (%)
Place of birth for the foreign-born population - Lebanon (%)
Place of birth for the foreign-born population - Saudi Arabia (%)
Place of birth for the foreign-born population - Syria (%)
Place of birth for the foreign-born population - Turkey (%)
Place of birth for the foreign-born population - Yemen (%)
Place of birth for the foreign-born population - Other Western Asia (%)
Place of birth for the foreign-born population - Eritrea (%)
Place of birth for the foreign-born population - Ethiopia (%)
Place of birth for the foreign-born population - Kenya (%)
Place of birth for the foreign-born population - Somalia (%)
Place of birth for the foreign-born population - Uganda (%)
Place of birth for the foreign-born population - Zimbabwe (%)
Place of birth for the foreign-born population - Other Eastern Africa (%)
Place of birth for the foreign-born population - Cameroon (%)
Place of birth for the foreign-born population - Congo (%)
Place of birth for the foreign-born population - Democratic Republic of Congo (Zaire) (%)
Place of birth for the foreign-born population - Other Middle Africa (%)
Place of birth for the foreign-born population - Egypt (%)
Place of birth for the foreign-born population - Morocco (%)
Place of birth for the foreign-born population - Sudan (%)
Place of birth for the foreign-born population - Other Northern Africa (%)
Place of birth for the foreign-born population - South Africa (%)
Place of birth for the foreign-born population - Other Southern Africa (%)
Place of birth for the foreign-born population - Cabo Verde (%)
Place of birth for the foreign-born population - Ghana (%)
Place of birth for the foreign-born population - Liberia (%)
Place of birth for the foreign-born population - Nigeria (%)
Place of birth for the foreign-born population - Senegal (%)
Place of birth for the foreign-born population - Sierra Leone (%)
Place of birth for the foreign-born population - Other Western Africa (%)
Place of birth for the foreign-born population - Australia (%)
Place of birth for the foreign-born population - New Zealand (%)
Place of birth for the foreign-born population - Fiji (%)
Place of birth for the foreign-born population - Micronesia (%)
Place of birth for the foreign-born population - Bahamas (%)
Place of birth for the foreign-born population - Barbados (%)
Place of birth for the foreign-born population - Cuba (%)
Place of birth for the foreign-born population - Dominica (%)
Place of birth for the foreign-born population - Dominican Republic (%)
Place of birth for the foreign-born population - Grenada (%)
Place of birth for the foreign-born population - Haiti (%)
Place of birth for the foreign-born population - Jamaica (%)
Place of birth for the foreign-born population - St. Vincent and the Grenadines (%)
Place of birth for the foreign-born population - Trinidad and Tobago (%)
Place of birth for the foreign-born population - West Indies (%)
Place of birth for the foreign-born population - Other Caribbean (%)
Place of birth for the foreign-born population - Belize (%)
Place of birth for the foreign-born population - Costa Rica (%)
Place of birth for the foreign-born population - El Salvador (%)
Place of birth for the foreign-born population - Guatemala (%)
Place of birth for the foreign-born population - Honduras (%)
Place of birth for the foreign-born population - Mexico (%)
Place of birth for the foreign-born population - Nicaragua (%)
Place of birth for the foreign-born population - Panama (%)
Place of birth for the foreign-born population - Other Central America (%)
Place of birth for the foreign-born population - Argentina (%)
Place of birth for the foreign-born population - Bolivia (%)
Place of birth for the foreign-born population - Brazil (%)
Place of birth for the foreign-born population - Chile (%)
Place of birth for the foreign-born population - Colombia (%)
Place of birth for the foreign-born population - Ecuador (%)
Place of birth for the foreign-born population - Guyana (%)
Place of birth for the foreign-born population - Peru (%)
Place of birth for the foreign-born population - Uruguay (%)
Place of birth for the foreign-born population - Venezuela (%)
Place of birth for the foreign-born population - Other South America (%)
Place of birth for the foreign-born population - Canada (%)
Place of birth for the foreign-born population - Other Northern America (%)
Place of birth for the foreign-born population - Other (%)
Latest news about races in Caldwell, ID collected exclusively by city-data.com from local newspapers, TV, and radio stations
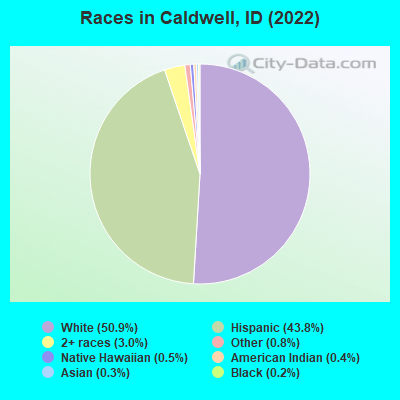
According to 2022 data, the most numerous races in Caldwell, ID are White alone (33,584 residents), Hispanic (28,881 residents), and Two or more races (1,988 residents). 68.8% of Caldwell residents speak English at home. 11.7% of Caldwell, ID residents are foreign-born (10.5% born in Latin America), which is 57.2% greater than the foreign-born rate of 5.0% across the entire state of Idaho.
Race distribution in Caldwell
2000 2022
1,139,291 88.0% White alone 101,690 7.9% Hispanic 18,261 1.4% Two or more races 15,789 1.2% American Indian alone 11,641 0.9% Asian alone 4,889 0.4% Black alone 1,192 0.09% Other race alone 1,200 0.09% Native Hawaiian and Other
1,531,219 79.0% White alone 261,921 13.5% Hispanic 81,112 4.2% Two or more races 25,174 1.3% Asian alone 15,825 0.8% American Indian alone 11,868 0.6% Black alone 8,752 0.5% Other race alone 3,162 0.2% Native Hawaiian and Other
Income and house value in Caldwell Median household income in 2022 $70,886 White non-Hispanic householders$42,553 American Indian and Alaska Native householders$54,388 Some other race householders$63,061 Two or more races householders$57,616 Hispanic or Latino race householdersMedian 2022 house value $401,470 White Non-Hispanic householders$394,508 Black or African American householders$374,551 American Indian or Alaska Native householders $371,302 Asian householders$440,921 Native Hawaiian and other Pacific Islander householders$365,268 Some other race householders$382,905 Two or more races householders$358,770 Hispanic or Latino householders
Median age by race in Caldwell
35.2 Median age for White residents34.3 35.8 31.0 Median age for Black or African American residents29.0 37.6 12.8 Median age for American Indian / Alaska Native residents15.2 12.8 32.7 Median age for Asian residents32.5 51.6 18.0 Median age for Native Hawaiian / Pacific Islander residents17.5 -666,666,666.0 33.4 Median age for Other race residents35.4 33.1 20.9 Median age for Two or more races residents20.9 21.0 38.4 Median age for White alone residents38.1 38.8 24.3 Median age for Hispanic or Latino residents24.9 21.9
Owner/renter occupied households by race in Caldwell
House owners and renters - White residents 10,644 71.3% Owner occupied4,289 28.7% Renter occupiedHouse owners and renters - Black or African American residents 34 37.1% Owner occupied57 62.9% Renter occupiedHouse owners and renters - American Indian / Alaska Native residents 84 20.9% Owner occupied318 79.1% Renter occupiedHouse owners and renters - Asian residents 266 86.6% Owner occupied41 13.4% Renter occupiedHouse owners and renters - Other race residents 2,231 70.3% Owner occupied942 29.7% Renter occupiedHouse owners and renters - Two or more races residents 2,691 89.1% Owner occupied328 10.9% Renter occupiedHouse owners and renters - White alone residents 9,659 69.8% Owner occupied4,179 30.2% Renter occupiedHouse owners and renters - Hispanic or Latino residents 5,072 79.2% Owner occupied1,335 20.8% Renter occupied
Language usage in Caldwell
English speakers - Total 68.8% of residents of Caldwell speak English at home.
30.2% of residents speak Spanish at home 10,894 59.1% Speak English very well7,552 40.9% Speak English less than very well1.0% of residents speak other language at home 447 73.0% Speak English very well165 27.0% Speak English less than very well
English speakers - Born in the United States 75.8% of residents of Caldwell speak English at home.
24.1% of residents speak Spanish at home 4,507 66.2% Speak English very well2,300 33.8% Speak English less than very well
English speakers - Native, born elsewhere 71.2% of residents of Caldwell speak English at home.
28.8% of residents speak Spanish at home 114 100.0% Speak English very well
English speakers - Foreign-born 16.1% of residents of Caldwell speak English at home.
79.9% of residents speak Spanish at home 2,199 31.3% Speak English very well4,823 68.7% Speak English less than very well4.1% of residents speak other language at home 193 53.9% Speak English very well165 46.1% Speak English less than very well
White (Caucasian) - Speak only English Native:
94.4% (35,051)Foreign-born:
25.5% (327)
White (Caucasian) - Speak another language Native:
5.2% (1,925)Foreign-born:
74.7% (957)
Black or African American - Speak only English Native:
100.0% (128)Foreign-born:
77.7% (96)
Black or African American - Speak another language Native:
3.5% (4)Foreign-born:
26.5% (33)
American Indian / Alaska Native - Speak another language Native:
20.4% (155)Foreign-born:
98.9% (45)
Asian - Speak only English Native:
62.9% (143)Foreign-born:
56.5% (87)
Asian - Speak another language Native:
5.2% (12)Foreign-born:
56.0% (86)
Other race - Speak only English Native:
29.4% (2,010)Foreign-born:
4.9% (182)
Other race - Speak another language Native:
70.6% (4,822)Foreign-born:
95.1% (3,562)
Two or more races - Speak only English Native:
51.6% (4,429)Foreign-born:
24.7% (1,024)
Two or more races - Speak another language Native:
48.4% (4,161)Foreign-born:
75.3% (3,126)
White alone - Speak only English Native:
98.0% (33,481)Foreign-born:
47.0% (257)
White alone - Speak another language Native:
2.0% (699)Foreign-born:
53.8% (294)
Hispanic or Latino - Speak only English Native:
36.3% (6,233)Foreign-born:
14.3% (1,174)
Hispanic or Latino - Speak another language Native:
63.7% (10,927)Foreign-born:
85.7% (7,022)
Foreign-born residents in Caldwell 7,637 residents are foreign born (10.5% Latin America ).
This city:
11.7%Idaho:
5.7%
Marital status for residents in Caldwell Marital status - White (Caucasian) population 15 years and over
Males 37.1% Never married50.2% Now married0.6% Separated1.0% Widowed11.1% DivorcedFemales 29.6% Never married51.2% Now married1.7% Separated5.9% Widowed11.6% DivorcedWomen who gave birth in the past 12 months Now married:
79.8% (202)Unmarried:
20.2% (51)
Women who did not give birth in the past 12 months Now married:
54.6% (5,489)Unmarried:
45.4% (4,556)
Marital status - Black or African American population 15 years and over
Males 71.6% Never married2.6% Now married5.7% Separated0.0% Widowed20.1% DivorcedFemales 73.2% Never married0.0% Now married12.5% Separated0.0% Widowed14.3% DivorcedWomen who did not give birth in the past 12 months Now married:
14.6% (7)Unmarried:
85.4% (40)
Marital status - American Indian / Alaska Native population 15 years and over
Males 31.3% Never married49.7% Now married0.0% Separated8.2% Widowed10.8% DivorcedFemales 24.8% Never married19.6% Now married4.5% Separated42.3% Widowed8.7% DivorcedWomen who gave birth in the past 12 months Now married:
76.9% (11)Unmarried:
23.1% (3)
Women who did not give birth in the past 12 months Now married:
41.1% (105)Unmarried:
58.9% (151)
Marital status - Asian population 15 years and over
Males 27.8% Never married30.4% Now married0.0% Separated0.0% Widowed41.7% DivorcedFemales 7.1% Never married41.0% Now married0.0% Separated0.0% Widowed51.9% DivorcedWomen who gave birth in the past 12 months Now married:
100.0% (38)Unmarried:
0.0% (0)
Women who did not give birth in the past 12 months Now married:
40.6% (67)Unmarried:
59.4% (97)
Marital status - Native Hawaiian / Pacific Islander population 15 years and over
Males 35.1% Never married64.9% Now married0.0% Separated0.0% Widowed0.0% DivorcedFemales 100.0% Never married0.0% Now married0.0% Separated0.0% Widowed0.0% DivorcedWomen who did not give birth in the past 12 months Now married:
0.0% (0)Unmarried:
100.0% (27)
Marital status - Other race population 15 years and over
Males 51.7% Never married44.3% Now married0.0% Separated0.0% Widowed4.0% DivorcedFemales 44.0% Never married46.4% Now married0.0% Separated1.3% Widowed8.3% DivorcedWomen who gave birth in the past 12 months Now married:
84.0% (118)Unmarried:
16.0% (23)
Women who did not give birth in the past 12 months Now married:
44.1% (1,216)Unmarried:
55.9% (1,541)
Marital status - Two or more races population 15 years and over
Males 46.4% Never married45.0% Now married0.2% Separated1.1% Widowed7.3% DivorcedFemales 40.4% Never married33.4% Now married2.2% Separated10.5% Widowed13.4% DivorcedWomen who gave birth in the past 12 months Now married:
60.9% (92)Unmarried:
39.1% (59)
Women who did not give birth in the past 12 months Now married:
39.5% (1,425)Unmarried:
60.5% (2,185)
Marital status - White alone, not Hispanic / Latino population 15 years and over
Males 34.5% Never married51.9% Now married0.7% Separated1.1% Widowed11.8% DivorcedFemales 27.4% Never married52.2% Now married1.9% Separated6.5% Widowed11.9% DivorcedWomen who gave birth in the past 12 months Now married:
100.0% (119)Unmarried:
0.0% (0)
Women who did not give birth in the past 12 months Now married:
56.5% (5,034)Unmarried:
43.5% (3,868)
Marital status - Hispanic or Latino population 15 years and over
Males 50.0% Never married45.1% Now married0.0% Separated0.8% Widowed4.2% DivorcedFemales 52.0% Never married40.4% Now married0.6% Separated1.2% Widowed5.8% DivorcedWomen who gave birth in the past 12 months Now married:
37.4% (83)Unmarried:
62.6% (139)
Women who did not give birth in the past 12 months Now married:
40.5% (3,117)Unmarried:
59.5% (4,588)
Ancestries in Caldwell
2,340 8.2% English1,706 6.0% German1,649 5.8% American1,039 3.7% European681 2.4% Irish679 2.4% Russian282 1.0% French236 0.8% Scottish227 0.8% Norwegian216 0.8% Dutch129 0.5% Italian121 0.4% Scandinavian109 0.4% British97 0.3% Eastern European96 0.3% Northern European91 0.3% Polish87 0.3% Swedish74 0.3% Scotch-Irish67 0.2% Welsh65 0.2% African60 0.2% Danish51 0.2% Czech47 0.2% Bulgarian46 0.2% Canadian40 0.1% Ukrainian39 0.1% Swiss32 0.1% Iraqi26 0.09% Romanian25 0.09% Turkish18 0.06% Greek14 0.05% Portuguese14 0.05% Ugandan13 0.05% French Canadian11 0.04% Hungarian11 0.04% Palestinian9 0.03% Croatian9 0.03% Armenian7 0.02% Basque7 0.02% Australian
Geographical mobility in Caldwell Same house 1 year ago 32,033 85.7% White (Caucasian)177 71.4% Black or African American1,270 97.0% American Indian / Alaska Native444 89.6% Asian135 100.0% Native Hawaiian / Pacific Islander10,835 98.1% Other race10,221 91.2% Two or more races28,217 84.2% White alone, not Hispanic / Latino25,872 90.5% Hispanic or LatinoMoved within same county 3,085 8.3% White / Caucasian64 25.8% Black or African American17 1.3% American Indian / Alaska Native13 2.6% Asian422 3.8% Other race922 8.2% Two or more races3,085 9.2% White alone, not Hispanic / Latino1,871 6.5% Hispanic or LatinoMoved within same state 1,394 3.7% White / Caucasian2 0.9% Black or African American15 1.2% American Indian / Alaska Native20 4.1% Asian65 0.6% Other race263 2.3% Two or more races1,341 4.0% White alone, not Hispanic / Latino776 2.7% Hispanic or LatinoMoved from different state 874 2.3% White / Caucasian15 6.1% Black or African American6 0.5% American Indian / Alaska Native69 0.6% Other race40 0.4% Two or more races874 2.6% White alone, not Hispanic / LatinoMoved from abroad 115 1.0% Other race67 0.6% Two or more races81 0.3% Hispanic or Latino
Children Nativity (place of birth) in Caldwell
Children under 6 years - Living with two parents Both parents native 1,928 100.0% NativeBoth parents foreign-born 577 100.0% NativeOne native, one foreign-born parent 763 100.0% NativeChildren under 6 years - Living with one parent Native parent 2,074 100.0% NativeForeign-born parent 218 54.1% Native185 45.9% Foreign-bornChildren 6 to 17 years - Living with two parents Both parents native 6,359 100.0% NativeBoth parents foreign-born 2,280 93.1% Native168 6.9% Foreign-bornOne native, one foreign-born parent 1,086 100.0% NativeChildren 6 to 17 years - Living with one parent Native parent 1,942 100.0% NativeForeign-born parent 1,094 51.7% Native1,023 48.3% Foreign-born
Grandparents responsible for own grandchildren in Caldwell
Grandparents (30 to 59 years) White / Caucasian 98 61.5% Responsible for grandchildren61 38.5% Not responsible for grandchildrenOther race 105 24.0% Responsible for grandchildren333 76.0% Not responsible for grandchildrenTwo or more races 269 95.6% Responsible for grandchildren12 4.4% Not responsible for grandchildrenWhite alone, not Hispanic / Latino 94 62.4% Responsible for grandchildren57 37.6% Not responsible for grandchildrenHispanic or Latino 292 49.0% Responsible for grandchildren304 51.0% Not responsible for grandchildrenGrandparents (60 years and over) White / Caucasian 63 17.6% Responsible for grandchildren296 82.4% Not responsible for grandchildrenOther race 23 11.7% Responsible for grandchildren172 88.3% Not responsible for grandchildrenTwo or more races 23 36.5% Responsible for grandchildren40 63.5% Not responsible for grandchildrenWhite alone, not Hispanic / Latino 66 18.2% Responsible for grandchildren299 81.8% Not responsible for grandchildrenHispanic or Latino 59 41.1% Responsible for grandchildren85 58.9% Not responsible for grandchildren