Races in Butte, Montana (MT) Detailed Stats
Ancestries, Foreign-born residents, place of birth
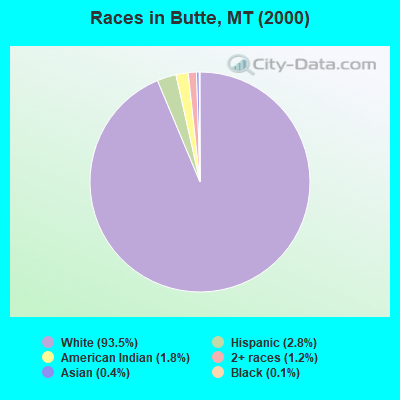
Race distribution in Butte

- 31,33693.5%White alone
- 9372.8%Hispanic
- 6171.8%American Indian alone
- 3901.2%Two or more races
- 1440.4%Asian alone
- 450.1%Black alone
- 200.06%Native Hawaiian and Other
Pacific Islander alone - 180.05%Other race alone
2000
2022
-
- 807,82389.5%White alone
- 54,4266.0%American Indian alone
- 18,0812.0%Hispanic
- 13,7681.5%Two or more races
- 4,5690.5%Asian alone
- 2,5340.3%Black alone
- 5690.06%Other race alone
- 4250.05%Native Hawaiian and Other
Pacific Islander alone

-
- 937,36583.5%White alone
- 58,7485.2%American Indian alone
- 55,1724.9%Two or more races
- 49,8304.4%Hispanic
- 9,0120.8%Other race alone
- 7,7000.7%Asian alone
- 3,4280.3%Black alone
- 1,6120.1%Native Hawaiian and Other
Pacific Islander alone

Income and house value in Butte
- Median household income in 2022
- $63,904White non-Hispanic householders
- $12,222Black householders
- $30,604American Indian and Alaska Native householders
- $36,939Asian householders
- $26,179Some other race householders
- $101,128Two or more races householders
- $62,606Hispanic or Latino race householders
- Median 2022 house value
- $239,461White Non-Hispanic householders
- $116,063American Indian or Alaska Native householders
- $139,977Asian householders
- $271,027Native Hawaiian and other Pacific Islander householders
- $195,458Some other race householders
- $224,474Two or more races householders
- $194,502Hispanic or Latino householders
Household income for White non-Hispanic householders

Household income for Black householders

Household income for American Indian and Alaska Native householders

Household income for Asian householders

Household income for Native Hawaiian and other Pacific Islander householders

Household income for Two or more races householders

Household income for Hispanic or Latino race householders

Zip code: 59701