Races in Burr Ridge, Illinois (IL) Detailed Stats
Data:
Races - White alone (%)
Races - White alone (% change since 2000)
Races - Black alone (%)
Races - Black alone (% change since 2000)
Races - American Indian alone (%)
Races - American Indian alone (% change since 2000)
Races - Asian alone (%)
Races - Asian alone (% change since 2000)
Races - Hispanic (%)
Races - Hispanic (% change since 2000)
Races - Native Hawaiian and Other Pacific Islander alone (%)
Races - Native Hawaiian and Other Pacific Islander alone (% change since 2000)
Races - Two or more races(%)
Races - Two or more races(% change since 2000)
Races - Other race alone (%)
Races - Other race alone (% change since 2000)
Racial diversity
Place of birth - Born in state of residence (%)
Place of birth - Born in state of residence (%) - White
Place of birth - Born in state of residence (%) - Black or African American
Place of birth - Born in state of residence (%) - Asian
Place of birth - Born in state of residence (%) - Hispanic or Latino
Place of birth - Born in state of residence (%) - American Indian and Alaska Native
Place of birth - Born in state of residence (%) - Multirace
Place of birth - Born in state of residence (%) - Other Race
Place of birth - Born in other state (%)
Place of birth - Born in other state (%) - White
Place of birth - Born in other state (%) - Black or African American
Place of birth - Born in other state (%) - Asian
Place of birth - Born in other state (%) - Hispanic or Latino
Place of birth - Born in other state (%) - American Indian and Alaska Native
Place of birth - Born in other state (%) - Multirace
Place of birth - Born in other state (%) - Other Race
Place of birth - Native, outside of US (%)
Place of birth - Native, outside of US (%) - White
Place of birth - Native, outside of US (%) - Black or African American
Place of birth - Native, outside of US (%) - Asian
Place of birth - Native, outside of US (%) - Hispanic or Latino
Place of birth - Native, outside of US (%) - American Indian and Alaska Native
Place of birth - Native, outside of US (%) - Multirace
Place of birth - Native, outside of US (%) - Other Race
Place of birth - Foreign born (%)
Place of birth - Foreign born (%) - White
Place of birth - Foreign born (%) - Black or African American
Place of birth - Foreign born (%) - Asian
Place of birth - Foreign born (%) - Hispanic or Latino
Place of birth - Foreign born (%) - American Indian and Alaska Native
Place of birth - Foreign born (%) - Multirace
Place of birth - Foreign born (%) - Other Race
Residents speaking English at home (%)
Residents speaking English at home - Born in the United States (%)
Residents speaking English at home - Native, born elsewhere (%)
Residents speaking English at home - Foreign born (%)
Residents speaking Spanish at home (%)
Residents speaking Spanish at home - Born in the United States (%)
Residents speaking Spanish at home - Native, born elsewhere (%)
Residents speaking Spanish at home - Foreign born (%)
Residents speaking other language at home (%)
Residents speaking other language at home - Born in the United States (%)
Residents speaking other language at home - Native, born elsewhere (%)
Residents speaking other language at home - Foreign born (%)
Marital status - Never married (%)
Marital status - Now married (%)
Marital status - Separated (%)
Marital status - Widowed (%)
Marital status - Divorced (%)
Ancestries Reported - Arab (%)
Ancestries Reported - Czech (%)
Ancestries Reported - Danish (%)
Ancestries Reported - Dutch (%)
Ancestries Reported - English (%)
Ancestries Reported - French (%)
Ancestries Reported - French Canadian (%)
Ancestries Reported - German (%)
Ancestries Reported - Greek (%)
Ancestries Reported - Hungarian (%)
Ancestries Reported - Irish (%)
Ancestries Reported - Italian (%)
Ancestries Reported - Lithuanian (%)
Ancestries Reported - Norwegian (%)
Ancestries Reported - Polish (%)
Ancestries Reported - Portuguese (%)
Ancestries Reported - Russian (%)
Ancestries Reported - Scotch-Irish (%)
Ancestries Reported - Scottish (%)
Ancestries Reported - Slovak (%)
Ancestries Reported - Subsaharan African (%)
Ancestries Reported - Swedish (%)
Ancestries Reported - Swiss (%)
Ancestries Reported - Ukrainian (%)
Ancestries Reported - United States (%)
Ancestries Reported - Welsh (%)
Ancestries Reported - West Indian (%)
Ancestries Reported - Other (%)
Geographical mobility - Same house 1 year ago (%)
Geographical mobility - Same house 1 year ago (%) - White
Geographical mobility - Same house 1 year ago (%) - Black or African American
Geographical mobility - Same house 1 year ago (%) - Asian
Geographical mobility - Same house 1 year ago (%) - Hispanic or Latino
Geographical mobility - Same house 1 year ago (%) - American Indian and Alaska Native
Geographical mobility - Same house 1 year ago (%) - Multirace
Geographical mobility - Same house 1 year ago (%) - Other Race
Geographical mobility - Moved within same county (%)
Geographical mobility - Moved within same county (%) - White
Geographical mobility - Moved within same county (%) - Black or African American
Geographical mobility - Moved within same county (%) - Asian
Geographical mobility - Moved within same county (%) - Hispanic or Latino
Geographical mobility - Moved within same county (%) - American Indian and Alaska Native
Geographical mobility - Moved within same county (%) - Multirace
Geographical mobility - Moved within same county (%) - Other Race
Geographical mobility - Moved from different county within same state (%)
Geographical mobility - Moved from different county within same state (%) - White
Geographical mobility - Moved from different county within same state (%) - Black or African American
Geographical mobility - Moved from different county within same state (%) - Asian
Geographical mobility - Moved from different county within same state (%) - Hispanic or Latino
Geographical mobility - Moved from different county within same state (%) - American Indian and Alaska Native
Geographical mobility - Moved from different county within same state (%) - Multirace
Geographical mobility - Moved from different county within same state (%) - Other Race
Geographical mobility - Moved from different state (%)
Geographical mobility - Moved from different state (%) - White
Geographical mobility - Moved from different state (%) - Black or African American
Geographical mobility - Moved from different state (%) - Asian
Geographical mobility - Moved from different state (%) - Hispanic or Latino
Geographical mobility - Moved from different state (%) - American Indian and Alaska Native
Geographical mobility - Moved from different state (%) - Multirace
Geographical mobility - Moved from different state (%) - Other Race
Geographical mobility - Moved from abroad (%)
Geographical mobility - Moved from abroad (%) - White
Geographical mobility - Moved from abroad (%) - Black or African American
Geographical mobility - Moved from abroad (%) - Asian
Geographical mobility - Moved from abroad (%) - Hispanic or Latino
Geographical mobility - Moved from abroad (%) - American Indian and Alaska Native
Geographical mobility - Moved from abroad (%) - Multirace
Geographical mobility - Moved from abroad (%) - Other Race
Place of birth for the foreign-born population - Ireland (%)
Place of birth for the foreign-born population - Denmark (%)
Place of birth for the foreign-born population - Norway (%)
Place of birth for the foreign-born population - Sweden (%)
Place of birth for the foreign-born population - United Kingdom (%)
Place of birth for the foreign-born population - England (%)
Place of birth for the foreign-born population - Scotland (%)
Place of birth for the foreign-born population - Other Northern Europe (%)
Place of birth for the foreign-born population - Austria (%)
Place of birth for the foreign-born population - Belgium (%)
Place of birth for the foreign-born population - France (%)
Place of birth for the foreign-born population - Germany (%)
Place of birth for the foreign-born population - Netherlands (%)
Place of birth for the foreign-born population - Switzerland (%)
Place of birth for the foreign-born population - Other Western Europe (%)
Place of birth for the foreign-born population - Greece (%)
Place of birth for the foreign-born population - Italy (%)
Place of birth for the foreign-born population - Portugal (%)
Place of birth for the foreign-born population - Spain (%)
Place of birth for the foreign-born population - Other Southern Europe (%)
Place of birth for the foreign-born population - Albania (%)
Place of birth for the foreign-born population - Belarus (%)
Place of birth for the foreign-born population - Bosnia and Herzegovina (%)
Place of birth for the foreign-born population - Bulgaria (%)
Place of birth for the foreign-born population - Croatia (%)
Place of birth for the foreign-born population - Czechoslovakia (%)
Place of birth for the foreign-born population - Hungary (%)
Place of birth for the foreign-born population - Latvia (%)
Place of birth for the foreign-born population - Lithuania (%)
Place of birth for the foreign-born population - North Macedonia (Macedonia) (%)
Place of birth for the foreign-born population - Moldova (%)
Place of birth for the foreign-born population - Poland (%)
Place of birth for the foreign-born population - Romania (%)
Place of birth for the foreign-born population - Russia (%)
Place of birth for the foreign-born population - Serbia (%)
Place of birth for the foreign-born population - Ukraine (%)
Place of birth for the foreign-born population - Other Eastern Europe (%)
Place of birth for the foreign-born population - China (%)
Place of birth for the foreign-born population - Hong Kong (%)
Place of birth for the foreign-born population - Taiwan (%)
Place of birth for the foreign-born population - Japan (%)
Place of birth for the foreign-born population - Korea (%)
Place of birth for the foreign-born population - Other Eastern Asia (%)
Place of birth for the foreign-born population - Afghanistan (%)
Place of birth for the foreign-born population - Bangladesh (%)
Place of birth for the foreign-born population - India (%)
Place of birth for the foreign-born population - Iran (%)
Place of birth for the foreign-born population - Kazakhstan (%)
Place of birth for the foreign-born population - Nepal (%)
Place of birth for the foreign-born population - Pakistan (%)
Place of birth for the foreign-born population - Sri Lanka (%)
Place of birth for the foreign-born population - Uzbekistan (%)
Place of birth for the foreign-born population - Other South Central Asia (%)
Place of birth for the foreign-born population - Burma (%)
Place of birth for the foreign-born population - Cambodia (%)
Place of birth for the foreign-born population - Indonesia (%)
Place of birth for the foreign-born population - Laos (%)
Place of birth for the foreign-born population - Malaysia (%)
Place of birth for the foreign-born population - Philippines (%)
Place of birth for the foreign-born population - Singapore (%)
Place of birth for the foreign-born population - Thailand (%)
Place of birth for the foreign-born population - Vietnam (%)
Place of birth for the foreign-born population - Other South Eastern Asia (%)
Place of birth for the foreign-born population - Armenia (%)
Place of birth for the foreign-born population - Iraq (%)
Place of birth for the foreign-born population - Israel (%)
Place of birth for the foreign-born population - Jordan (%)
Place of birth for the foreign-born population - Kuwait (%)
Place of birth for the foreign-born population - Lebanon (%)
Place of birth for the foreign-born population - Saudi Arabia (%)
Place of birth for the foreign-born population - Syria (%)
Place of birth for the foreign-born population - Turkey (%)
Place of birth for the foreign-born population - Yemen (%)
Place of birth for the foreign-born population - Other Western Asia (%)
Place of birth for the foreign-born population - Eritrea (%)
Place of birth for the foreign-born population - Ethiopia (%)
Place of birth for the foreign-born population - Kenya (%)
Place of birth for the foreign-born population - Somalia (%)
Place of birth for the foreign-born population - Uganda (%)
Place of birth for the foreign-born population - Zimbabwe (%)
Place of birth for the foreign-born population - Other Eastern Africa (%)
Place of birth for the foreign-born population - Cameroon (%)
Place of birth for the foreign-born population - Congo (%)
Place of birth for the foreign-born population - Democratic Republic of Congo (Zaire) (%)
Place of birth for the foreign-born population - Other Middle Africa (%)
Place of birth for the foreign-born population - Egypt (%)
Place of birth for the foreign-born population - Morocco (%)
Place of birth for the foreign-born population - Sudan (%)
Place of birth for the foreign-born population - Other Northern Africa (%)
Place of birth for the foreign-born population - South Africa (%)
Place of birth for the foreign-born population - Other Southern Africa (%)
Place of birth for the foreign-born population - Cabo Verde (%)
Place of birth for the foreign-born population - Ghana (%)
Place of birth for the foreign-born population - Liberia (%)
Place of birth for the foreign-born population - Nigeria (%)
Place of birth for the foreign-born population - Senegal (%)
Place of birth for the foreign-born population - Sierra Leone (%)
Place of birth for the foreign-born population - Other Western Africa (%)
Place of birth for the foreign-born population - Australia (%)
Place of birth for the foreign-born population - New Zealand (%)
Place of birth for the foreign-born population - Fiji (%)
Place of birth for the foreign-born population - Micronesia (%)
Place of birth for the foreign-born population - Bahamas (%)
Place of birth for the foreign-born population - Barbados (%)
Place of birth for the foreign-born population - Cuba (%)
Place of birth for the foreign-born population - Dominica (%)
Place of birth for the foreign-born population - Dominican Republic (%)
Place of birth for the foreign-born population - Grenada (%)
Place of birth for the foreign-born population - Haiti (%)
Place of birth for the foreign-born population - Jamaica (%)
Place of birth for the foreign-born population - St. Vincent and the Grenadines (%)
Place of birth for the foreign-born population - Trinidad and Tobago (%)
Place of birth for the foreign-born population - West Indies (%)
Place of birth for the foreign-born population - Other Caribbean (%)
Place of birth for the foreign-born population - Belize (%)
Place of birth for the foreign-born population - Costa Rica (%)
Place of birth for the foreign-born population - El Salvador (%)
Place of birth for the foreign-born population - Guatemala (%)
Place of birth for the foreign-born population - Honduras (%)
Place of birth for the foreign-born population - Mexico (%)
Place of birth for the foreign-born population - Nicaragua (%)
Place of birth for the foreign-born population - Panama (%)
Place of birth for the foreign-born population - Other Central America (%)
Place of birth for the foreign-born population - Argentina (%)
Place of birth for the foreign-born population - Bolivia (%)
Place of birth for the foreign-born population - Brazil (%)
Place of birth for the foreign-born population - Chile (%)
Place of birth for the foreign-born population - Colombia (%)
Place of birth for the foreign-born population - Ecuador (%)
Place of birth for the foreign-born population - Guyana (%)
Place of birth for the foreign-born population - Peru (%)
Place of birth for the foreign-born population - Uruguay (%)
Place of birth for the foreign-born population - Venezuela (%)
Place of birth for the foreign-born population - Other South America (%)
Place of birth for the foreign-born population - Canada (%)
Place of birth for the foreign-born population - Other Northern America (%)
Place of birth for the foreign-born population - Other (%)
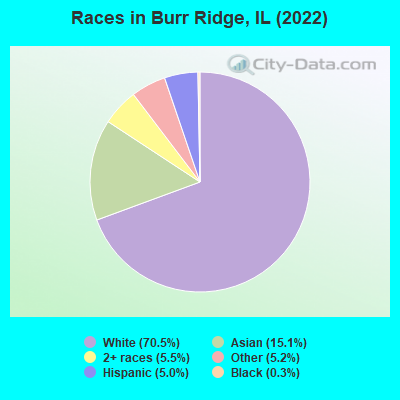
According to 2022 data, the most numerous races in Burr Ridge, IL are White alone (7,768 residents), Hispanic (553 residents), and Black alone (36 residents). 68.1% of Burr Ridge residents speak English at home. 22.7% of Burr Ridge, IL residents are foreign-born (12.6% born in Asia, 6.1% born in Europe), which is 38.4% greater than the foreign-born rate of 14.0% across the entire state of Illinois.
Race distribution in Burr Ridge
2000 2022
8,424,140 67.8% White alone 1,856,152 14.9% Black alone 1,530,262 12.3% Hispanic 419,916 3.4% Asian alone 153,996 1.2% Two or more races 13,479 0.1% Other race alone 18,232 0.1% American Indian alone 3,116 0.03% Native Hawaiian and Other
7,356,301 58.5% White alone 2,299,726 18.3% Hispanic 1,660,423 13.2% Black alone 747,296 5.9% Asian alone 458,599 3.6% Two or more races 45,386 0.4% Other race alone 10,405 0.08% American Indian alone 3,896 0.03% Native Hawaiian and Other
Income and house value in Burr Ridge Median household income in 2022 $163,928 White non-Hispanic householdersover $200,000 Asian householders$113,840 Hispanic or Latino race householdersMedian 2022 house value $726,010 White Non-Hispanic householdersover $1,000,000 Black or African American householders$174,783 American Indian or Alaska Native householders $915,553 Asian householders$291,305 Some other race householders$971,018 Two or more races householders$737,973 Hispanic or Latino householders
Median age by race in Burr Ridge
61.4 Median age for White residents60.2 62.4 63.2 Median age for Black or African American residents65.0 -649,812,733.4 -699,421,964.6 Median age for American Indian / Alaska Native residents-721,943,047.9 -545,253,862.6 50.0 Median age for Asian residents42.0 57.2 -593,236,714.4 Median age for Native Hawaiian / Pacific Islander residents-658,536,584.7 -576,015,108.0 20.8 Median age for Other race residents15.8 40.2 20.3 Median age for Two or more races residents20.4 26.0 60.5 Median age for White alone residents59.9 61.6 25.4 Median age for Hispanic or Latino residents18.6 26.7
Owner/renter occupied households by race in Burr Ridge
House owners and renters - White residents 3,332 95.3% Owner occupied163 4.7% Renter occupiedHouse owners and renters - Black or African American residents 19 100.0% Owner occupiedHouse owners and renters - Asian residents 669 100.0% Owner occupiedHouse owners and renters - Other race residents 143 100.0% Owner occupiedHouse owners and renters - Two or more races residents 218 93.3% Owner occupied16 6.7% Renter occupiedHouse owners and renters - White alone residents 3,309 95.0% Owner occupied176 5.0% Renter occupiedHouse owners and renters - Hispanic or Latino residents 153 100.0% Owner occupied
Language usage in Burr Ridge
English speakers - Total 68.1% of residents of Burr Ridge speak English at home.
4.8% of residents speak Spanish at home 436 86.2% Speak English very well70 13.8% Speak English less than very well26.3% of residents speak other language at home 2,358 84.4% Speak English very well435 15.6% Speak English less than very well
English speakers - Born in the United States 84.7% of residents of Burr Ridge speak English at home.
2.8% of residents speak Spanish at home 62 100.0% Speak English very well13.5% of residents speak other language at home 297 100.0% Speak English very well
English speakers - Native, born elsewhere 50.0% of residents of Burr Ridge speak English at home.
5.7% of residents speak Spanish at home 10 100.0% Speak English very well44.3% of residents speak other language at home 77 100.0% Speak English very well
English speakers - Foreign-born 13.6% of residents of Burr Ridge speak English at home.
7.8% of residents speak Spanish at home 127 65.5% Speak English very well67 34.5% Speak English less than very well76.7% of residents speak other language at home 1,484 77.9% Speak English very well421 22.1% Speak English less than very well
White (Caucasian) - Speak only English Native:
90.7% (5,937)Foreign-born:
26.5% (229)
White (Caucasian) - Speak another language Native:
8.3% (546)Foreign-born:
74.7% (645)
Black or African American - Speak only English Native:
100.0% (35)Foreign-born:
100.0% (2)
Asian - Speak only English Native:
50.8% (184)Foreign-born:
7.0% (81)
Asian - Speak another language Native:
47.3% (171)Foreign-born:
93.3% (1,080)
Other race - Speak only English Native:
43.5% (186)Foreign-born:
3.0% (5)
Other race - Speak another language Native:
59.0% (251)Foreign-born:
97.7% (155)
Two or more races - Speak only English Native:
75.5% (515)Foreign-born:
9.8% (25)
Two or more races - Speak another language Native:
22.7% (155)Foreign-born:
90.4% (230)
White alone - Speak only English Native:
89.7% (5,961)Foreign-born:
24.3% (245)
White alone - Speak another language Native:
9.9% (655)Foreign-born:
76.0% (766)
Hispanic or Latino - Speak only English Native:
60.2% (186)Foreign-born:
5.1% (11)
Hispanic or Latino - Speak another language Native:
38.9% (121)Foreign-born:
95.2% (209)
Foreign-born residents in Burr Ridge 2,504 residents are foreign born (12.6% Asia , 6.1% Europe ).
This city:
22.7%Illinois:
14.1%
Marital status for residents in Burr Ridge Marital status - White (Caucasian) population 15 years and over
Males 20.7% Never married68.9% Now married2.3% Separated4.3% Widowed3.8% DivorcedFemales 13.5% Never married66.3% Now married0.7% Separated13.2% Widowed6.3% DivorcedWomen who gave birth in the past 12 months Now married:
100.0% (129)Unmarried:
0.0% (0)
Women who did not give birth in the past 12 months Now married:
39.5% (283)Unmarried:
60.5% (433)
Marital status - Black or African American population 15 years and over
Males 13.6% Never married86.4% Now married0.0% Separated0.0% Widowed0.0% DivorcedFemales 0.0% Never married100.0% Now married0.0% Separated0.0% Widowed0.0% DivorcedMarital status - Asian population 15 years and over
Males 13.2% Never married86.8% Now married0.0% Separated0.0% Widowed0.0% DivorcedFemales 4.9% Never married77.7% Now married3.9% Separated6.1% Widowed7.3% DivorcedWomen who gave birth in the past 12 months Now married:
80.0% (60)Unmarried:
20.0% (15)
Women who did not give birth in the past 12 months Now married:
86.2% (144)Unmarried:
13.8% (23)
Marital status - Other race population 15 years and over
Males 32.5% Never married67.5% Now married0.0% Separated0.0% Widowed0.0% DivorcedFemales 34.1% Never married39.5% Now married0.0% Separated26.3% Widowed0.0% DivorcedWomen who did not give birth in the past 12 months Now married:
47.2% (71)Unmarried:
52.8% (80)
Marital status - Two or more races population 15 years and over
Males 37.5% Never married56.9% Now married0.0% Separated0.0% Widowed5.7% DivorcedFemales 12.0% Never married64.7% Now married0.0% Separated6.0% Widowed17.3% DivorcedWomen who gave birth in the past 12 months Now married:
100.0% (21)Unmarried:
0.0% (0)
Women who did not give birth in the past 12 months Now married:
66.7% (51)Unmarried:
33.3% (26)
Marital status - White alone, not Hispanic / Latino population 15 years and over
Males 20.8% Never married68.8% Now married2.3% Separated4.3% Widowed3.8% DivorcedFemales 11.7% Never married67.4% Now married0.7% Separated13.7% Widowed6.5% DivorcedWomen who gave birth in the past 12 months Now married:
100.0% (138)Unmarried:
0.0% (0)
Women who did not give birth in the past 12 months Now married:
41.5% (273)Unmarried:
58.5% (385)
Marital status - Hispanic or Latino population 15 years and over
Males 8.7% Never married91.3% Now married0.0% Separated0.0% Widowed0.0% DivorcedFemales 51.0% Never married38.6% Now married0.0% Separated0.0% Widowed10.4% DivorcedWomen who did not give birth in the past 12 months Now married:
34.5% (69)Unmarried:
65.5% (132)
Ancestries in Burr Ridge
561 9.8% Syrian437 7.7% Irish392 6.9% German384 6.7% Polish324 5.7% Italian223 3.9% Greek204 3.6% American164 2.9% Albanian156 2.7% English119 2.1% Iranian100 1.8% Romanian99 1.7% Egyptian91 1.6% Serbian78 1.4% Czechoslovakian72 1.3% Czech65 1.1% Norwegian60 1.1% European59 1.0% Lithuanian45 0.8% Croatian43 0.8% Dutch32 0.6% Scottish31 0.5% Palestinian29 0.5% Austrian29 0.5% Slovene28 0.5% Australian25 0.4% Eastern European24 0.4% Swedish24 0.4% Ukrainian23 0.4% Yugoslavian16 0.3% French14 0.2% Belgian14 0.2% Russian11 0.2% British9 0.2% Canadian9 0.2% Hungarian9 0.2% Slovak8 0.1% Scotch-Irish4 0.07% African
Children Nativity (place of birth) in Burr Ridge
Children under 6 years - Living with two parents Both parents native 244 100.0% NativeBoth parents foreign-born 36 100.0% NativeOne native, one foreign-born parent 152 100.0% NativeChildren under 6 years - Living with one parent Native parent 23 100.0% NativeForeign-born parent 4 100.0% NativeChildren 6 to 17 years - Living with two parents Both parents native 637 98.8% Native8 1.2% Foreign-bornBoth parents foreign-born 260 94.3% Native16 5.7% Foreign-bornOne native, one foreign-born parent 344 100.0% NativeChildren 6 to 17 years - Living with one parent Native parent 157 100.0% NativeForeign-born parent 7 48.1% Native7 51.9% Foreign-born
Grandparents responsible for own grandchildren in Burr Ridge
Grandparents (30 to 59 years) White / Caucasian 34 56.7% Responsible for grandchildren26 43.3% Not responsible for grandchildrenWhite alone, not Hispanic / Latino 29 100.0% Not responsible for grandchildrenHispanic or Latino 18 100.0% Responsible for grandchildren
Grandparents (60 years and over) White / Caucasian 5 3.0% Responsible for grandchildren154 97.0% Not responsible for grandchildrenWhite alone, not Hispanic / Latino 5 3.3% Responsible for grandchildren154 96.7% Not responsible for grandchildren