Races in Burlington, New Jersey (NJ) Detailed Stats
Data:
Races - White alone (%)
Races - White alone (% change since 2000)
Races - Black alone (%)
Races - Black alone (% change since 2000)
Races - American Indian alone (%)
Races - American Indian alone (% change since 2000)
Races - Asian alone (%)
Races - Asian alone (% change since 2000)
Races - Hispanic (%)
Races - Hispanic (% change since 2000)
Races - Native Hawaiian and Other Pacific Islander alone (%)
Races - Native Hawaiian and Other Pacific Islander alone (% change since 2000)
Races - Two or more races(%)
Races - Two or more races(% change since 2000)
Races - Other race alone (%)
Races - Other race alone (% change since 2000)
Racial diversity
Place of birth - Born in state of residence (%)
Place of birth - Born in state of residence (%) - White
Place of birth - Born in state of residence (%) - Black or African American
Place of birth - Born in state of residence (%) - Asian
Place of birth - Born in state of residence (%) - Hispanic or Latino
Place of birth - Born in state of residence (%) - American Indian and Alaska Native
Place of birth - Born in state of residence (%) - Multirace
Place of birth - Born in state of residence (%) - Other Race
Place of birth - Born in other state (%)
Place of birth - Born in other state (%) - White
Place of birth - Born in other state (%) - Black or African American
Place of birth - Born in other state (%) - Asian
Place of birth - Born in other state (%) - Hispanic or Latino
Place of birth - Born in other state (%) - American Indian and Alaska Native
Place of birth - Born in other state (%) - Multirace
Place of birth - Born in other state (%) - Other Race
Place of birth - Native, outside of US (%)
Place of birth - Native, outside of US (%) - White
Place of birth - Native, outside of US (%) - Black or African American
Place of birth - Native, outside of US (%) - Asian
Place of birth - Native, outside of US (%) - Hispanic or Latino
Place of birth - Native, outside of US (%) - American Indian and Alaska Native
Place of birth - Native, outside of US (%) - Multirace
Place of birth - Native, outside of US (%) - Other Race
Place of birth - Foreign born (%)
Place of birth - Foreign born (%) - White
Place of birth - Foreign born (%) - Black or African American
Place of birth - Foreign born (%) - Asian
Place of birth - Foreign born (%) - Hispanic or Latino
Place of birth - Foreign born (%) - American Indian and Alaska Native
Place of birth - Foreign born (%) - Multirace
Place of birth - Foreign born (%) - Other Race
Residents speaking English at home (%)
Residents speaking English at home - Born in the United States (%)
Residents speaking English at home - Native, born elsewhere (%)
Residents speaking English at home - Foreign born (%)
Residents speaking Spanish at home (%)
Residents speaking Spanish at home - Born in the United States (%)
Residents speaking Spanish at home - Native, born elsewhere (%)
Residents speaking Spanish at home - Foreign born (%)
Residents speaking other language at home (%)
Residents speaking other language at home - Born in the United States (%)
Residents speaking other language at home - Native, born elsewhere (%)
Residents speaking other language at home - Foreign born (%)
Marital status - Never married (%)
Marital status - Now married (%)
Marital status - Separated (%)
Marital status - Widowed (%)
Marital status - Divorced (%)
Ancestries Reported - Arab (%)
Ancestries Reported - Czech (%)
Ancestries Reported - Danish (%)
Ancestries Reported - Dutch (%)
Ancestries Reported - English (%)
Ancestries Reported - French (%)
Ancestries Reported - French Canadian (%)
Ancestries Reported - German (%)
Ancestries Reported - Greek (%)
Ancestries Reported - Hungarian (%)
Ancestries Reported - Irish (%)
Ancestries Reported - Italian (%)
Ancestries Reported - Lithuanian (%)
Ancestries Reported - Norwegian (%)
Ancestries Reported - Polish (%)
Ancestries Reported - Portuguese (%)
Ancestries Reported - Russian (%)
Ancestries Reported - Scotch-Irish (%)
Ancestries Reported - Scottish (%)
Ancestries Reported - Slovak (%)
Ancestries Reported - Subsaharan African (%)
Ancestries Reported - Swedish (%)
Ancestries Reported - Swiss (%)
Ancestries Reported - Ukrainian (%)
Ancestries Reported - United States (%)
Ancestries Reported - Welsh (%)
Ancestries Reported - West Indian (%)
Ancestries Reported - Other (%)
Geographical mobility - Same house 1 year ago (%)
Geographical mobility - Same house 1 year ago (%) - White
Geographical mobility - Same house 1 year ago (%) - Black or African American
Geographical mobility - Same house 1 year ago (%) - Asian
Geographical mobility - Same house 1 year ago (%) - Hispanic or Latino
Geographical mobility - Same house 1 year ago (%) - American Indian and Alaska Native
Geographical mobility - Same house 1 year ago (%) - Multirace
Geographical mobility - Same house 1 year ago (%) - Other Race
Geographical mobility - Moved within same county (%)
Geographical mobility - Moved within same county (%) - White
Geographical mobility - Moved within same county (%) - Black or African American
Geographical mobility - Moved within same county (%) - Asian
Geographical mobility - Moved within same county (%) - Hispanic or Latino
Geographical mobility - Moved within same county (%) - American Indian and Alaska Native
Geographical mobility - Moved within same county (%) - Multirace
Geographical mobility - Moved within same county (%) - Other Race
Geographical mobility - Moved from different county within same state (%)
Geographical mobility - Moved from different county within same state (%) - White
Geographical mobility - Moved from different county within same state (%) - Black or African American
Geographical mobility - Moved from different county within same state (%) - Asian
Geographical mobility - Moved from different county within same state (%) - Hispanic or Latino
Geographical mobility - Moved from different county within same state (%) - American Indian and Alaska Native
Geographical mobility - Moved from different county within same state (%) - Multirace
Geographical mobility - Moved from different county within same state (%) - Other Race
Geographical mobility - Moved from different state (%)
Geographical mobility - Moved from different state (%) - White
Geographical mobility - Moved from different state (%) - Black or African American
Geographical mobility - Moved from different state (%) - Asian
Geographical mobility - Moved from different state (%) - Hispanic or Latino
Geographical mobility - Moved from different state (%) - American Indian and Alaska Native
Geographical mobility - Moved from different state (%) - Multirace
Geographical mobility - Moved from different state (%) - Other Race
Geographical mobility - Moved from abroad (%)
Geographical mobility - Moved from abroad (%) - White
Geographical mobility - Moved from abroad (%) - Black or African American
Geographical mobility - Moved from abroad (%) - Asian
Geographical mobility - Moved from abroad (%) - Hispanic or Latino
Geographical mobility - Moved from abroad (%) - American Indian and Alaska Native
Geographical mobility - Moved from abroad (%) - Multirace
Geographical mobility - Moved from abroad (%) - Other Race
Place of birth for the foreign-born population - Ireland (%)
Place of birth for the foreign-born population - Denmark (%)
Place of birth for the foreign-born population - Norway (%)
Place of birth for the foreign-born population - Sweden (%)
Place of birth for the foreign-born population - United Kingdom (%)
Place of birth for the foreign-born population - England (%)
Place of birth for the foreign-born population - Scotland (%)
Place of birth for the foreign-born population - Other Northern Europe (%)
Place of birth for the foreign-born population - Austria (%)
Place of birth for the foreign-born population - Belgium (%)
Place of birth for the foreign-born population - France (%)
Place of birth for the foreign-born population - Germany (%)
Place of birth for the foreign-born population - Netherlands (%)
Place of birth for the foreign-born population - Switzerland (%)
Place of birth for the foreign-born population - Other Western Europe (%)
Place of birth for the foreign-born population - Greece (%)
Place of birth for the foreign-born population - Italy (%)
Place of birth for the foreign-born population - Portugal (%)
Place of birth for the foreign-born population - Spain (%)
Place of birth for the foreign-born population - Other Southern Europe (%)
Place of birth for the foreign-born population - Albania (%)
Place of birth for the foreign-born population - Belarus (%)
Place of birth for the foreign-born population - Bosnia and Herzegovina (%)
Place of birth for the foreign-born population - Bulgaria (%)
Place of birth for the foreign-born population - Croatia (%)
Place of birth for the foreign-born population - Czechoslovakia (%)
Place of birth for the foreign-born population - Hungary (%)
Place of birth for the foreign-born population - Latvia (%)
Place of birth for the foreign-born population - Lithuania (%)
Place of birth for the foreign-born population - North Macedonia (Macedonia) (%)
Place of birth for the foreign-born population - Moldova (%)
Place of birth for the foreign-born population - Poland (%)
Place of birth for the foreign-born population - Romania (%)
Place of birth for the foreign-born population - Russia (%)
Place of birth for the foreign-born population - Serbia (%)
Place of birth for the foreign-born population - Ukraine (%)
Place of birth for the foreign-born population - Other Eastern Europe (%)
Place of birth for the foreign-born population - China (%)
Place of birth for the foreign-born population - Hong Kong (%)
Place of birth for the foreign-born population - Taiwan (%)
Place of birth for the foreign-born population - Japan (%)
Place of birth for the foreign-born population - Korea (%)
Place of birth for the foreign-born population - Other Eastern Asia (%)
Place of birth for the foreign-born population - Afghanistan (%)
Place of birth for the foreign-born population - Bangladesh (%)
Place of birth for the foreign-born population - India (%)
Place of birth for the foreign-born population - Iran (%)
Place of birth for the foreign-born population - Kazakhstan (%)
Place of birth for the foreign-born population - Nepal (%)
Place of birth for the foreign-born population - Pakistan (%)
Place of birth for the foreign-born population - Sri Lanka (%)
Place of birth for the foreign-born population - Uzbekistan (%)
Place of birth for the foreign-born population - Other South Central Asia (%)
Place of birth for the foreign-born population - Burma (%)
Place of birth for the foreign-born population - Cambodia (%)
Place of birth for the foreign-born population - Indonesia (%)
Place of birth for the foreign-born population - Laos (%)
Place of birth for the foreign-born population - Malaysia (%)
Place of birth for the foreign-born population - Philippines (%)
Place of birth for the foreign-born population - Singapore (%)
Place of birth for the foreign-born population - Thailand (%)
Place of birth for the foreign-born population - Vietnam (%)
Place of birth for the foreign-born population - Other South Eastern Asia (%)
Place of birth for the foreign-born population - Armenia (%)
Place of birth for the foreign-born population - Iraq (%)
Place of birth for the foreign-born population - Israel (%)
Place of birth for the foreign-born population - Jordan (%)
Place of birth for the foreign-born population - Kuwait (%)
Place of birth for the foreign-born population - Lebanon (%)
Place of birth for the foreign-born population - Saudi Arabia (%)
Place of birth for the foreign-born population - Syria (%)
Place of birth for the foreign-born population - Turkey (%)
Place of birth for the foreign-born population - Yemen (%)
Place of birth for the foreign-born population - Other Western Asia (%)
Place of birth for the foreign-born population - Eritrea (%)
Place of birth for the foreign-born population - Ethiopia (%)
Place of birth for the foreign-born population - Kenya (%)
Place of birth for the foreign-born population - Somalia (%)
Place of birth for the foreign-born population - Uganda (%)
Place of birth for the foreign-born population - Zimbabwe (%)
Place of birth for the foreign-born population - Other Eastern Africa (%)
Place of birth for the foreign-born population - Cameroon (%)
Place of birth for the foreign-born population - Congo (%)
Place of birth for the foreign-born population - Democratic Republic of Congo (Zaire) (%)
Place of birth for the foreign-born population - Other Middle Africa (%)
Place of birth for the foreign-born population - Egypt (%)
Place of birth for the foreign-born population - Morocco (%)
Place of birth for the foreign-born population - Sudan (%)
Place of birth for the foreign-born population - Other Northern Africa (%)
Place of birth for the foreign-born population - South Africa (%)
Place of birth for the foreign-born population - Other Southern Africa (%)
Place of birth for the foreign-born population - Cabo Verde (%)
Place of birth for the foreign-born population - Ghana (%)
Place of birth for the foreign-born population - Liberia (%)
Place of birth for the foreign-born population - Nigeria (%)
Place of birth for the foreign-born population - Senegal (%)
Place of birth for the foreign-born population - Sierra Leone (%)
Place of birth for the foreign-born population - Other Western Africa (%)
Place of birth for the foreign-born population - Australia (%)
Place of birth for the foreign-born population - New Zealand (%)
Place of birth for the foreign-born population - Fiji (%)
Place of birth for the foreign-born population - Micronesia (%)
Place of birth for the foreign-born population - Bahamas (%)
Place of birth for the foreign-born population - Barbados (%)
Place of birth for the foreign-born population - Cuba (%)
Place of birth for the foreign-born population - Dominica (%)
Place of birth for the foreign-born population - Dominican Republic (%)
Place of birth for the foreign-born population - Grenada (%)
Place of birth for the foreign-born population - Haiti (%)
Place of birth for the foreign-born population - Jamaica (%)
Place of birth for the foreign-born population - St. Vincent and the Grenadines (%)
Place of birth for the foreign-born population - Trinidad and Tobago (%)
Place of birth for the foreign-born population - West Indies (%)
Place of birth for the foreign-born population - Other Caribbean (%)
Place of birth for the foreign-born population - Belize (%)
Place of birth for the foreign-born population - Costa Rica (%)
Place of birth for the foreign-born population - El Salvador (%)
Place of birth for the foreign-born population - Guatemala (%)
Place of birth for the foreign-born population - Honduras (%)
Place of birth for the foreign-born population - Mexico (%)
Place of birth for the foreign-born population - Nicaragua (%)
Place of birth for the foreign-born population - Panama (%)
Place of birth for the foreign-born population - Other Central America (%)
Place of birth for the foreign-born population - Argentina (%)
Place of birth for the foreign-born population - Bolivia (%)
Place of birth for the foreign-born population - Brazil (%)
Place of birth for the foreign-born population - Chile (%)
Place of birth for the foreign-born population - Colombia (%)
Place of birth for the foreign-born population - Ecuador (%)
Place of birth for the foreign-born population - Guyana (%)
Place of birth for the foreign-born population - Peru (%)
Place of birth for the foreign-born population - Uruguay (%)
Place of birth for the foreign-born population - Venezuela (%)
Place of birth for the foreign-born population - Other South America (%)
Place of birth for the foreign-born population - Canada (%)
Place of birth for the foreign-born population - Other Northern America (%)
Place of birth for the foreign-born population - Other (%)
Latest news about races in Burlington, NJ collected exclusively by city-data.com from local newspapers, TV, and radio stations
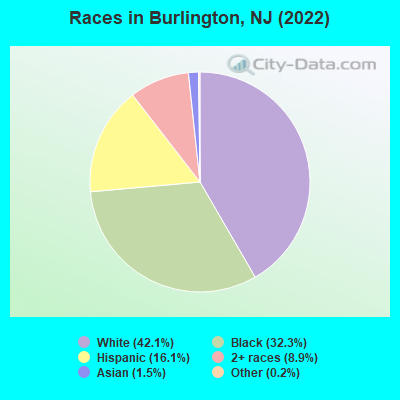
According to 2022 data, the most numerous races in Burlington, NJ are White alone (4,181 residents), Hispanic (1,596 residents), and Black alone (3,201 residents). 85.7% of Burlington residents speak English at home. 11.1% of Burlington, NJ residents are foreign-born (4.2% born in Latin America, 3.2% born in Africa, 2.4% born in Europe), which is 106.5% less than the foreign-born rate of 23.0% across the entire state of New Jersey.
Race distribution in Burlington
2000 2022
5,557,209 66.0% White alone 1,117,191 13.3% Hispanic 1,096,171 13.0% Black alone 477,012 5.7% Asian alone 133,689 1.6% Two or more races 19,565 0.2% Other race alone 11,338 0.1% American Indian alone 2,175 0.03% Native Hawaiian and Other
4,766,476 51.5% White alone 2,028,470 21.9% Hispanic 1,111,632 12.0% Black alone 923,546 10.0% Asian alone 332,237 3.6% Two or more races 89,847 1.0% Other race alone 8,557 0.09% American Indian alone 934 0.01% Native Hawaiian and Other
Income and house value in Burlington Median household income in 2022 $65,575 White non-Hispanic householders$71,239 Black householders$100,897 Asian householders$99,811 Two or more races householders$99,858 Hispanic or Latino race householdersMedian 2022 house value $216,412 White Non-Hispanic householders$182,819 Black or African American householders$242,252 American Indian or Alaska Native householders $403,754 Asian householders$161,501 Some other race householders$285,319 Two or more races householders$211,459 Hispanic or Latino householders
Median age by race in Burlington
46.7 Median age for White residents44.2 48.8 41.4 Median age for Black or African American residents36.6 42.0 -676,272,813.9 Median age for American Indian / Alaska Native residents-670,465,336.5 -688,298,917.7 28.1 Median age for Asian residents27.0 10.8 -866,479,924.4 Median age for Native Hawaiian / Pacific Islander residents-866,479,924.4 -713,070,378.3 17.7 Median age for Other race residents17.4 31.6 18.1 Median age for Two or more races residents22.5 18.0 48.8 Median age for White alone residents46.7 53.3 21.2 Median age for Hispanic or Latino residents17.9 25.3
Owner/renter occupied households by race in Burlington
House owners and renters - White residents 1,629 80.0% Owner occupied407 20.0% Renter occupiedHouse owners and renters - Black or African American residents 517 42.8% Owner occupied691 57.2% Renter occupiedHouse owners and renters - Asian residents 37 62.7% Owner occupied22 37.3% Renter occupiedHouse owners and renters - Other race residents 62 55.6% Owner occupied50 44.4% Renter occupiedHouse owners and renters - Two or more races residents 221 68.2% Owner occupied103 31.8% Renter occupiedHouse owners and renters - White alone residents 1,577 80.7% Owner occupied377 19.3% Renter occupiedHouse owners and renters - Hispanic or Latino residents 239 57.0% Owner occupied180 43.0% Renter occupied
Language usage in Burlington
English speakers - Total 85.7% of residents of Burlington speak English at home.
7.0% of residents speak Spanish at home 581 89.1% Speak English very well71 10.9% Speak English less than very well7.5% of residents speak other language at home 385 55.2% Speak English very well312 44.8% Speak English less than very well
English speakers - Born in the United States 93.5% of residents of Burlington speak English at home.
5.2% of residents speak Spanish at home 141 100.0% Speak English very well1.3% of residents speak other language at home 31 86.1% Speak English very well5 13.9% Speak English less than very well
English speakers - Native, born elsewhere 68.5% of residents of Burlington speak English at home.
45.9% of residents speak Spanish at home 150 96.2% Speak English very well6 3.8% Speak English less than very well0.9% of residents speak other language at home 3 100.0% Speak English very well
English speakers - Foreign-born 44.6% of residents of Burlington speak English at home.
13.4% of residents speak Spanish at home 89 53.6% Speak English very well77 46.4% Speak English less than very well42.5% of residents speak other language at home 224 42.5% Speak English very well303 57.5% Speak English less than very well
White (Caucasian) - Speak only English Native:
94.2% (3,759)Foreign-born:
20.9% (68)
White (Caucasian) - Speak another language Native:
4.5% (179)Foreign-born:
79.9% (259)
Black or African American - Speak only English Native:
98.3% (2,585)Foreign-born:
69.0% (440)
Black or African American - Speak another language Native:
2.1% (55)Foreign-born:
30.7% (196)
Asian - Speak only English Native:
21.8% (18)Foreign-born:
36.2% (28)
Asian - Speak another language Native:
61.2% (52)Foreign-born:
67.7% (52)
Other race - Speak another language Native:
66.7% (255)Foreign-born:
100.0% (10)
Two or more races - Speak only English Native:
93.6% (967)Foreign-born:
6.8% (17)
Two or more races - Speak another language Native:
6.1% (63)Foreign-born:
93.7% (233)
White alone - Speak only English Native:
97.2% (3,651)Foreign-born:
24.9% (59)
White alone - Speak another language Native:
2.4% (90)Foreign-born:
75.5% (179)
Hispanic or Latino - Speak only English Native:
65.7% (704)Foreign-born:
9.4% (18)
Hispanic or Latino - Speak another language Native:
34.6% (371)Foreign-born:
85.0% (161)
Foreign-born residents in Burlington 1,105 residents are foreign born (4.2% Latin America , 3.2% Africa , 2.4% Europe ).
This city:
11.1%New Jersey:
23.2%
Marital status for residents in Burlington Marital status - White (Caucasian) population 15 years and over
Males 41.8% Never married40.5% Now married1.8% Separated1.5% Widowed14.4% DivorcedFemales 29.1% Never married37.6% Now married6.3% Separated14.5% Widowed12.4% DivorcedWomen who gave birth in the past 12 months Now married:
81.0% (32)Unmarried:
19.0% (7)
Women who did not give birth in the past 12 months Now married:
35.8% (305)Unmarried:
64.2% (546)
Marital status - Black or African American population 15 years and over
Males 53.1% Never married32.9% Now married2.2% Separated1.7% Widowed10.1% DivorcedFemales 44.8% Never married27.5% Now married0.6% Separated11.0% Widowed16.1% DivorcedWomen who gave birth in the past 12 months Now married:
0.0% (0)Unmarried:
100.0% (65)
Women who did not give birth in the past 12 months Now married:
28.3% (232)Unmarried:
71.7% (590)
Marital status - Asian population 15 years and over
Males 41.1% Never married53.6% Now married0.0% Separated5.4% Widowed0.0% DivorcedFemales 13.5% Never married40.5% Now married0.0% Separated0.0% Widowed45.9% DivorcedWomen who did not give birth in the past 12 months Now married:
75.0% (16)Unmarried:
25.0% (5)
Marital status - Other race population 15 years and over
Males 36.4% Never married52.9% Now married0.0% Separated6.6% Widowed4.1% DivorcedFemales 81.4% Never married18.6% Now married0.0% Separated0.0% Widowed0.0% DivorcedWomen who did not give birth in the past 12 months Now married:
12.5% (13)Unmarried:
87.5% (88)
Marital status - Two or more races population 15 years and over
Males 48.2% Never married32.6% Now married2.0% Separated2.3% Widowed15.0% DivorcedFemales 56.7% Never married32.0% Now married1.7% Separated2.0% Widowed7.6% DivorcedWomen who gave birth in the past 12 months Now married:
65.0% (52)Unmarried:
35.0% (28)
Women who did not give birth in the past 12 months Now married:
4.8% (13)Unmarried:
95.2% (264)
Marital status - White alone, not Hispanic / Latino population 15 years and over
Males 41.4% Never married40.0% Now married1.9% Separated1.6% Widowed15.1% DivorcedFemales 27.9% Never married36.2% Now married6.8% Separated15.7% Widowed13.4% DivorcedWomen who gave birth in the past 12 months Now married:
81.0% (32)Unmarried:
19.0% (8)
Women who did not give birth in the past 12 months Now married:
32.3% (237)Unmarried:
67.7% (496)
Marital status - Hispanic or Latino population 15 years and over
Males 45.7% Never married43.8% Now married1.7% Separated3.9% Widowed4.9% DivorcedFemales 54.7% Never married32.7% Now married1.3% Separated0.0% Widowed11.3% DivorcedWomen who gave birth in the past 12 months Now married:
65.0% (44)Unmarried:
35.0% (24)
Women who did not give birth in the past 12 months Now married:
24.6% (99)Unmarried:
75.4% (303)
Ancestries in Burlington
261 5.5% Irish256 5.4% Italian196 4.2% American150 3.2% English142 3.0% Polish139 2.9% German117 2.5% Liberian67 1.4% African64 1.4% Jamaican50 1.1% Trinidadian and Tobagonian45 1.0% Romanian33 0.7% Guyanese24 0.5% Turkish19 0.4% Egyptian17 0.4% Greek15 0.3% British West Indian15 0.3% Haitian15 0.3% West Indian14 0.3% Barbadian8 0.2% European8 0.2% Slovak7 0.1% British7 0.1% Finnish5 0.1% Czechoslovakian5 0.1% Dutch5 0.1% Hungarian4 0.08% Lithuanian3 0.06% Austrian3 0.06% Eastern European3 0.06% French3 0.06% French Canadian1 0.02% Russian
Geographical mobility in Burlington Same house 1 year ago 3,592 79.8% White (Caucasian)2,961 87.5% Black or African American127 74.7% Asian455 100.0% Other race1,006 65.7% Two or more races3,366 80.9% White alone, not Hispanic / Latino1,150 76.1% Hispanic or LatinoMoved within same county 273 6.1% White / Caucasian64 1.9% Black or African American22 13.0% Asian165 10.8% Two or more races270 6.5% White alone, not Hispanic / Latino57 3.8% Hispanic or LatinoMoved within same state 409 9.1% White / Caucasian40 1.2% Black or African American7 0.4% Two or more races278 6.7% White alone, not Hispanic / Latino158 10.5% Hispanic or LatinoMoved from different state 198 4.4% White / Caucasian379 11.2% Black or African American228 14.9% Two or more races200 4.8% White alone, not Hispanic / Latino187 12.4% Hispanic or LatinoMoved from abroad 7 0.1% White130 3.8% Black or African American173 11.3% Two or more races6 0.1% White alone, not Hispanic / Latino
Children Nativity (place of birth) in Burlington
Children under 6 years - Living with two parents Both parents native 216 100.0% NativeBoth parents foreign-born 29 100.0% NativeOne native, one foreign-born parent 38 100.0% NativeChildren under 6 years - Living with one parent Native parent 395 100.0% NativeChildren 6 to 17 years - Living with two parents Both parents native 388 99.7% Native1 0.3% Foreign-bornBoth parents foreign-born 95 85.4% Native16 14.6% Foreign-bornOne native, one foreign-born parent 26 100.0% NativeChildren 6 to 17 years - Living with one parent Native parent 701 100.0% NativeForeign-born parent 116 55.5% Native93 44.5% Foreign-born
Grandparents responsible for own grandchildren in Burlington
Grandparents (30 to 59 years) White / Caucasian 33 82.4% Responsible for grandchildren7 17.6% Not responsible for grandchildrenBlack or African American 65 100.0% Not responsible for grandchildrenOther race 38 100.0% Responsible for grandchildrenTwo or more races 14 100.0% Not responsible for grandchildrenWhite alone, not Hispanic / Latino 39 83.3% Responsible for grandchildren8 16.7% Not responsible for grandchildrenHispanic or Latino 31 100.0% Responsible for grandchildrenGrandparents (60 years and over) White / Caucasian 62 34.9% Responsible for grandchildren115 65.1% Not responsible for grandchildrenBlack or African American 36 34.2% Responsible for grandchildren69 65.8% Not responsible for grandchildrenTwo or more races 40 100.0% Not responsible for grandchildrenWhite alone, not Hispanic / Latino 63 35.8% Responsible for grandchildren114 64.2% Not responsible for grandchildren