Races in Burley, Idaho (ID) Detailed Stats
Data:
Races - White alone (%)
Races - White alone (% change since 2000)
Races - Black alone (%)
Races - Black alone (% change since 2000)
Races - American Indian alone (%)
Races - American Indian alone (% change since 2000)
Races - Asian alone (%)
Races - Asian alone (% change since 2000)
Races - Hispanic (%)
Races - Hispanic (% change since 2000)
Races - Native Hawaiian and Other Pacific Islander alone (%)
Races - Native Hawaiian and Other Pacific Islander alone (% change since 2000)
Races - Two or more races(%)
Races - Two or more races(% change since 2000)
Races - Other race alone (%)
Races - Other race alone (% change since 2000)
Racial diversity
Place of birth - Born in state of residence (%)
Place of birth - Born in state of residence (%) - White
Place of birth - Born in state of residence (%) - Black or African American
Place of birth - Born in state of residence (%) - Asian
Place of birth - Born in state of residence (%) - Hispanic or Latino
Place of birth - Born in state of residence (%) - American Indian and Alaska Native
Place of birth - Born in state of residence (%) - Multirace
Place of birth - Born in state of residence (%) - Other Race
Place of birth - Born in other state (%)
Place of birth - Born in other state (%) - White
Place of birth - Born in other state (%) - Black or African American
Place of birth - Born in other state (%) - Asian
Place of birth - Born in other state (%) - Hispanic or Latino
Place of birth - Born in other state (%) - American Indian and Alaska Native
Place of birth - Born in other state (%) - Multirace
Place of birth - Born in other state (%) - Other Race
Place of birth - Native, outside of US (%)
Place of birth - Native, outside of US (%) - White
Place of birth - Native, outside of US (%) - Black or African American
Place of birth - Native, outside of US (%) - Asian
Place of birth - Native, outside of US (%) - Hispanic or Latino
Place of birth - Native, outside of US (%) - American Indian and Alaska Native
Place of birth - Native, outside of US (%) - Multirace
Place of birth - Native, outside of US (%) - Other Race
Place of birth - Foreign born (%)
Place of birth - Foreign born (%) - White
Place of birth - Foreign born (%) - Black or African American
Place of birth - Foreign born (%) - Asian
Place of birth - Foreign born (%) - Hispanic or Latino
Place of birth - Foreign born (%) - American Indian and Alaska Native
Place of birth - Foreign born (%) - Multirace
Place of birth - Foreign born (%) - Other Race
Residents speaking English at home (%)
Residents speaking English at home - Born in the United States (%)
Residents speaking English at home - Native, born elsewhere (%)
Residents speaking English at home - Foreign born (%)
Residents speaking Spanish at home (%)
Residents speaking Spanish at home - Born in the United States (%)
Residents speaking Spanish at home - Native, born elsewhere (%)
Residents speaking Spanish at home - Foreign born (%)
Residents speaking other language at home (%)
Residents speaking other language at home - Born in the United States (%)
Residents speaking other language at home - Native, born elsewhere (%)
Residents speaking other language at home - Foreign born (%)
Marital status - Never married (%)
Marital status - Now married (%)
Marital status - Separated (%)
Marital status - Widowed (%)
Marital status - Divorced (%)
Ancestries Reported - Arab (%)
Ancestries Reported - Czech (%)
Ancestries Reported - Danish (%)
Ancestries Reported - Dutch (%)
Ancestries Reported - English (%)
Ancestries Reported - French (%)
Ancestries Reported - French Canadian (%)
Ancestries Reported - German (%)
Ancestries Reported - Greek (%)
Ancestries Reported - Hungarian (%)
Ancestries Reported - Irish (%)
Ancestries Reported - Italian (%)
Ancestries Reported - Lithuanian (%)
Ancestries Reported - Norwegian (%)
Ancestries Reported - Polish (%)
Ancestries Reported - Portuguese (%)
Ancestries Reported - Russian (%)
Ancestries Reported - Scotch-Irish (%)
Ancestries Reported - Scottish (%)
Ancestries Reported - Slovak (%)
Ancestries Reported - Subsaharan African (%)
Ancestries Reported - Swedish (%)
Ancestries Reported - Swiss (%)
Ancestries Reported - Ukrainian (%)
Ancestries Reported - United States (%)
Ancestries Reported - Welsh (%)
Ancestries Reported - West Indian (%)
Ancestries Reported - Other (%)
Geographical mobility - Same house 1 year ago (%)
Geographical mobility - Same house 1 year ago (%) - White
Geographical mobility - Same house 1 year ago (%) - Black or African American
Geographical mobility - Same house 1 year ago (%) - Asian
Geographical mobility - Same house 1 year ago (%) - Hispanic or Latino
Geographical mobility - Same house 1 year ago (%) - American Indian and Alaska Native
Geographical mobility - Same house 1 year ago (%) - Multirace
Geographical mobility - Same house 1 year ago (%) - Other Race
Geographical mobility - Moved within same county (%)
Geographical mobility - Moved within same county (%) - White
Geographical mobility - Moved within same county (%) - Black or African American
Geographical mobility - Moved within same county (%) - Asian
Geographical mobility - Moved within same county (%) - Hispanic or Latino
Geographical mobility - Moved within same county (%) - American Indian and Alaska Native
Geographical mobility - Moved within same county (%) - Multirace
Geographical mobility - Moved within same county (%) - Other Race
Geographical mobility - Moved from different county within same state (%)
Geographical mobility - Moved from different county within same state (%) - White
Geographical mobility - Moved from different county within same state (%) - Black or African American
Geographical mobility - Moved from different county within same state (%) - Asian
Geographical mobility - Moved from different county within same state (%) - Hispanic or Latino
Geographical mobility - Moved from different county within same state (%) - American Indian and Alaska Native
Geographical mobility - Moved from different county within same state (%) - Multirace
Geographical mobility - Moved from different county within same state (%) - Other Race
Geographical mobility - Moved from different state (%)
Geographical mobility - Moved from different state (%) - White
Geographical mobility - Moved from different state (%) - Black or African American
Geographical mobility - Moved from different state (%) - Asian
Geographical mobility - Moved from different state (%) - Hispanic or Latino
Geographical mobility - Moved from different state (%) - American Indian and Alaska Native
Geographical mobility - Moved from different state (%) - Multirace
Geographical mobility - Moved from different state (%) - Other Race
Geographical mobility - Moved from abroad (%)
Geographical mobility - Moved from abroad (%) - White
Geographical mobility - Moved from abroad (%) - Black or African American
Geographical mobility - Moved from abroad (%) - Asian
Geographical mobility - Moved from abroad (%) - Hispanic or Latino
Geographical mobility - Moved from abroad (%) - American Indian and Alaska Native
Geographical mobility - Moved from abroad (%) - Multirace
Geographical mobility - Moved from abroad (%) - Other Race
Place of birth for the foreign-born population - Ireland (%)
Place of birth for the foreign-born population - Denmark (%)
Place of birth for the foreign-born population - Norway (%)
Place of birth for the foreign-born population - Sweden (%)
Place of birth for the foreign-born population - United Kingdom (%)
Place of birth for the foreign-born population - England (%)
Place of birth for the foreign-born population - Scotland (%)
Place of birth for the foreign-born population - Other Northern Europe (%)
Place of birth for the foreign-born population - Austria (%)
Place of birth for the foreign-born population - Belgium (%)
Place of birth for the foreign-born population - France (%)
Place of birth for the foreign-born population - Germany (%)
Place of birth for the foreign-born population - Netherlands (%)
Place of birth for the foreign-born population - Switzerland (%)
Place of birth for the foreign-born population - Other Western Europe (%)
Place of birth for the foreign-born population - Greece (%)
Place of birth for the foreign-born population - Italy (%)
Place of birth for the foreign-born population - Portugal (%)
Place of birth for the foreign-born population - Spain (%)
Place of birth for the foreign-born population - Other Southern Europe (%)
Place of birth for the foreign-born population - Albania (%)
Place of birth for the foreign-born population - Belarus (%)
Place of birth for the foreign-born population - Bosnia and Herzegovina (%)
Place of birth for the foreign-born population - Bulgaria (%)
Place of birth for the foreign-born population - Croatia (%)
Place of birth for the foreign-born population - Czechoslovakia (%)
Place of birth for the foreign-born population - Hungary (%)
Place of birth for the foreign-born population - Latvia (%)
Place of birth for the foreign-born population - Lithuania (%)
Place of birth for the foreign-born population - North Macedonia (Macedonia) (%)
Place of birth for the foreign-born population - Moldova (%)
Place of birth for the foreign-born population - Poland (%)
Place of birth for the foreign-born population - Romania (%)
Place of birth for the foreign-born population - Russia (%)
Place of birth for the foreign-born population - Serbia (%)
Place of birth for the foreign-born population - Ukraine (%)
Place of birth for the foreign-born population - Other Eastern Europe (%)
Place of birth for the foreign-born population - China (%)
Place of birth for the foreign-born population - Hong Kong (%)
Place of birth for the foreign-born population - Taiwan (%)
Place of birth for the foreign-born population - Japan (%)
Place of birth for the foreign-born population - Korea (%)
Place of birth for the foreign-born population - Other Eastern Asia (%)
Place of birth for the foreign-born population - Afghanistan (%)
Place of birth for the foreign-born population - Bangladesh (%)
Place of birth for the foreign-born population - India (%)
Place of birth for the foreign-born population - Iran (%)
Place of birth for the foreign-born population - Kazakhstan (%)
Place of birth for the foreign-born population - Nepal (%)
Place of birth for the foreign-born population - Pakistan (%)
Place of birth for the foreign-born population - Sri Lanka (%)
Place of birth for the foreign-born population - Uzbekistan (%)
Place of birth for the foreign-born population - Other South Central Asia (%)
Place of birth for the foreign-born population - Burma (%)
Place of birth for the foreign-born population - Cambodia (%)
Place of birth for the foreign-born population - Indonesia (%)
Place of birth for the foreign-born population - Laos (%)
Place of birth for the foreign-born population - Malaysia (%)
Place of birth for the foreign-born population - Philippines (%)
Place of birth for the foreign-born population - Singapore (%)
Place of birth for the foreign-born population - Thailand (%)
Place of birth for the foreign-born population - Vietnam (%)
Place of birth for the foreign-born population - Other South Eastern Asia (%)
Place of birth for the foreign-born population - Armenia (%)
Place of birth for the foreign-born population - Iraq (%)
Place of birth for the foreign-born population - Israel (%)
Place of birth for the foreign-born population - Jordan (%)
Place of birth for the foreign-born population - Kuwait (%)
Place of birth for the foreign-born population - Lebanon (%)
Place of birth for the foreign-born population - Saudi Arabia (%)
Place of birth for the foreign-born population - Syria (%)
Place of birth for the foreign-born population - Turkey (%)
Place of birth for the foreign-born population - Yemen (%)
Place of birth for the foreign-born population - Other Western Asia (%)
Place of birth for the foreign-born population - Eritrea (%)
Place of birth for the foreign-born population - Ethiopia (%)
Place of birth for the foreign-born population - Kenya (%)
Place of birth for the foreign-born population - Somalia (%)
Place of birth for the foreign-born population - Uganda (%)
Place of birth for the foreign-born population - Zimbabwe (%)
Place of birth for the foreign-born population - Other Eastern Africa (%)
Place of birth for the foreign-born population - Cameroon (%)
Place of birth for the foreign-born population - Congo (%)
Place of birth for the foreign-born population - Democratic Republic of Congo (Zaire) (%)
Place of birth for the foreign-born population - Other Middle Africa (%)
Place of birth for the foreign-born population - Egypt (%)
Place of birth for the foreign-born population - Morocco (%)
Place of birth for the foreign-born population - Sudan (%)
Place of birth for the foreign-born population - Other Northern Africa (%)
Place of birth for the foreign-born population - South Africa (%)
Place of birth for the foreign-born population - Other Southern Africa (%)
Place of birth for the foreign-born population - Cabo Verde (%)
Place of birth for the foreign-born population - Ghana (%)
Place of birth for the foreign-born population - Liberia (%)
Place of birth for the foreign-born population - Nigeria (%)
Place of birth for the foreign-born population - Senegal (%)
Place of birth for the foreign-born population - Sierra Leone (%)
Place of birth for the foreign-born population - Other Western Africa (%)
Place of birth for the foreign-born population - Australia (%)
Place of birth for the foreign-born population - New Zealand (%)
Place of birth for the foreign-born population - Fiji (%)
Place of birth for the foreign-born population - Micronesia (%)
Place of birth for the foreign-born population - Bahamas (%)
Place of birth for the foreign-born population - Barbados (%)
Place of birth for the foreign-born population - Cuba (%)
Place of birth for the foreign-born population - Dominica (%)
Place of birth for the foreign-born population - Dominican Republic (%)
Place of birth for the foreign-born population - Grenada (%)
Place of birth for the foreign-born population - Haiti (%)
Place of birth for the foreign-born population - Jamaica (%)
Place of birth for the foreign-born population - St. Vincent and the Grenadines (%)
Place of birth for the foreign-born population - Trinidad and Tobago (%)
Place of birth for the foreign-born population - West Indies (%)
Place of birth for the foreign-born population - Other Caribbean (%)
Place of birth for the foreign-born population - Belize (%)
Place of birth for the foreign-born population - Costa Rica (%)
Place of birth for the foreign-born population - El Salvador (%)
Place of birth for the foreign-born population - Guatemala (%)
Place of birth for the foreign-born population - Honduras (%)
Place of birth for the foreign-born population - Mexico (%)
Place of birth for the foreign-born population - Nicaragua (%)
Place of birth for the foreign-born population - Panama (%)
Place of birth for the foreign-born population - Other Central America (%)
Place of birth for the foreign-born population - Argentina (%)
Place of birth for the foreign-born population - Bolivia (%)
Place of birth for the foreign-born population - Brazil (%)
Place of birth for the foreign-born population - Chile (%)
Place of birth for the foreign-born population - Colombia (%)
Place of birth for the foreign-born population - Ecuador (%)
Place of birth for the foreign-born population - Guyana (%)
Place of birth for the foreign-born population - Peru (%)
Place of birth for the foreign-born population - Uruguay (%)
Place of birth for the foreign-born population - Venezuela (%)
Place of birth for the foreign-born population - Other South America (%)
Place of birth for the foreign-born population - Canada (%)
Place of birth for the foreign-born population - Other Northern America (%)
Place of birth for the foreign-born population - Other (%)
Latest news about races in Burley, ID collected exclusively by city-data.com from local newspapers, TV, and radio stations
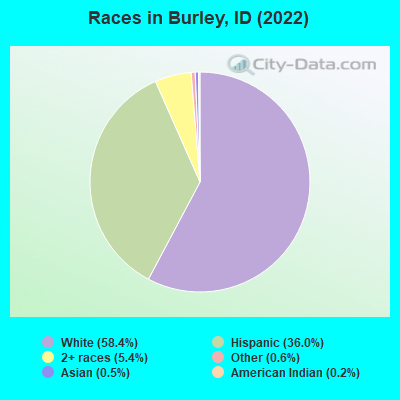
According to 2022 data, the most numerous races in Burley, ID are White alone (7,024 residents), Hispanic (4,327 residents), and Two or more races (650 residents). 75.4% of Burley residents speak English at home. 10.8% of Burley, ID residents are foreign-born (9.1% born in Latin America, 1.2% born in Europe), which is 53.9% greater than the foreign-born rate of 5.0% across the entire state of Idaho.
Race distribution in Burley
2000 2022
1,139,291 88.0% White alone 101,690 7.9% Hispanic 18,261 1.4% Two or more races 15,789 1.2% American Indian alone 11,641 0.9% Asian alone 4,889 0.4% Black alone 1,192 0.09% Other race alone 1,200 0.09% Native Hawaiian and Other
1,531,219 79.0% White alone 261,921 13.5% Hispanic 81,112 4.2% Two or more races 25,174 1.3% Asian alone 15,825 0.8% American Indian alone 11,868 0.6% Black alone 8,752 0.5% Other race alone 3,162 0.2% Native Hawaiian and Other
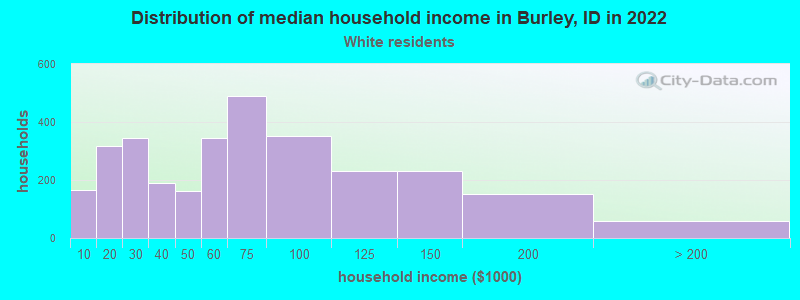
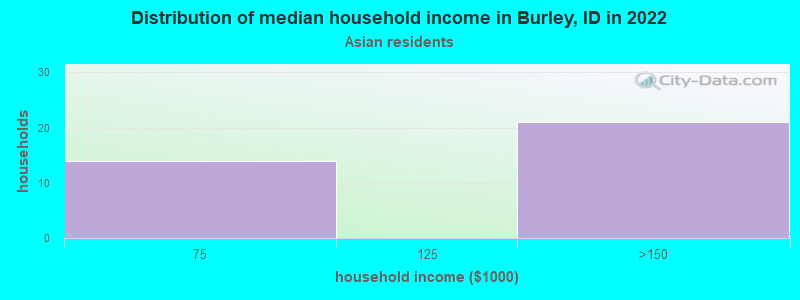
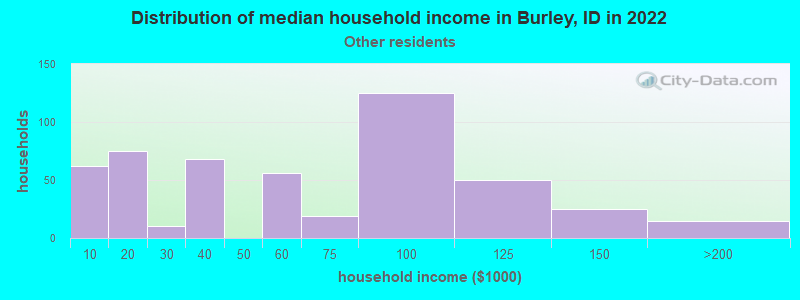
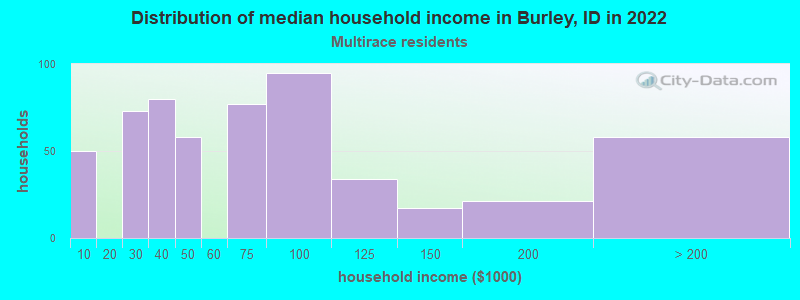
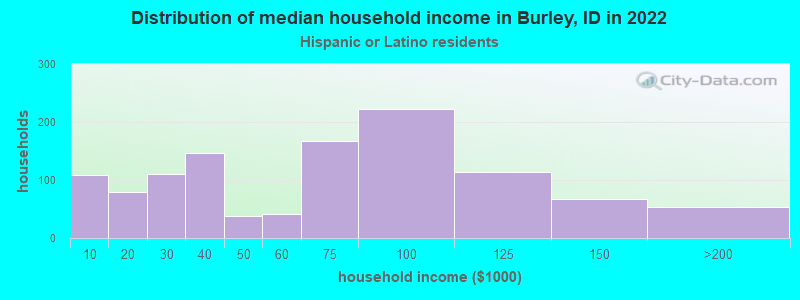
Income and house value in Burley Median household income in 2022 $60,128 White non-Hispanic householders$31,016 American Indian and Alaska Native householders$40,233 Some other race householders$69,314 Two or more races householders$62,231 Hispanic or Latino race householdersMedian 2022 house value $242,669 White Non-Hispanic householders$258,847 American Indian or Alaska Native householders $286,673 Asian householders$184,752 Some other race householders$293,467 Two or more races householders$197,694 Hispanic or Latino householders
Median age by race in Burley
31.4 Median age for White residents29.5 36.5 -774,193,547.6 Median age for Black or African American residents-680,851,063.1 -869,696,968.8 54.7 Median age for American Indian / Alaska Native residents54.8 59.6 49.8 Median age for Asian residents45.4 -642,796,248.3 -393,939,393.5 Median age for Native Hawaiian / Pacific Islander residents-355,119,825.4 -679,245,282.3 31.1 Median age for Other race residents32.1 31.6 27.8 Median age for Two or more races residents26.0 27.6 36.4 Median age for White alone residents30.5 38.7 26.2 Median age for Hispanic or Latino residents26.3 25.4
Owner/renter occupied households by race in Burley
House owners and renters - White residents 1,965 64.1% Owner occupied1,102 35.9% Renter occupiedHouse owners and renters - American Indian / Alaska Native residents 36 62.2% Owner occupied22 37.8% Renter occupiedHouse owners and renters - Asian residents 16 54.2% Owner occupied13 45.8% Renter occupiedHouse owners and renters - Other race residents 248 45.9% Owner occupied293 54.1% Renter occupiedHouse owners and renters - Two or more races residents 331 59.6% Owner occupied224 40.4% Renter occupiedHouse owners and renters - White alone residents 1,767 65.9% Owner occupied914 34.1% Renter occupiedHouse owners and renters - Hispanic or Latino residents 659 53.5% Owner occupied574 46.5% Renter occupied
Language usage in Burley
English speakers - Total 75.4% of residents of Burley speak English at home.
21.9% of residents speak Spanish at home 1,480 60.7% Speak English very well958 39.3% Speak English less than very well2.7% of residents speak other language at home 247 81.8% Speak English very well55 18.2% Speak English less than very well
English speakers - Born in the United States 81.3% of residents of Burley speak English at home.
17.6% of residents speak Spanish at home 381 58.7% Speak English very well268 41.3% Speak English less than very well2.6% of residents speak other language at home 85 87.6% Speak English very well12 12.4% Speak English less than very well
English speakers - Native, born elsewhere 60.8% of residents of Burley speak English at home.
47.7% of residents speak Spanish at home 62 100.0% Speak English very well
English speakers - Foreign-born 16.7% of residents of Burley speak English at home.
73.9% of residents speak Spanish at home 367 37.5% Speak English very well612 62.5% Speak English less than very well4.8% of residents speak other language at home 36 57.1% Speak English very well27 42.9% Speak English less than very well
White (Caucasian) - Speak only English Native:
90.0% (6,889)Foreign-born:
55.9% (131)
White (Caucasian) - Speak another language Native:
8.6% (657)Foreign-born:
42.5% (100)
Asian - Speak only English Native:
100.0% (22)Foreign-born:
76.2% (33)
Asian - Speak another language Native:
3.7% (1)Foreign-born:
32.8% (14)
Other race - Speak only English Native:
48.2% (419)Foreign-born:
3.0% (17)
Other race - Speak another language Native:
51.8% (450)Foreign-born:
96.4% (564)
Two or more races - Speak only English Native:
61.5% (894)Foreign-born:
6.3% (33)
Two or more races - Speak another language Native:
42.6% (619)Foreign-born:
92.6% (485)
White alone - Speak only English Native:
96.4% (6,158)Foreign-born:
62.2% (89)
White alone - Speak another language Native:
3.6% (228)Foreign-born:
22.4% (32)
Hispanic or Latino - Speak only English Native:
56.3% (1,599)Foreign-born:
9.9% (108)
Hispanic or Latino - Speak another language Native:
43.7% (1,242)Foreign-born:
90.2% (990)
Foreign-born residents in Burley 1,305 residents are foreign born (9.1% Latin America , 1.2% Europe ).
This city:
10.8%Idaho:
5.7%
Marital status for residents in Burley Marital status - White (Caucasian) population 15 years and over
Males 33.3% Never married52.8% Now married0.6% Separated2.1% Widowed11.1% DivorcedFemales 19.6% Never married57.2% Now married1.4% Separated9.8% Widowed12.0% DivorcedWomen who gave birth in the past 12 months Now married:
63.2% (153)Unmarried:
36.8% (89)
Women who did not give birth in the past 12 months Now married:
57.6% (843)Unmarried:
42.4% (621)
Marital status - American Indian / Alaska Native population 15 years and over
Males 16.7% Never married73.3% Now married0.0% Separated0.0% Widowed10.0% DivorcedFemales 0.0% Never married50.7% Now married0.0% Separated0.0% Widowed49.3% DivorcedWomen who did not give birth in the past 12 months Now married:
100.0% (24)Unmarried:
0.0% (0)
Marital status - Asian population 15 years and over
Males 48.3% Never married48.3% Now married0.0% Separated3.4% Widowed0.0% DivorcedFemales 0.0% Never married100.0% Now married0.0% Separated0.0% Widowed0.0% DivorcedWomen who did not give birth in the past 12 months Now married:
100.0% (14)Unmarried:
0.0% (0)
Marital status - Other race population 15 years and over
Males 30.5% Never married61.3% Now married3.7% Separated0.0% Widowed4.5% DivorcedFemales 42.6% Never married38.9% Now married0.0% Separated5.7% Widowed12.8% DivorcedWomen who gave birth in the past 12 months Now married:
42.1% (9)Unmarried:
57.9% (12)
Women who did not give birth in the past 12 months Now married:
37.3% (150)Unmarried:
62.7% (252)
Marital status - Two or more races population 15 years and over
Males 49.1% Never married29.7% Now married4.5% Separated1.3% Widowed15.4% DivorcedFemales 66.6% Never married23.6% Now married0.0% Separated3.3% Widowed6.6% DivorcedWomen who gave birth in the past 12 months Now married:
0.0% (0)Unmarried:
100.0% (40)
Women who did not give birth in the past 12 months Now married:
5.8% (27)Unmarried:
94.2% (436)
Marital status - White alone, not Hispanic / Latino population 15 years and over
Males 32.2% Never married52.6% Now married0.4% Separated2.5% Widowed12.3% DivorcedFemales 12.7% Never married59.7% Now married1.2% Separated12.2% Widowed14.2% DivorcedWomen who gave birth in the past 12 months Now married:
69.6% (132)Unmarried:
30.4% (58)
Women who did not give birth in the past 12 months Now married:
64.4% (689)Unmarried:
35.6% (381)
Marital status - Hispanic or Latino population 15 years and over
Males 38.3% Never married54.6% Now married4.1% Separated0.0% Widowed3.0% DivorcedFemales 45.4% Never married42.2% Now married1.0% Separated2.1% Widowed9.5% DivorcedWomen who gave birth in the past 12 months Now married:
29.8% (33)Unmarried:
70.2% (77)
Women who did not give birth in the past 12 months Now married:
34.8% (345)Unmarried:
65.2% (647)
Ancestries in Burley
917 15.4% American784 13.2% English353 5.9% German251 4.2% European69 1.2% Irish61 1.0% Polish47 0.8% Danish44 0.7% Scottish39 0.7% Norwegian36 0.6% Swedish25 0.4% Welsh18 0.3% Czech14 0.2% Dutch13 0.2% Finnish12 0.2% Northern European11 0.2% British10 0.2% French Canadian8 0.1% Italian5 0.08% Canadian
Geographical mobility in Burley Same house 1 year ago 6,940 82.2% White (Caucasian)7 97.6% Black or African American109 100.0% American Indian / Alaska Native65 98.7% Asian4 100.0% Native Hawaiian / Pacific Islander1,235 80.4% Other race1,644 80.0% Two or more races5,517 79.8% White alone, not Hispanic / Latino3,632 85.0% Hispanic or LatinoMoved within same county 555 6.6% White / Caucasian22 1.4% Other race159 7.7% Two or more races545 7.9% White alone, not Hispanic / Latino126 3.0% Hispanic or LatinoMoved within same state 513 6.1% White / Caucasian4 3.2% American Indian / Alaska Native277 18.0% Other race261 12.7% Two or more races491 7.1% White alone, not Hispanic / Latino476 11.1% Hispanic or LatinoMoved from different state 394 4.7% White / Caucasian3 2.9% American Indian / Alaska Native1 1.9% Asian5 0.3% Other race30 1.5% Two or more races310 4.5% White alone, not Hispanic / Latino93 2.2% Hispanic or LatinoMoved from abroad 27 0.3% White30 1.9% Other race29 0.4% White alone, not Hispanic / Latino21 0.5% Hispanic or Latino
Children Nativity (place of birth) in Burley
Children under 6 years - Living with two parents Both parents native 645 100.0% NativeBoth parents foreign-born 13 51.5% Native13 48.5% Foreign-bornChildren under 6 years - Living with one parent Native parent 187 100.0% NativeForeign-born parent 150 69.2% Native67 30.8% Foreign-bornChildren 6 to 17 years - Living with two parents Both parents native 1,490 100.0% NativeBoth parents foreign-born 50 100.0% NativeOne native, one foreign-born parent 199 100.0% NativeChildren 6 to 17 years - Living with one parent Native parent 459 97.7% Native11 2.3% Foreign-bornForeign-born parent 62 68.3% Native29 31.7% Foreign-born
Grandparents responsible for own grandchildren in Burley
Grandparents (30 to 59 years) White / Caucasian 38 52.9% Responsible for grandchildren34 47.1% Not responsible for grandchildrenOther race 42 80.4% Responsible for grandchildren10 19.6% Not responsible for grandchildrenTwo or more races 15 100.0% Not responsible for grandchildrenWhite alone, not Hispanic / Latino 41 54.6% Responsible for grandchildren34 45.4% Not responsible for grandchildrenHispanic or Latino 42 66.9% Responsible for grandchildren21 33.1% Not responsible for grandchildrenGrandparents (60 years and over) White / Caucasian 37 73.0% Responsible for grandchildren14 27.0% Not responsible for grandchildrenTwo or more races 18 100.0% Not responsible for grandchildrenWhite alone, not Hispanic / Latino 17 54.5% Responsible for grandchildren14 45.5% Not responsible for grandchildrenHispanic or Latino 30 100.0% Responsible for grandchildren