Races in Buckhall, Virginia (VA) Detailed Stats
Data:
Races - White alone (%)
Races - White alone (% change since 2000)
Races - Black alone (%)
Races - Black alone (% change since 2000)
Races - American Indian alone (%)
Races - American Indian alone (% change since 2000)
Races - Asian alone (%)
Races - Asian alone (% change since 2000)
Races - Hispanic (%)
Races - Hispanic (% change since 2000)
Races - Native Hawaiian and Other Pacific Islander alone (%)
Races - Native Hawaiian and Other Pacific Islander alone (% change since 2000)
Races - Two or more races(%)
Races - Two or more races(% change since 2000)
Races - Other race alone (%)
Races - Other race alone (% change since 2000)
Racial diversity
Place of birth - Born in state of residence (%)
Place of birth - Born in state of residence (%) - White
Place of birth - Born in state of residence (%) - Black or African American
Place of birth - Born in state of residence (%) - Asian
Place of birth - Born in state of residence (%) - Hispanic or Latino
Place of birth - Born in state of residence (%) - American Indian and Alaska Native
Place of birth - Born in state of residence (%) - Multirace
Place of birth - Born in state of residence (%) - Other Race
Place of birth - Born in other state (%)
Place of birth - Born in other state (%) - White
Place of birth - Born in other state (%) - Black or African American
Place of birth - Born in other state (%) - Asian
Place of birth - Born in other state (%) - Hispanic or Latino
Place of birth - Born in other state (%) - American Indian and Alaska Native
Place of birth - Born in other state (%) - Multirace
Place of birth - Born in other state (%) - Other Race
Place of birth - Native, outside of US (%)
Place of birth - Native, outside of US (%) - White
Place of birth - Native, outside of US (%) - Black or African American
Place of birth - Native, outside of US (%) - Asian
Place of birth - Native, outside of US (%) - Hispanic or Latino
Place of birth - Native, outside of US (%) - American Indian and Alaska Native
Place of birth - Native, outside of US (%) - Multirace
Place of birth - Native, outside of US (%) - Other Race
Place of birth - Foreign born (%)
Place of birth - Foreign born (%) - White
Place of birth - Foreign born (%) - Black or African American
Place of birth - Foreign born (%) - Asian
Place of birth - Foreign born (%) - Hispanic or Latino
Place of birth - Foreign born (%) - American Indian and Alaska Native
Place of birth - Foreign born (%) - Multirace
Place of birth - Foreign born (%) - Other Race
Residents speaking English at home (%)
Residents speaking English at home - Born in the United States (%)
Residents speaking English at home - Native, born elsewhere (%)
Residents speaking English at home - Foreign born (%)
Residents speaking Spanish at home (%)
Residents speaking Spanish at home - Born in the United States (%)
Residents speaking Spanish at home - Native, born elsewhere (%)
Residents speaking Spanish at home - Foreign born (%)
Residents speaking other language at home (%)
Residents speaking other language at home - Born in the United States (%)
Residents speaking other language at home - Native, born elsewhere (%)
Residents speaking other language at home - Foreign born (%)
Marital status - Never married (%)
Marital status - Now married (%)
Marital status - Separated (%)
Marital status - Widowed (%)
Marital status - Divorced (%)
Ancestries Reported - Arab (%)
Ancestries Reported - Czech (%)
Ancestries Reported - Danish (%)
Ancestries Reported - Dutch (%)
Ancestries Reported - English (%)
Ancestries Reported - French (%)
Ancestries Reported - French Canadian (%)
Ancestries Reported - German (%)
Ancestries Reported - Greek (%)
Ancestries Reported - Hungarian (%)
Ancestries Reported - Irish (%)
Ancestries Reported - Italian (%)
Ancestries Reported - Lithuanian (%)
Ancestries Reported - Norwegian (%)
Ancestries Reported - Polish (%)
Ancestries Reported - Portuguese (%)
Ancestries Reported - Russian (%)
Ancestries Reported - Scotch-Irish (%)
Ancestries Reported - Scottish (%)
Ancestries Reported - Slovak (%)
Ancestries Reported - Subsaharan African (%)
Ancestries Reported - Swedish (%)
Ancestries Reported - Swiss (%)
Ancestries Reported - Ukrainian (%)
Ancestries Reported - United States (%)
Ancestries Reported - Welsh (%)
Ancestries Reported - West Indian (%)
Ancestries Reported - Other (%)
Geographical mobility - Same house 1 year ago (%)
Geographical mobility - Same house 1 year ago (%) - White
Geographical mobility - Same house 1 year ago (%) - Black or African American
Geographical mobility - Same house 1 year ago (%) - Asian
Geographical mobility - Same house 1 year ago (%) - Hispanic or Latino
Geographical mobility - Same house 1 year ago (%) - American Indian and Alaska Native
Geographical mobility - Same house 1 year ago (%) - Multirace
Geographical mobility - Same house 1 year ago (%) - Other Race
Geographical mobility - Moved within same county (%)
Geographical mobility - Moved within same county (%) - White
Geographical mobility - Moved within same county (%) - Black or African American
Geographical mobility - Moved within same county (%) - Asian
Geographical mobility - Moved within same county (%) - Hispanic or Latino
Geographical mobility - Moved within same county (%) - American Indian and Alaska Native
Geographical mobility - Moved within same county (%) - Multirace
Geographical mobility - Moved within same county (%) - Other Race
Geographical mobility - Moved from different county within same state (%)
Geographical mobility - Moved from different county within same state (%) - White
Geographical mobility - Moved from different county within same state (%) - Black or African American
Geographical mobility - Moved from different county within same state (%) - Asian
Geographical mobility - Moved from different county within same state (%) - Hispanic or Latino
Geographical mobility - Moved from different county within same state (%) - American Indian and Alaska Native
Geographical mobility - Moved from different county within same state (%) - Multirace
Geographical mobility - Moved from different county within same state (%) - Other Race
Geographical mobility - Moved from different state (%)
Geographical mobility - Moved from different state (%) - White
Geographical mobility - Moved from different state (%) - Black or African American
Geographical mobility - Moved from different state (%) - Asian
Geographical mobility - Moved from different state (%) - Hispanic or Latino
Geographical mobility - Moved from different state (%) - American Indian and Alaska Native
Geographical mobility - Moved from different state (%) - Multirace
Geographical mobility - Moved from different state (%) - Other Race
Geographical mobility - Moved from abroad (%)
Geographical mobility - Moved from abroad (%) - White
Geographical mobility - Moved from abroad (%) - Black or African American
Geographical mobility - Moved from abroad (%) - Asian
Geographical mobility - Moved from abroad (%) - Hispanic or Latino
Geographical mobility - Moved from abroad (%) - American Indian and Alaska Native
Geographical mobility - Moved from abroad (%) - Multirace
Geographical mobility - Moved from abroad (%) - Other Race
Place of birth for the foreign-born population - Ireland (%)
Place of birth for the foreign-born population - Denmark (%)
Place of birth for the foreign-born population - Norway (%)
Place of birth for the foreign-born population - Sweden (%)
Place of birth for the foreign-born population - United Kingdom (%)
Place of birth for the foreign-born population - England (%)
Place of birth for the foreign-born population - Scotland (%)
Place of birth for the foreign-born population - Other Northern Europe (%)
Place of birth for the foreign-born population - Austria (%)
Place of birth for the foreign-born population - Belgium (%)
Place of birth for the foreign-born population - France (%)
Place of birth for the foreign-born population - Germany (%)
Place of birth for the foreign-born population - Netherlands (%)
Place of birth for the foreign-born population - Switzerland (%)
Place of birth for the foreign-born population - Other Western Europe (%)
Place of birth for the foreign-born population - Greece (%)
Place of birth for the foreign-born population - Italy (%)
Place of birth for the foreign-born population - Portugal (%)
Place of birth for the foreign-born population - Spain (%)
Place of birth for the foreign-born population - Other Southern Europe (%)
Place of birth for the foreign-born population - Albania (%)
Place of birth for the foreign-born population - Belarus (%)
Place of birth for the foreign-born population - Bosnia and Herzegovina (%)
Place of birth for the foreign-born population - Bulgaria (%)
Place of birth for the foreign-born population - Croatia (%)
Place of birth for the foreign-born population - Czechoslovakia (%)
Place of birth for the foreign-born population - Hungary (%)
Place of birth for the foreign-born population - Latvia (%)
Place of birth for the foreign-born population - Lithuania (%)
Place of birth for the foreign-born population - North Macedonia (Macedonia) (%)
Place of birth for the foreign-born population - Moldova (%)
Place of birth for the foreign-born population - Poland (%)
Place of birth for the foreign-born population - Romania (%)
Place of birth for the foreign-born population - Russia (%)
Place of birth for the foreign-born population - Serbia (%)
Place of birth for the foreign-born population - Ukraine (%)
Place of birth for the foreign-born population - Other Eastern Europe (%)
Place of birth for the foreign-born population - China (%)
Place of birth for the foreign-born population - Hong Kong (%)
Place of birth for the foreign-born population - Taiwan (%)
Place of birth for the foreign-born population - Japan (%)
Place of birth for the foreign-born population - Korea (%)
Place of birth for the foreign-born population - Other Eastern Asia (%)
Place of birth for the foreign-born population - Afghanistan (%)
Place of birth for the foreign-born population - Bangladesh (%)
Place of birth for the foreign-born population - India (%)
Place of birth for the foreign-born population - Iran (%)
Place of birth for the foreign-born population - Kazakhstan (%)
Place of birth for the foreign-born population - Nepal (%)
Place of birth for the foreign-born population - Pakistan (%)
Place of birth for the foreign-born population - Sri Lanka (%)
Place of birth for the foreign-born population - Uzbekistan (%)
Place of birth for the foreign-born population - Other South Central Asia (%)
Place of birth for the foreign-born population - Burma (%)
Place of birth for the foreign-born population - Cambodia (%)
Place of birth for the foreign-born population - Indonesia (%)
Place of birth for the foreign-born population - Laos (%)
Place of birth for the foreign-born population - Malaysia (%)
Place of birth for the foreign-born population - Philippines (%)
Place of birth for the foreign-born population - Singapore (%)
Place of birth for the foreign-born population - Thailand (%)
Place of birth for the foreign-born population - Vietnam (%)
Place of birth for the foreign-born population - Other South Eastern Asia (%)
Place of birth for the foreign-born population - Armenia (%)
Place of birth for the foreign-born population - Iraq (%)
Place of birth for the foreign-born population - Israel (%)
Place of birth for the foreign-born population - Jordan (%)
Place of birth for the foreign-born population - Kuwait (%)
Place of birth for the foreign-born population - Lebanon (%)
Place of birth for the foreign-born population - Saudi Arabia (%)
Place of birth for the foreign-born population - Syria (%)
Place of birth for the foreign-born population - Turkey (%)
Place of birth for the foreign-born population - Yemen (%)
Place of birth for the foreign-born population - Other Western Asia (%)
Place of birth for the foreign-born population - Eritrea (%)
Place of birth for the foreign-born population - Ethiopia (%)
Place of birth for the foreign-born population - Kenya (%)
Place of birth for the foreign-born population - Somalia (%)
Place of birth for the foreign-born population - Uganda (%)
Place of birth for the foreign-born population - Zimbabwe (%)
Place of birth for the foreign-born population - Other Eastern Africa (%)
Place of birth for the foreign-born population - Cameroon (%)
Place of birth for the foreign-born population - Congo (%)
Place of birth for the foreign-born population - Democratic Republic of Congo (Zaire) (%)
Place of birth for the foreign-born population - Other Middle Africa (%)
Place of birth for the foreign-born population - Egypt (%)
Place of birth for the foreign-born population - Morocco (%)
Place of birth for the foreign-born population - Sudan (%)
Place of birth for the foreign-born population - Other Northern Africa (%)
Place of birth for the foreign-born population - South Africa (%)
Place of birth for the foreign-born population - Other Southern Africa (%)
Place of birth for the foreign-born population - Cabo Verde (%)
Place of birth for the foreign-born population - Ghana (%)
Place of birth for the foreign-born population - Liberia (%)
Place of birth for the foreign-born population - Nigeria (%)
Place of birth for the foreign-born population - Senegal (%)
Place of birth for the foreign-born population - Sierra Leone (%)
Place of birth for the foreign-born population - Other Western Africa (%)
Place of birth for the foreign-born population - Australia (%)
Place of birth for the foreign-born population - New Zealand (%)
Place of birth for the foreign-born population - Fiji (%)
Place of birth for the foreign-born population - Micronesia (%)
Place of birth for the foreign-born population - Bahamas (%)
Place of birth for the foreign-born population - Barbados (%)
Place of birth for the foreign-born population - Cuba (%)
Place of birth for the foreign-born population - Dominica (%)
Place of birth for the foreign-born population - Dominican Republic (%)
Place of birth for the foreign-born population - Grenada (%)
Place of birth for the foreign-born population - Haiti (%)
Place of birth for the foreign-born population - Jamaica (%)
Place of birth for the foreign-born population - St. Vincent and the Grenadines (%)
Place of birth for the foreign-born population - Trinidad and Tobago (%)
Place of birth for the foreign-born population - West Indies (%)
Place of birth for the foreign-born population - Other Caribbean (%)
Place of birth for the foreign-born population - Belize (%)
Place of birth for the foreign-born population - Costa Rica (%)
Place of birth for the foreign-born population - El Salvador (%)
Place of birth for the foreign-born population - Guatemala (%)
Place of birth for the foreign-born population - Honduras (%)
Place of birth for the foreign-born population - Mexico (%)
Place of birth for the foreign-born population - Nicaragua (%)
Place of birth for the foreign-born population - Panama (%)
Place of birth for the foreign-born population - Other Central America (%)
Place of birth for the foreign-born population - Argentina (%)
Place of birth for the foreign-born population - Bolivia (%)
Place of birth for the foreign-born population - Brazil (%)
Place of birth for the foreign-born population - Chile (%)
Place of birth for the foreign-born population - Colombia (%)
Place of birth for the foreign-born population - Ecuador (%)
Place of birth for the foreign-born population - Guyana (%)
Place of birth for the foreign-born population - Peru (%)
Place of birth for the foreign-born population - Uruguay (%)
Place of birth for the foreign-born population - Venezuela (%)
Place of birth for the foreign-born population - Other South America (%)
Place of birth for the foreign-born population - Canada (%)
Place of birth for the foreign-born population - Other Northern America (%)
Place of birth for the foreign-born population - Other (%)
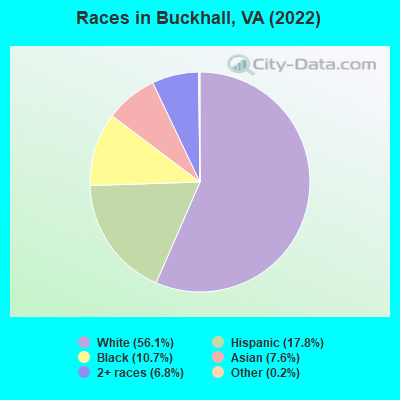
According to 2022 data, the most numerous races in Buckhall, VA are White alone (11,413 residents), Black alone (2,183 residents), and Hispanic (3,630 residents). 75.5% of Buckhall residents speak English at home.
Race distribution in Buckhall 11,413 56.1% White alone 3,630 17.8% Hispanic 2,183 10.7% Black alone 1,547 7.6% Asian alone 1,383 6.8% Two or more races 33 0.2% Other race alone
2000 2022
4,965,637 70.2% White alone 1,376,378 19.4% Black alone 329,540 4.7% Hispanic 259,277 3.7% Asian alone 114,022 1.6% Two or more races 18,596 0.3% American Indian alone 11,685 0.2% Other race alone 3,380 0.05% Native Hawaiian and Other
5,095,130 58.7% White alone 1,594,785 18.4% Black alone 905,750 10.4% Hispanic 602,881 6.9% Asian alone 406,047 4.7% Two or more races 60,419 0.7% Other race alone 11,738 0.1% American Indian alone 6,869 0.08% Native Hawaiian and Other
Income and house value in Buckhall Median household income in 2022 $154,637 White non-Hispanic householders$158,858 Black householders$183,352 Asian householders$144,783 Some other race householders$167,608 Two or more races householders$140,171 Hispanic or Latino race householders
Median age by race in Buckhall
42.9 Median age for White residents42.6 42.9 39.4 Median age for Black or African American residents37.6 42.9 -633,911,367.4 Median age for American Indian / Alaska Native residents-649,621,211.5 -670,886,075.3 42.7 Median age for Asian residents43.5 42.8 -611,955,419.9 Median age for Native Hawaiian / Pacific Islander residents-541,531,822.5 -714,150,046.8 30.0 Median age for Other race residents28.3 36.7 27.1 Median age for Two or more races residents19.2 39.1 42.6 Median age for White alone residents42.8 41.5 31.8 Median age for Hispanic or Latino residents28.6 40.3
Owner/renter occupied households by race in Buckhall
House owners and renters - White residents 3,549 88.1% Owner occupied480 11.9% Renter occupiedHouse owners and renters - Black or African American residents 540 85.1% Owner occupied94 14.9% Renter occupiedHouse owners and renters - Asian residents 358 89.2% Owner occupied43 10.8% Renter occupiedHouse owners and renters - Other race residents 149 93.9% Owner occupied10 6.1% Renter occupiedHouse owners and renters - Two or more races residents 763 76.7% Owner occupied232 23.3% Renter occupiedHouse owners and renters - White alone residents 3,504 87.3% Owner occupied510 12.7% Renter occupiedHouse owners and renters - Hispanic or Latino residents 834 79.9% Owner occupied210 20.1% Renter occupied
Language usage in Buckhall
English speakers - Total 75.5% of residents of Buckhall speak English at home.
12.1% of residents speak Spanish at home 1,697 73.9% Speak English very well599 26.1% Speak English less than very well12.3% of residents speak other language at home 1,621 69.4% Speak English very well715 30.6% Speak English less than very well
English speakers - Born in the United States 93.1% of residents of Buckhall speak English at home.
3.4% of residents speak Spanish at home 279 93.0% Speak English very well21 7.0% Speak English less than very well3.2% of residents speak other language at home 275 96.8% Speak English very well9 3.2% Speak English less than very well
English speakers - Native, born elsewhere 52.8% of residents of Buckhall speak English at home.
20.7% of residents speak Spanish at home 72 63.7% Speak English very well41 36.3% Speak English less than very well30.0% of residents speak other language at home 103 62.8% Speak English very well61 37.2% Speak English less than very well
English speakers - Foreign-born 9.1% of residents of Buckhall speak English at home.
40.7% of residents speak Spanish at home 776 58.9% Speak English very well541 41.1% Speak English less than very well50.4% of residents speak other language at home 1,021 62.6% Speak English very well611 37.4% Speak English less than very well
White (Caucasian) - Speak only English Native:
98.0% (10,335)Foreign-born:
14.6% (66)
White (Caucasian) - Speak another language Native:
3.8% (406)Foreign-born:
85.6% (383)
Black or African American - Speak only English Native:
91.2% (1,583)Foreign-born:
5.6% (20)
Black or African American - Speak another language Native:
9.0% (157)Foreign-born:
100.0% (362)
Asian - Speak only English Native:
49.5% (232)Foreign-born:
9.4% (100)
Asian - Speak another language Native:
45.9% (215)Foreign-born:
90.6% (964)
Other race - Speak only English Native:
15.5% (56)Foreign-born:
8.1% (28)
Other race - Speak another language Native:
84.7% (304)Foreign-born:
91.6% (313)
Two or more races - Speak only English Native:
74.0% (1,718)Foreign-born:
1.9% (20)
Two or more races - Speak another language Native:
24.1% (560)Foreign-born:
96.8% (1,007)
White alone - Speak only English Native:
97.6% (10,205)Foreign-born:
22.3% (75)
White alone - Speak another language Native:
2.5% (265)Foreign-born:
75.9% (253)
Hispanic or Latino - Speak only English Native:
53.7% (1,053)Foreign-born:
7.0% (98)
Hispanic or Latino - Speak another language Native:
47.1% (924)Foreign-born:
92.5% (1,303)
Foreign-born residents in Buckhall
Marital status for residents in Buckhall Marital status - White (Caucasian) population 15 years and over
Males 29.6% Never married60.2% Now married2.3% Separated2.1% Widowed5.8% DivorcedFemales 20.4% Never married63.8% Now married1.9% Separated5.6% Widowed8.2% DivorcedWomen who gave birth in the past 12 months Now married:
88.4% (94)Unmarried:
11.6% (12)
Women who did not give birth in the past 12 months Now married:
63.0% (1,311)Unmarried:
37.0% (770)
Marital status - Black or African American population 15 years and over
Males 38.9% Never married54.8% Now married1.3% Separated0.6% Widowed4.5% DivorcedFemales 24.1% Never married62.5% Now married2.5% Separated6.0% Widowed5.0% DivorcedWomen who gave birth in the past 12 months Now married:
100.0% (6)Unmarried:
0.0% (0)
Women who did not give birth in the past 12 months Now married:
58.6% (286)Unmarried:
41.4% (202)
Marital status - Asian population 15 years and over
Males 24.0% Never married72.9% Now married0.0% Separated0.0% Widowed3.1% DivorcedFemales 14.6% Never married78.6% Now married0.0% Separated2.5% Widowed4.2% DivorcedWomen who gave birth in the past 12 months Now married:
100.0% (66)Unmarried:
0.0% (0)
Women who did not give birth in the past 12 months Now married:
69.8% (258)Unmarried:
30.2% (112)
Marital status - Other race population 15 years and over
Males 51.8% Never married35.1% Now married6.9% Separated0.0% Widowed6.2% DivorcedFemales 28.6% Never married48.8% Now married5.4% Separated10.8% Widowed6.4% DivorcedWomen who gave birth in the past 12 months Now married:
100.0% (19)Unmarried:
0.0% (0)
Women who did not give birth in the past 12 months Now married:
52.8% (86)Unmarried:
47.2% (77)
Marital status - Two or more races population 15 years and over
Males 24.1% Never married72.8% Now married0.0% Separated0.0% Widowed3.1% DivorcedFemales 15.7% Never married69.5% Now married0.7% Separated0.6% Widowed13.5% DivorcedWomen who did not give birth in the past 12 months Now married:
71.4% (706)Unmarried:
28.6% (283)
Marital status - White alone, not Hispanic / Latino population 15 years and over
Males 25.8% Never married63.3% Now married2.2% Separated2.4% Widowed6.3% DivorcedFemales 19.2% Never married65.4% Now married1.4% Separated5.9% Widowed8.2% DivorcedWomen who gave birth in the past 12 months Now married:
87.5% (100)Unmarried:
12.5% (14)
Women who did not give birth in the past 12 months Now married:
64.9% (1,385)Unmarried:
35.1% (750)
Marital status - Hispanic or Latino population 15 years and over
Males 38.8% Never married55.6% Now married2.6% Separated0.0% Widowed3.0% DivorcedFemales 28.2% Never married57.3% Now married3.8% Separated2.8% Widowed8.0% DivorcedWomen who gave birth in the past 12 months Now married:
100.0% (24)Unmarried:
0.0% (0)
Women who did not give birth in the past 12 months Now married:
58.6% (594)Unmarried:
41.4% (420)
Ancestries in Buckhall
682 7.5% English617 6.8% American556 6.1% German445 4.9% European362 4.0% Irish179 2.0% Sudanese141 1.6% Italian137 1.5% African133 1.5% Egyptian118 1.3% Greek99 1.1% Jamaican75 0.8% Russian70 0.8% Polish69 0.8% Ethiopian68 0.7% Eastern European66 0.7% Scottish54 0.6% Czechoslovakian39 0.4% Ghanaian38 0.4% Norwegian35 0.4% Swedish32 0.4% French32 0.4% Portuguese30 0.3% Haitian27 0.3% British27 0.3% Scotch-Irish23 0.3% Ukrainian17 0.2% Lithuanian16 0.2% Austrian16 0.2% Nigerian14 0.2% Slovak14 0.2% British West Indian13 0.1% Scandinavian12 0.1% Brazilian11 0.1% Czech10 0.1% Estonian8 0.09% Croatian8 0.09% Welsh7 0.08% Northern European6 0.07% French Canadian6 0.07% Icelander4 0.04% Yugoslavian
Geographical mobility in Buckhall Same house 1 year ago 10,034 90.3% White (Caucasian)1,929 87.0% Black or African American52 96.1% American Indian / Alaska Native1,507 97.6% Asian628 85.7% Other race3,613 94.4% Two or more races10,412 92.2% White alone, not Hispanic / Latino3,186 88.3% Hispanic or LatinoMoved within same county 417 3.8% White / Caucasian54 2.4% Black or African American12 0.8% Asian55 7.5% Other race55 1.4% Two or more races347 3.1% White alone, not Hispanic / Latino142 3.9% Hispanic or LatinoMoved within same state 302 2.7% White / Caucasian192 8.7% Black or African American45 2.9% Asian16 2.2% Other race42 1.1% Two or more races227 2.0% White alone, not Hispanic / Latino163 4.5% Hispanic or LatinoMoved from different state 229 2.1% White / Caucasian53 2.4% Black or African American105 2.7% Two or more races224 2.0% White alone, not Hispanic / Latino73 2.0% Hispanic or LatinoMoved from abroad 9 0.1% White10 0.6% Asian8 0.2% Hispanic or Latino
Children Nativity (place of birth) in Buckhall
Children under 6 years - Living with two parents Both parents native 894 100.0% NativeBoth parents foreign-born 213 100.0% NativeOne native, one foreign-born parent 246 100.0% NativeChildren under 6 years - Living with one parent Native parent 183 100.0% NativeForeign-born parent 21 100.0% NativeChildren 6 to 17 years - Living with two parents Both parents native 1,968 99.6% Native7 0.4% Foreign-bornBoth parents foreign-born 319 95.2% Native16 4.8% Foreign-bornOne native, one foreign-born parent 246 93.4% Native17 6.6% Foreign-bornChildren 6 to 17 years - Living with one parent Native parent 287 100.0% NativeForeign-born parent 206 56.7% Native157 43.3% Foreign-born
Grandparents responsible for own grandchildren in Buckhall
Grandparents (30 to 59 years) White / Caucasian 7 20.8% Responsible for grandchildren26 79.2% Not responsible for grandchildrenAsian 6 100.0% Not responsible for grandchildrenOther race 47 100.0% Not responsible for grandchildrenTwo or more races 17 100.0% Not responsible for grandchildrenWhite alone, not Hispanic / Latino 7 16.2% Responsible for grandchildren37 83.8% Not responsible for grandchildrenHispanic or Latino 36 100.0% Not responsible for grandchildrenGrandparents (60 years and over) White / Caucasian 11 7.1% Responsible for grandchildren139 92.9% Not responsible for grandchildrenAsian 8 100.0% Not responsible for grandchildrenOther race 20 100.0% Not responsible for grandchildrenWhite alone, not Hispanic / Latino 12 7.0% Responsible for grandchildren165 93.0% Not responsible for grandchildrenHispanic or Latino 21 100.0% Not responsible for grandchildren