Races in Brownsville, Texas (TX) Detailed Stats
Data:
Races - White alone (%)
Races - White alone (% change since 2000)
Races - Black alone (%)
Races - Black alone (% change since 2000)
Races - American Indian alone (%)
Races - American Indian alone (% change since 2000)
Races - Asian alone (%)
Races - Asian alone (% change since 2000)
Races - Hispanic (%)
Races - Hispanic (% change since 2000)
Races - Native Hawaiian and Other Pacific Islander alone (%)
Races - Native Hawaiian and Other Pacific Islander alone (% change since 2000)
Races - Two or more races(%)
Races - Two or more races(% change since 2000)
Races - Other race alone (%)
Races - Other race alone (% change since 2000)
Racial diversity
Place of birth - Born in state of residence (%)
Place of birth - Born in state of residence (%) - White
Place of birth - Born in state of residence (%) - Black or African American
Place of birth - Born in state of residence (%) - Asian
Place of birth - Born in state of residence (%) - Hispanic or Latino
Place of birth - Born in state of residence (%) - American Indian and Alaska Native
Place of birth - Born in state of residence (%) - Multirace
Place of birth - Born in state of residence (%) - Other Race
Place of birth - Born in other state (%)
Place of birth - Born in other state (%) - White
Place of birth - Born in other state (%) - Black or African American
Place of birth - Born in other state (%) - Asian
Place of birth - Born in other state (%) - Hispanic or Latino
Place of birth - Born in other state (%) - American Indian and Alaska Native
Place of birth - Born in other state (%) - Multirace
Place of birth - Born in other state (%) - Other Race
Place of birth - Native, outside of US (%)
Place of birth - Native, outside of US (%) - White
Place of birth - Native, outside of US (%) - Black or African American
Place of birth - Native, outside of US (%) - Asian
Place of birth - Native, outside of US (%) - Hispanic or Latino
Place of birth - Native, outside of US (%) - American Indian and Alaska Native
Place of birth - Native, outside of US (%) - Multirace
Place of birth - Native, outside of US (%) - Other Race
Place of birth - Foreign born (%)
Place of birth - Foreign born (%) - White
Place of birth - Foreign born (%) - Black or African American
Place of birth - Foreign born (%) - Asian
Place of birth - Foreign born (%) - Hispanic or Latino
Place of birth - Foreign born (%) - American Indian and Alaska Native
Place of birth - Foreign born (%) - Multirace
Place of birth - Foreign born (%) - Other Race
Residents speaking English at home (%)
Residents speaking English at home - Born in the United States (%)
Residents speaking English at home - Native, born elsewhere (%)
Residents speaking English at home - Foreign born (%)
Residents speaking Spanish at home (%)
Residents speaking Spanish at home - Born in the United States (%)
Residents speaking Spanish at home - Native, born elsewhere (%)
Residents speaking Spanish at home - Foreign born (%)
Residents speaking other language at home (%)
Residents speaking other language at home - Born in the United States (%)
Residents speaking other language at home - Native, born elsewhere (%)
Residents speaking other language at home - Foreign born (%)
Marital status - Never married (%)
Marital status - Now married (%)
Marital status - Separated (%)
Marital status - Widowed (%)
Marital status - Divorced (%)
Ancestries Reported - Arab (%)
Ancestries Reported - Czech (%)
Ancestries Reported - Danish (%)
Ancestries Reported - Dutch (%)
Ancestries Reported - English (%)
Ancestries Reported - French (%)
Ancestries Reported - French Canadian (%)
Ancestries Reported - German (%)
Ancestries Reported - Greek (%)
Ancestries Reported - Hungarian (%)
Ancestries Reported - Irish (%)
Ancestries Reported - Italian (%)
Ancestries Reported - Lithuanian (%)
Ancestries Reported - Norwegian (%)
Ancestries Reported - Polish (%)
Ancestries Reported - Portuguese (%)
Ancestries Reported - Russian (%)
Ancestries Reported - Scotch-Irish (%)
Ancestries Reported - Scottish (%)
Ancestries Reported - Slovak (%)
Ancestries Reported - Subsaharan African (%)
Ancestries Reported - Swedish (%)
Ancestries Reported - Swiss (%)
Ancestries Reported - Ukrainian (%)
Ancestries Reported - United States (%)
Ancestries Reported - Welsh (%)
Ancestries Reported - West Indian (%)
Ancestries Reported - Other (%)
Geographical mobility - Same house 1 year ago (%)
Geographical mobility - Same house 1 year ago (%) - White
Geographical mobility - Same house 1 year ago (%) - Black or African American
Geographical mobility - Same house 1 year ago (%) - Asian
Geographical mobility - Same house 1 year ago (%) - Hispanic or Latino
Geographical mobility - Same house 1 year ago (%) - American Indian and Alaska Native
Geographical mobility - Same house 1 year ago (%) - Multirace
Geographical mobility - Same house 1 year ago (%) - Other Race
Geographical mobility - Moved within same county (%)
Geographical mobility - Moved within same county (%) - White
Geographical mobility - Moved within same county (%) - Black or African American
Geographical mobility - Moved within same county (%) - Asian
Geographical mobility - Moved within same county (%) - Hispanic or Latino
Geographical mobility - Moved within same county (%) - American Indian and Alaska Native
Geographical mobility - Moved within same county (%) - Multirace
Geographical mobility - Moved within same county (%) - Other Race
Geographical mobility - Moved from different county within same state (%)
Geographical mobility - Moved from different county within same state (%) - White
Geographical mobility - Moved from different county within same state (%) - Black or African American
Geographical mobility - Moved from different county within same state (%) - Asian
Geographical mobility - Moved from different county within same state (%) - Hispanic or Latino
Geographical mobility - Moved from different county within same state (%) - American Indian and Alaska Native
Geographical mobility - Moved from different county within same state (%) - Multirace
Geographical mobility - Moved from different county within same state (%) - Other Race
Geographical mobility - Moved from different state (%)
Geographical mobility - Moved from different state (%) - White
Geographical mobility - Moved from different state (%) - Black or African American
Geographical mobility - Moved from different state (%) - Asian
Geographical mobility - Moved from different state (%) - Hispanic or Latino
Geographical mobility - Moved from different state (%) - American Indian and Alaska Native
Geographical mobility - Moved from different state (%) - Multirace
Geographical mobility - Moved from different state (%) - Other Race
Geographical mobility - Moved from abroad (%)
Geographical mobility - Moved from abroad (%) - White
Geographical mobility - Moved from abroad (%) - Black or African American
Geographical mobility - Moved from abroad (%) - Asian
Geographical mobility - Moved from abroad (%) - Hispanic or Latino
Geographical mobility - Moved from abroad (%) - American Indian and Alaska Native
Geographical mobility - Moved from abroad (%) - Multirace
Geographical mobility - Moved from abroad (%) - Other Race
Place of birth for the foreign-born population - Ireland (%)
Place of birth for the foreign-born population - Denmark (%)
Place of birth for the foreign-born population - Norway (%)
Place of birth for the foreign-born population - Sweden (%)
Place of birth for the foreign-born population - United Kingdom (%)
Place of birth for the foreign-born population - England (%)
Place of birth for the foreign-born population - Scotland (%)
Place of birth for the foreign-born population - Other Northern Europe (%)
Place of birth for the foreign-born population - Austria (%)
Place of birth for the foreign-born population - Belgium (%)
Place of birth for the foreign-born population - France (%)
Place of birth for the foreign-born population - Germany (%)
Place of birth for the foreign-born population - Netherlands (%)
Place of birth for the foreign-born population - Switzerland (%)
Place of birth for the foreign-born population - Other Western Europe (%)
Place of birth for the foreign-born population - Greece (%)
Place of birth for the foreign-born population - Italy (%)
Place of birth for the foreign-born population - Portugal (%)
Place of birth for the foreign-born population - Spain (%)
Place of birth for the foreign-born population - Other Southern Europe (%)
Place of birth for the foreign-born population - Albania (%)
Place of birth for the foreign-born population - Belarus (%)
Place of birth for the foreign-born population - Bosnia and Herzegovina (%)
Place of birth for the foreign-born population - Bulgaria (%)
Place of birth for the foreign-born population - Croatia (%)
Place of birth for the foreign-born population - Czechoslovakia (%)
Place of birth for the foreign-born population - Hungary (%)
Place of birth for the foreign-born population - Latvia (%)
Place of birth for the foreign-born population - Lithuania (%)
Place of birth for the foreign-born population - North Macedonia (Macedonia) (%)
Place of birth for the foreign-born population - Moldova (%)
Place of birth for the foreign-born population - Poland (%)
Place of birth for the foreign-born population - Romania (%)
Place of birth for the foreign-born population - Russia (%)
Place of birth for the foreign-born population - Serbia (%)
Place of birth for the foreign-born population - Ukraine (%)
Place of birth for the foreign-born population - Other Eastern Europe (%)
Place of birth for the foreign-born population - China (%)
Place of birth for the foreign-born population - Hong Kong (%)
Place of birth for the foreign-born population - Taiwan (%)
Place of birth for the foreign-born population - Japan (%)
Place of birth for the foreign-born population - Korea (%)
Place of birth for the foreign-born population - Other Eastern Asia (%)
Place of birth for the foreign-born population - Afghanistan (%)
Place of birth for the foreign-born population - Bangladesh (%)
Place of birth for the foreign-born population - India (%)
Place of birth for the foreign-born population - Iran (%)
Place of birth for the foreign-born population - Kazakhstan (%)
Place of birth for the foreign-born population - Nepal (%)
Place of birth for the foreign-born population - Pakistan (%)
Place of birth for the foreign-born population - Sri Lanka (%)
Place of birth for the foreign-born population - Uzbekistan (%)
Place of birth for the foreign-born population - Other South Central Asia (%)
Place of birth for the foreign-born population - Burma (%)
Place of birth for the foreign-born population - Cambodia (%)
Place of birth for the foreign-born population - Indonesia (%)
Place of birth for the foreign-born population - Laos (%)
Place of birth for the foreign-born population - Malaysia (%)
Place of birth for the foreign-born population - Philippines (%)
Place of birth for the foreign-born population - Singapore (%)
Place of birth for the foreign-born population - Thailand (%)
Place of birth for the foreign-born population - Vietnam (%)
Place of birth for the foreign-born population - Other South Eastern Asia (%)
Place of birth for the foreign-born population - Armenia (%)
Place of birth for the foreign-born population - Iraq (%)
Place of birth for the foreign-born population - Israel (%)
Place of birth for the foreign-born population - Jordan (%)
Place of birth for the foreign-born population - Kuwait (%)
Place of birth for the foreign-born population - Lebanon (%)
Place of birth for the foreign-born population - Saudi Arabia (%)
Place of birth for the foreign-born population - Syria (%)
Place of birth for the foreign-born population - Turkey (%)
Place of birth for the foreign-born population - Yemen (%)
Place of birth for the foreign-born population - Other Western Asia (%)
Place of birth for the foreign-born population - Eritrea (%)
Place of birth for the foreign-born population - Ethiopia (%)
Place of birth for the foreign-born population - Kenya (%)
Place of birth for the foreign-born population - Somalia (%)
Place of birth for the foreign-born population - Uganda (%)
Place of birth for the foreign-born population - Zimbabwe (%)
Place of birth for the foreign-born population - Other Eastern Africa (%)
Place of birth for the foreign-born population - Cameroon (%)
Place of birth for the foreign-born population - Congo (%)
Place of birth for the foreign-born population - Democratic Republic of Congo (Zaire) (%)
Place of birth for the foreign-born population - Other Middle Africa (%)
Place of birth for the foreign-born population - Egypt (%)
Place of birth for the foreign-born population - Morocco (%)
Place of birth for the foreign-born population - Sudan (%)
Place of birth for the foreign-born population - Other Northern Africa (%)
Place of birth for the foreign-born population - South Africa (%)
Place of birth for the foreign-born population - Other Southern Africa (%)
Place of birth for the foreign-born population - Cabo Verde (%)
Place of birth for the foreign-born population - Ghana (%)
Place of birth for the foreign-born population - Liberia (%)
Place of birth for the foreign-born population - Nigeria (%)
Place of birth for the foreign-born population - Senegal (%)
Place of birth for the foreign-born population - Sierra Leone (%)
Place of birth for the foreign-born population - Other Western Africa (%)
Place of birth for the foreign-born population - Australia (%)
Place of birth for the foreign-born population - New Zealand (%)
Place of birth for the foreign-born population - Fiji (%)
Place of birth for the foreign-born population - Micronesia (%)
Place of birth for the foreign-born population - Bahamas (%)
Place of birth for the foreign-born population - Barbados (%)
Place of birth for the foreign-born population - Cuba (%)
Place of birth for the foreign-born population - Dominica (%)
Place of birth for the foreign-born population - Dominican Republic (%)
Place of birth for the foreign-born population - Grenada (%)
Place of birth for the foreign-born population - Haiti (%)
Place of birth for the foreign-born population - Jamaica (%)
Place of birth for the foreign-born population - St. Vincent and the Grenadines (%)
Place of birth for the foreign-born population - Trinidad and Tobago (%)
Place of birth for the foreign-born population - West Indies (%)
Place of birth for the foreign-born population - Other Caribbean (%)
Place of birth for the foreign-born population - Belize (%)
Place of birth for the foreign-born population - Costa Rica (%)
Place of birth for the foreign-born population - El Salvador (%)
Place of birth for the foreign-born population - Guatemala (%)
Place of birth for the foreign-born population - Honduras (%)
Place of birth for the foreign-born population - Mexico (%)
Place of birth for the foreign-born population - Nicaragua (%)
Place of birth for the foreign-born population - Panama (%)
Place of birth for the foreign-born population - Other Central America (%)
Place of birth for the foreign-born population - Argentina (%)
Place of birth for the foreign-born population - Bolivia (%)
Place of birth for the foreign-born population - Brazil (%)
Place of birth for the foreign-born population - Chile (%)
Place of birth for the foreign-born population - Colombia (%)
Place of birth for the foreign-born population - Ecuador (%)
Place of birth for the foreign-born population - Guyana (%)
Place of birth for the foreign-born population - Peru (%)
Place of birth for the foreign-born population - Uruguay (%)
Place of birth for the foreign-born population - Venezuela (%)
Place of birth for the foreign-born population - Other South America (%)
Place of birth for the foreign-born population - Canada (%)
Place of birth for the foreign-born population - Other Northern America (%)
Place of birth for the foreign-born population - Other (%)
Latest news about races in Brownsville, TX collected exclusively by city-data.com from local newspapers, TV, and radio stations
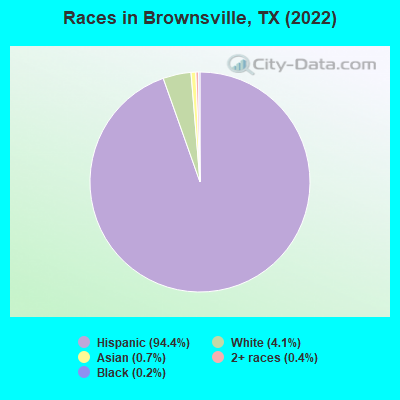
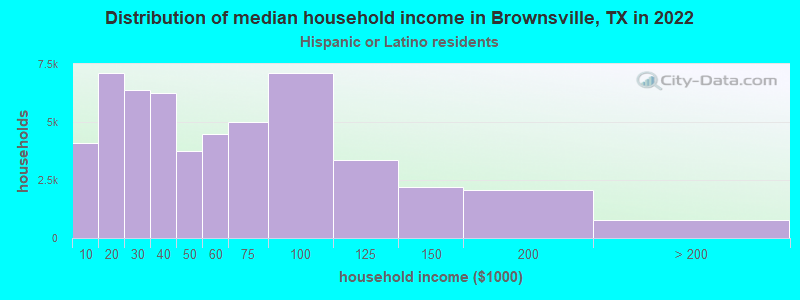
According to 2022 data, the most numerous races in Brownsville, TX are Hispanic (177,958 residents), White alone (7,716 residents), and Black alone (416 residents). 17.8% of Brownsville residents speak English at home. 28.1% of Brownsville, TX residents are foreign-born (26.4% born in Latin America), which is 39.4% greater than the foreign-born rate of 17.0% across the entire state of Texas.
Race distribution in Brownsville
2000 2022
10,933,313 52.4% White alone 6,669,666 32.0% Hispanic 2,364,255 11.3% Black alone 554,445 2.7% Asian alone 230,567 1.1% Two or more races 68,859 0.3% American Indian alone 19,958 0.10% Other race alone 10,757 0.05% Native Hawaiian and Other
12,070,642 40.2% Hispanic 11,683,430 38.9% White alone 3,508,706 11.7% Black alone 1,608,173 5.4% Asian alone 956,560 3.2% Two or more races 125,763 0.4% Other race alone 47,023 0.2% American Indian alone 29,275 0.10% Native Hawaiian and Other
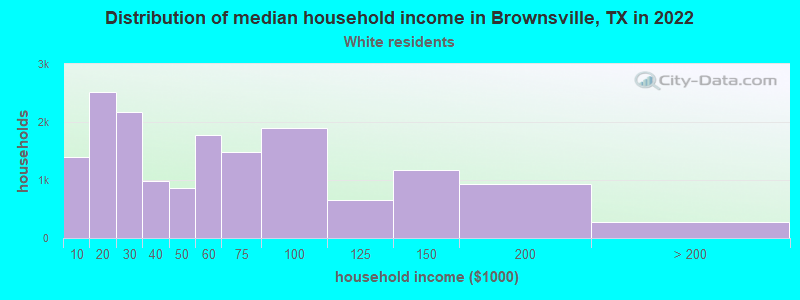
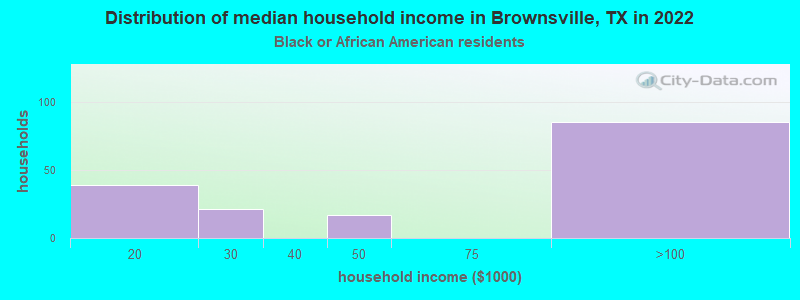
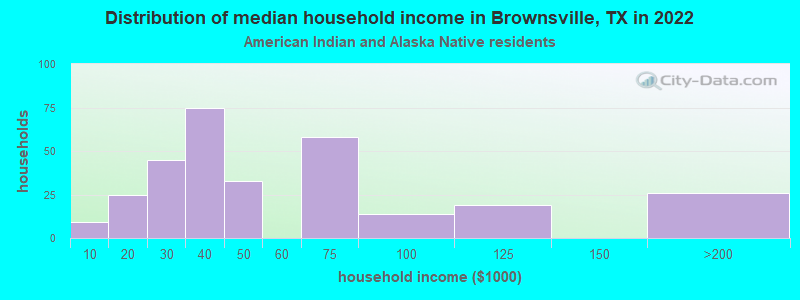
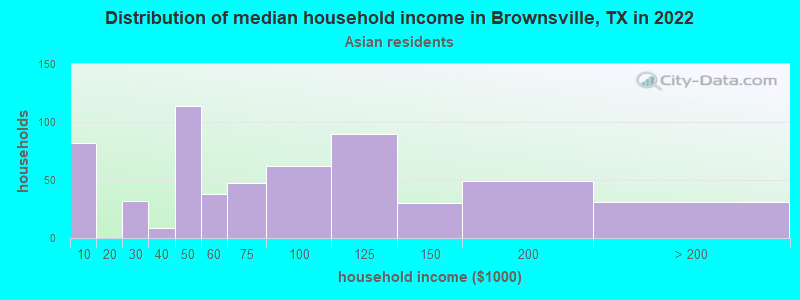
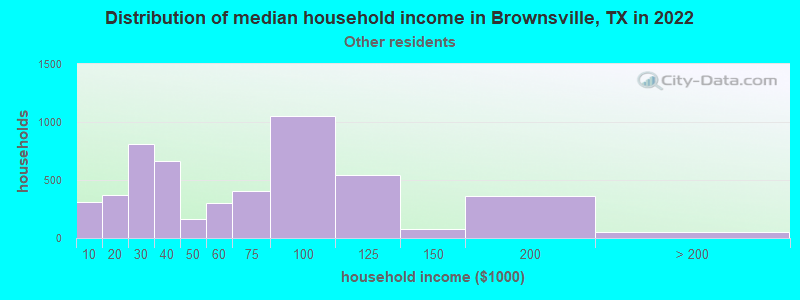
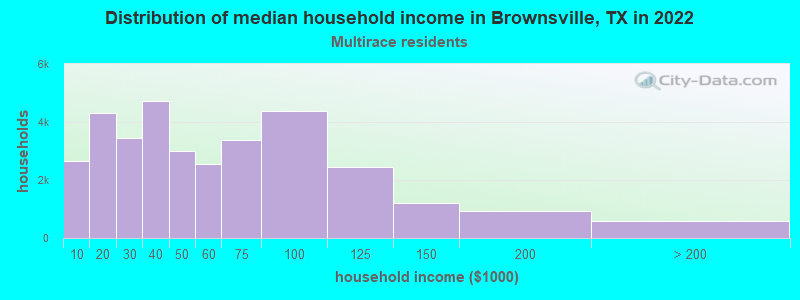
Income and house value in Brownsville Median household income in 2022 $60,213 White non-Hispanic householders$16,532 Black householders$36,565 American Indian and Alaska Native householders$60,798 Asian householders$56,168 Some other race householders$45,507 Two or more races householders$46,484 Hispanic or Latino race householdersMedian 2022 house value $229,632 White Non-Hispanic householders$253,377 Black or African American householders$106,586 American Indian or Alaska Native householders $237,997 Asian householders$123,855 Some other race householders$120,617 Two or more races householders$131,950 Hispanic or Latino householders
Median age by race in Brownsville
28.7 Median age for White residents28.0 30.3 34.6 Median age for Black or African American residents45.8 22.1 40.8 Median age for American Indian / Alaska Native residents40.7 47.0 36.3 Median age for Asian residents33.9 36.9 8.8 Median age for Native Hawaiian / Pacific Islander residents-666,666,666.0 11.2 29.8 Median age for Other race residents28.5 34.5 27.7 Median age for Two or more races residents26.3 29.8 36.6 Median age for White alone residents35.6 39.7 28.1 Median age for Hispanic or Latino residents26.3 29.9
Owner/renter occupied households by race in Brownsville
House owners and renters - White residents 10,002 62.0% Owner occupied6,135 38.0% Renter occupiedHouse owners and renters - Black or African American residents 98 56.8% Owner occupied75 43.2% Renter occupiedHouse owners and renters - American Indian / Alaska Native residents 256 71.2% Owner occupied104 28.8% Renter occupiedHouse owners and renters - Asian residents 452 60.8% Owner occupied292 39.2% Renter occupiedHouse owners and renters - Native Hawaiian / Pacific Islander residents 34 100.0% Owner occupiedHouse owners and renters - Other race residents 3,054 59.9% Owner occupied2,047 40.1% Renter occupiedHouse owners and renters - Two or more races residents 18,832 56.0% Owner occupied14,813 44.0% Renter occupiedHouse owners and renters - White alone residents 1,630 63.6% Owner occupied933 36.4% Renter occupiedHouse owners and renters - Hispanic or Latino residents 30,711 58.4% Owner occupied21,889 41.6% Renter occupied
Language usage in Brownsville
English speakers - Total 17.8% of residents of Brownsville speak English at home.
81.2% of residents speak Spanish at home 92,042 65.3% Speak English very well48,837 34.7% Speak English less than very well1.1% of residents speak other language at home 859 46.3% Speak English very well995 53.7% Speak English less than very well
English speakers - Born in the United States 49.4% of residents of Brownsville speak English at home.
50.2% of residents speak Spanish at home 4,831 82.5% Speak English very well1,023 17.5% Speak English less than very well0.4% of residents speak other language at home 28 54.9% Speak English very well23 45.1% Speak English less than very well
English speakers - Native, born elsewhere 4.3% of residents of Brownsville speak English at home.
95.7% of residents speak Spanish at home 1,091 48.5% Speak English very well1,158 51.5% Speak English less than very well
English speakers - Foreign-born 3.9% of residents of Brownsville speak English at home.
92.5% of residents speak Spanish at home 13,197 28.8% Speak English very well32,597 71.2% Speak English less than very well3.6% of residents speak other language at home 831 46.1% Speak English very well972 53.9% Speak English less than very well
White (Caucasian) - Speak only English Native:
31.0% (11,562)Foreign-born:
4.8% (395)
White (Caucasian) - Speak another language Native:
69.0% (25,785)Foreign-born:
95.2% (7,899)
Black or African American - Speak another language Native:
17.9% (111)Foreign-born:
100.0% (71)
American Indian / Alaska Native - Speak another language Native:
77.9% (350)Foreign-born:
98.9% (253)
Asian - Speak only English Native:
27.2% (20)Foreign-born:
13.8% (187)
Asian - Speak another language Native:
24.3% (18)Foreign-born:
85.7% (1,160)
Other race - Speak only English Native:
33.7% (3,916)Foreign-born:
1.9% (106)
Other race - Speak another language Native:
66.3% (7,705)Foreign-born:
98.1% (5,467)
Two or more races - Speak only English Native:
16.4% (11,996)Foreign-born:
3.7% (1,253)
Two or more races - Speak another language Native:
83.6% (61,121)Foreign-born:
96.3% (32,551)
White alone - Speak only English Native:
79.2% (5,349)Foreign-born:
37.4% (146)
White alone - Speak another language Native:
17.5% (1,178)Foreign-born:
56.6% (221)
Hispanic or Latino - Speak only English Native:
19.4% (22,653)Foreign-born:
3.7% (1,754)
Hispanic or Latino - Speak another language Native:
80.6% (93,897)Foreign-born:
96.3% (46,060)
Foreign-born residents in Brownsville 52,911 residents are foreign born (26.4% Latin America ).
This city:
28.1%Texas:
17.1%
Marital status for residents in Brownsville Marital status - White (Caucasian) population 15 years and over
Males 46.3% Never married43.8% Now married1.1% Separated2.1% Widowed6.6% DivorcedFemales 38.7% Never married35.7% Now married3.9% Separated11.4% Widowed10.4% DivorcedWomen who gave birth in the past 12 months Now married:
28.4% (239)Unmarried:
71.6% (603)
Women who did not give birth in the past 12 months Now married:
31.2% (3,613)Unmarried:
68.8% (7,976)
Marital status - Black or African American population 15 years and over
Males 46.7% Never married31.8% Now married1.9% Separated0.0% Widowed19.6% DivorcedFemales 26.3% Never married47.9% Now married19.8% Separated0.0% Widowed6.0% DivorcedWomen who gave birth in the past 12 months Now married:
100.0% (51)Unmarried:
0.0% (0)
Women who did not give birth in the past 12 months Now married:
47.6% (50)Unmarried:
52.4% (55)
Marital status - American Indian / Alaska Native population 15 years and over
Males 34.0% Never married64.5% Now married0.0% Separated0.0% Widowed1.5% DivorcedFemales 30.5% Never married38.1% Now married3.5% Separated6.2% Widowed21.7% DivorcedWomen who gave birth in the past 12 months Now married:
100.0% (22)Unmarried:
0.0% (0)
Women who did not give birth in the past 12 months Now married:
51.6% (93)Unmarried:
48.4% (87)
Marital status - Asian population 15 years and over
Males 20.9% Never married78.1% Now married0.0% Separated0.0% Widowed0.9% DivorcedFemales 7.3% Never married71.2% Now married2.3% Separated14.0% Widowed5.2% DivorcedWomen who gave birth in the past 12 months Now married:
100.0% (82)Unmarried:
0.0% (0)
Women who did not give birth in the past 12 months Now married:
95.9% (305)Unmarried:
4.1% (13)
Marital status - Native Hawaiian / Pacific Islander population 15 years and over
Males 62.5% Never married37.5% Now married0.0% Separated0.0% Widowed0.0% DivorcedFemales 43.5% Never married0.0% Now married56.5% Separated0.0% Widowed0.0% DivorcedWomen who did not give birth in the past 12 months Now married:
56.5% (16)Unmarried:
43.5% (12)
Marital status - Other race population 15 years and over
Males 46.3% Never married38.1% Now married1.9% Separated7.5% Widowed6.2% DivorcedFemales 40.6% Never married42.0% Now married0.8% Separated9.8% Widowed6.8% DivorcedWomen who gave birth in the past 12 months Now married:
73.4% (126)Unmarried:
26.6% (46)
Women who did not give birth in the past 12 months Now married:
42.7% (2,510)Unmarried:
57.3% (3,370)
Marital status - Two or more races population 15 years and over
Males 34.6% Never married55.0% Now married1.9% Separated2.9% Widowed5.7% DivorcedFemales 34.7% Never married43.6% Now married6.0% Separated9.1% Widowed6.7% DivorcedWomen who gave birth in the past 12 months Now married:
85.8% (794)Unmarried:
14.2% (131)
Women who did not give birth in the past 12 months Now married:
45.4% (13,727)Unmarried:
54.6% (16,506)
Marital status - White alone, not Hispanic / Latino population 15 years and over
Males 26.0% Never married59.7% Now married1.1% Separated0.0% Widowed13.2% DivorcedFemales 17.5% Never married57.1% Now married1.7% Separated7.6% Widowed16.1% DivorcedWomen who gave birth in the past 12 months Now married:
51.9% (26)Unmarried:
48.1% (24)
Women who did not give birth in the past 12 months Now married:
37.8% (386)Unmarried:
62.2% (635)
Marital status - Hispanic or Latino population 15 years and over
Males 39.4% Never married49.9% Now married1.7% Separated3.4% Widowed5.7% DivorcedFemales 37.0% Never married40.6% Now married5.1% Separated9.8% Widowed7.4% DivorcedWomen who gave birth in the past 12 months Now married:
50.7% (900)Unmarried:
49.3% (874)
Women who did not give birth in the past 12 months Now married:
40.6% (18,336)Unmarried:
59.4% (26,834)
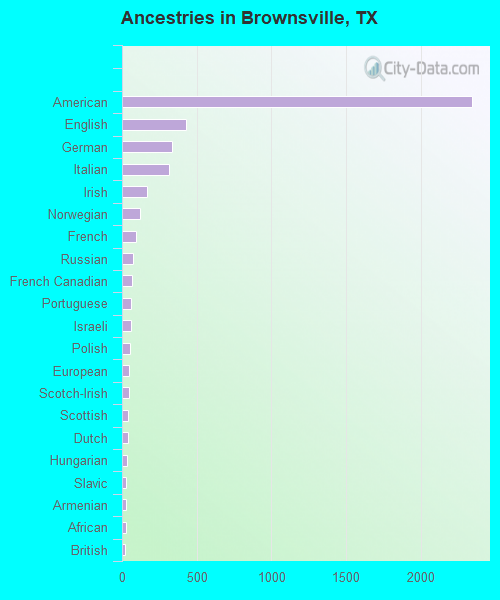
Ancestries in Brownsville
2,341 1.5% American432 0.3% English335 0.2% German313 0.2% Italian170 0.1% Irish120 0.08% Norwegian92 0.06% French72 0.05% Russian66 0.04% French Canadian61 0.04% Portuguese60 0.04% Israeli56 0.04% Polish46 0.03% European45 0.03% Scotch-Irish38 0.02% Scottish37 0.02% Dutch31 0.02% Hungarian30 0.02% Slavic27 0.02% Armenian25 0.02% African23 0.01% British20 0.01% Eastern European18 0.01% Czechoslovakian18 0.01% Ukrainian17 0.01% Canadian17 0.01% Nigerian14 0.01% Lebanese14 0.01% Czech14 0.01% Slovak12 0.01% Finnish9 0.01% Cajun9 0.01% Welsh
Geographical mobility in Brownsville Same house 1 year ago 43,428 88.6% White (Caucasian)778 68.1% Black or African American611 85.4% American Indian / Alaska Native891 68.6% Asian135 98.2% Native Hawaiian / Pacific Islander14,378 80.6% Other race102,278 90.5% Two or more races6,512 85.0% White alone, not Hispanic / Latino157,590 88.9% Hispanic or LatinoMoved within same county 2,919 6.0% White / Caucasian211 18.5% Black or African American42 5.8% American Indian / Alaska Native296 22.8% Asian2,578 14.4% Other race10,159 9.0% Two or more races259 3.4% White alone, not Hispanic / Latino15,437 8.7% Hispanic or LatinoMoved within same state 881 1.8% White / Caucasian111 9.7% Black or African American19 2.7% American Indian / Alaska Native40 3.1% Asian552 3.1% Other race503 0.4% Two or more races469 6.1% White alone, not Hispanic / Latino1,910 1.1% Hispanic or LatinoMoved from different state 902 1.8% White / Caucasian42 3.7% Black or African American51 7.1% American Indian / Alaska Native11 0.8% Asian209 1.2% Other race303 0.3% Two or more races617 8.0% White alone, not Hispanic / Latino628 0.4% Hispanic or LatinoMoved from abroad 904 1.8% White22 1.7% Asian124 0.7% Other race439 0.4% Two or more races8 0.1% White alone, not Hispanic / Latino1,745 1.0% Hispanic or Latino
Children Nativity (place of birth) in Brownsville
Children under 6 years - Living with two parents Both parents native 5,748 100.0% NativeBoth parents foreign-born 1,051 91.2% Native102 8.8% Foreign-bornOne native, one foreign-born parent 2,209 100.0% NativeChildren under 6 years - Living with one parent Native parent 7,897 100.0% NativeForeign-born parent 989 100.0% NativeChildren 6 to 17 years - Living with two parents Both parents native 7,541 100.0% NativeBoth parents foreign-born 6,900 93.6% Native470 6.4% Foreign-bornOne native, one foreign-born parent 4,650 93.2% Native341 6.8% Foreign-bornChildren 6 to 17 years - Living with one parent Native parent 10,604 100.0% NativeForeign-born parent 5,508 52.5% Native4,979 47.5% Foreign-born
Grandparents responsible for own grandchildren in Brownsville
Grandparents (30 to 59 years) White / Caucasian 398 33.9% Responsible for grandchildren777 66.1% Not responsible for grandchildrenBlack or African American 8 100.0% Responsible for grandchildrenAmerican Indian / Alaska Native 22 100.0% Responsible for grandchildrenOther race 60 44.3% Responsible for grandchildren75 55.7% Not responsible for grandchildrenTwo or more races 547 36.9% Responsible for grandchildren935 63.1% Not responsible for grandchildrenWhite alone, not Hispanic / Latino 6 12.3% Responsible for grandchildren41 87.7% Not responsible for grandchildrenHispanic or Latino 740 25.9% Responsible for grandchildren2,120 74.1% Not responsible for grandchildrenGrandparents (60 years and over) White / Caucasian 121 9.7% Responsible for grandchildren1,133 90.3% Not responsible for grandchildrenBlack or African American 5 100.0% Not responsible for grandchildrenOther race 367 36.1% Responsible for grandchildren651 63.9% Not responsible for grandchildrenTwo or more races 476 28.3% Responsible for grandchildren1,206 71.7% Not responsible for grandchildrenWhite alone, not Hispanic / Latino 36 18.0% Responsible for grandchildren162 82.0% Not responsible for grandchildrenHispanic or Latino 663 23.7% Responsible for grandchildren2,136 76.3% Not responsible for grandchildren