Races in Brooklyn Park, Maryland (MD) Detailed Stats
Data:
Races - White alone (%)
Races - White alone (% change since 2000)
Races - Black alone (%)
Races - Black alone (% change since 2000)
Races - American Indian alone (%)
Races - American Indian alone (% change since 2000)
Races - Asian alone (%)
Races - Asian alone (% change since 2000)
Races - Hispanic (%)
Races - Hispanic (% change since 2000)
Races - Native Hawaiian and Other Pacific Islander alone (%)
Races - Native Hawaiian and Other Pacific Islander alone (% change since 2000)
Races - Two or more races(%)
Races - Two or more races(% change since 2000)
Races - Other race alone (%)
Races - Other race alone (% change since 2000)
Racial diversity
Place of birth - Born in state of residence (%)
Place of birth - Born in state of residence (%) - White
Place of birth - Born in state of residence (%) - Black or African American
Place of birth - Born in state of residence (%) - Asian
Place of birth - Born in state of residence (%) - Hispanic or Latino
Place of birth - Born in state of residence (%) - American Indian and Alaska Native
Place of birth - Born in state of residence (%) - Multirace
Place of birth - Born in state of residence (%) - Other Race
Place of birth - Born in other state (%)
Place of birth - Born in other state (%) - White
Place of birth - Born in other state (%) - Black or African American
Place of birth - Born in other state (%) - Asian
Place of birth - Born in other state (%) - Hispanic or Latino
Place of birth - Born in other state (%) - American Indian and Alaska Native
Place of birth - Born in other state (%) - Multirace
Place of birth - Born in other state (%) - Other Race
Place of birth - Native, outside of US (%)
Place of birth - Native, outside of US (%) - White
Place of birth - Native, outside of US (%) - Black or African American
Place of birth - Native, outside of US (%) - Asian
Place of birth - Native, outside of US (%) - Hispanic or Latino
Place of birth - Native, outside of US (%) - American Indian and Alaska Native
Place of birth - Native, outside of US (%) - Multirace
Place of birth - Native, outside of US (%) - Other Race
Place of birth - Foreign born (%)
Place of birth - Foreign born (%) - White
Place of birth - Foreign born (%) - Black or African American
Place of birth - Foreign born (%) - Asian
Place of birth - Foreign born (%) - Hispanic or Latino
Place of birth - Foreign born (%) - American Indian and Alaska Native
Place of birth - Foreign born (%) - Multirace
Place of birth - Foreign born (%) - Other Race
Residents speaking English at home (%)
Residents speaking English at home - Born in the United States (%)
Residents speaking English at home - Native, born elsewhere (%)
Residents speaking English at home - Foreign born (%)
Residents speaking Spanish at home (%)
Residents speaking Spanish at home - Born in the United States (%)
Residents speaking Spanish at home - Native, born elsewhere (%)
Residents speaking Spanish at home - Foreign born (%)
Residents speaking other language at home (%)
Residents speaking other language at home - Born in the United States (%)
Residents speaking other language at home - Native, born elsewhere (%)
Residents speaking other language at home - Foreign born (%)
Marital status - Never married (%)
Marital status - Now married (%)
Marital status - Separated (%)
Marital status - Widowed (%)
Marital status - Divorced (%)
Ancestries Reported - Arab (%)
Ancestries Reported - Czech (%)
Ancestries Reported - Danish (%)
Ancestries Reported - Dutch (%)
Ancestries Reported - English (%)
Ancestries Reported - French (%)
Ancestries Reported - French Canadian (%)
Ancestries Reported - German (%)
Ancestries Reported - Greek (%)
Ancestries Reported - Hungarian (%)
Ancestries Reported - Irish (%)
Ancestries Reported - Italian (%)
Ancestries Reported - Lithuanian (%)
Ancestries Reported - Norwegian (%)
Ancestries Reported - Polish (%)
Ancestries Reported - Portuguese (%)
Ancestries Reported - Russian (%)
Ancestries Reported - Scotch-Irish (%)
Ancestries Reported - Scottish (%)
Ancestries Reported - Slovak (%)
Ancestries Reported - Subsaharan African (%)
Ancestries Reported - Swedish (%)
Ancestries Reported - Swiss (%)
Ancestries Reported - Ukrainian (%)
Ancestries Reported - United States (%)
Ancestries Reported - Welsh (%)
Ancestries Reported - West Indian (%)
Ancestries Reported - Other (%)
Geographical mobility - Same house 1 year ago (%)
Geographical mobility - Same house 1 year ago (%) - White
Geographical mobility - Same house 1 year ago (%) - Black or African American
Geographical mobility - Same house 1 year ago (%) - Asian
Geographical mobility - Same house 1 year ago (%) - Hispanic or Latino
Geographical mobility - Same house 1 year ago (%) - American Indian and Alaska Native
Geographical mobility - Same house 1 year ago (%) - Multirace
Geographical mobility - Same house 1 year ago (%) - Other Race
Geographical mobility - Moved within same county (%)
Geographical mobility - Moved within same county (%) - White
Geographical mobility - Moved within same county (%) - Black or African American
Geographical mobility - Moved within same county (%) - Asian
Geographical mobility - Moved within same county (%) - Hispanic or Latino
Geographical mobility - Moved within same county (%) - American Indian and Alaska Native
Geographical mobility - Moved within same county (%) - Multirace
Geographical mobility - Moved within same county (%) - Other Race
Geographical mobility - Moved from different county within same state (%)
Geographical mobility - Moved from different county within same state (%) - White
Geographical mobility - Moved from different county within same state (%) - Black or African American
Geographical mobility - Moved from different county within same state (%) - Asian
Geographical mobility - Moved from different county within same state (%) - Hispanic or Latino
Geographical mobility - Moved from different county within same state (%) - American Indian and Alaska Native
Geographical mobility - Moved from different county within same state (%) - Multirace
Geographical mobility - Moved from different county within same state (%) - Other Race
Geographical mobility - Moved from different state (%)
Geographical mobility - Moved from different state (%) - White
Geographical mobility - Moved from different state (%) - Black or African American
Geographical mobility - Moved from different state (%) - Asian
Geographical mobility - Moved from different state (%) - Hispanic or Latino
Geographical mobility - Moved from different state (%) - American Indian and Alaska Native
Geographical mobility - Moved from different state (%) - Multirace
Geographical mobility - Moved from different state (%) - Other Race
Geographical mobility - Moved from abroad (%)
Geographical mobility - Moved from abroad (%) - White
Geographical mobility - Moved from abroad (%) - Black or African American
Geographical mobility - Moved from abroad (%) - Asian
Geographical mobility - Moved from abroad (%) - Hispanic or Latino
Geographical mobility - Moved from abroad (%) - American Indian and Alaska Native
Geographical mobility - Moved from abroad (%) - Multirace
Geographical mobility - Moved from abroad (%) - Other Race
Place of birth for the foreign-born population - Ireland (%)
Place of birth for the foreign-born population - Denmark (%)
Place of birth for the foreign-born population - Norway (%)
Place of birth for the foreign-born population - Sweden (%)
Place of birth for the foreign-born population - United Kingdom (%)
Place of birth for the foreign-born population - England (%)
Place of birth for the foreign-born population - Scotland (%)
Place of birth for the foreign-born population - Other Northern Europe (%)
Place of birth for the foreign-born population - Austria (%)
Place of birth for the foreign-born population - Belgium (%)
Place of birth for the foreign-born population - France (%)
Place of birth for the foreign-born population - Germany (%)
Place of birth for the foreign-born population - Netherlands (%)
Place of birth for the foreign-born population - Switzerland (%)
Place of birth for the foreign-born population - Other Western Europe (%)
Place of birth for the foreign-born population - Greece (%)
Place of birth for the foreign-born population - Italy (%)
Place of birth for the foreign-born population - Portugal (%)
Place of birth for the foreign-born population - Spain (%)
Place of birth for the foreign-born population - Other Southern Europe (%)
Place of birth for the foreign-born population - Albania (%)
Place of birth for the foreign-born population - Belarus (%)
Place of birth for the foreign-born population - Bosnia and Herzegovina (%)
Place of birth for the foreign-born population - Bulgaria (%)
Place of birth for the foreign-born population - Croatia (%)
Place of birth for the foreign-born population - Czechoslovakia (%)
Place of birth for the foreign-born population - Hungary (%)
Place of birth for the foreign-born population - Latvia (%)
Place of birth for the foreign-born population - Lithuania (%)
Place of birth for the foreign-born population - North Macedonia (Macedonia) (%)
Place of birth for the foreign-born population - Moldova (%)
Place of birth for the foreign-born population - Poland (%)
Place of birth for the foreign-born population - Romania (%)
Place of birth for the foreign-born population - Russia (%)
Place of birth for the foreign-born population - Serbia (%)
Place of birth for the foreign-born population - Ukraine (%)
Place of birth for the foreign-born population - Other Eastern Europe (%)
Place of birth for the foreign-born population - China (%)
Place of birth for the foreign-born population - Hong Kong (%)
Place of birth for the foreign-born population - Taiwan (%)
Place of birth for the foreign-born population - Japan (%)
Place of birth for the foreign-born population - Korea (%)
Place of birth for the foreign-born population - Other Eastern Asia (%)
Place of birth for the foreign-born population - Afghanistan (%)
Place of birth for the foreign-born population - Bangladesh (%)
Place of birth for the foreign-born population - India (%)
Place of birth for the foreign-born population - Iran (%)
Place of birth for the foreign-born population - Kazakhstan (%)
Place of birth for the foreign-born population - Nepal (%)
Place of birth for the foreign-born population - Pakistan (%)
Place of birth for the foreign-born population - Sri Lanka (%)
Place of birth for the foreign-born population - Uzbekistan (%)
Place of birth for the foreign-born population - Other South Central Asia (%)
Place of birth for the foreign-born population - Burma (%)
Place of birth for the foreign-born population - Cambodia (%)
Place of birth for the foreign-born population - Indonesia (%)
Place of birth for the foreign-born population - Laos (%)
Place of birth for the foreign-born population - Malaysia (%)
Place of birth for the foreign-born population - Philippines (%)
Place of birth for the foreign-born population - Singapore (%)
Place of birth for the foreign-born population - Thailand (%)
Place of birth for the foreign-born population - Vietnam (%)
Place of birth for the foreign-born population - Other South Eastern Asia (%)
Place of birth for the foreign-born population - Armenia (%)
Place of birth for the foreign-born population - Iraq (%)
Place of birth for the foreign-born population - Israel (%)
Place of birth for the foreign-born population - Jordan (%)
Place of birth for the foreign-born population - Kuwait (%)
Place of birth for the foreign-born population - Lebanon (%)
Place of birth for the foreign-born population - Saudi Arabia (%)
Place of birth for the foreign-born population - Syria (%)
Place of birth for the foreign-born population - Turkey (%)
Place of birth for the foreign-born population - Yemen (%)
Place of birth for the foreign-born population - Other Western Asia (%)
Place of birth for the foreign-born population - Eritrea (%)
Place of birth for the foreign-born population - Ethiopia (%)
Place of birth for the foreign-born population - Kenya (%)
Place of birth for the foreign-born population - Somalia (%)
Place of birth for the foreign-born population - Uganda (%)
Place of birth for the foreign-born population - Zimbabwe (%)
Place of birth for the foreign-born population - Other Eastern Africa (%)
Place of birth for the foreign-born population - Cameroon (%)
Place of birth for the foreign-born population - Congo (%)
Place of birth for the foreign-born population - Democratic Republic of Congo (Zaire) (%)
Place of birth for the foreign-born population - Other Middle Africa (%)
Place of birth for the foreign-born population - Egypt (%)
Place of birth for the foreign-born population - Morocco (%)
Place of birth for the foreign-born population - Sudan (%)
Place of birth for the foreign-born population - Other Northern Africa (%)
Place of birth for the foreign-born population - South Africa (%)
Place of birth for the foreign-born population - Other Southern Africa (%)
Place of birth for the foreign-born population - Cabo Verde (%)
Place of birth for the foreign-born population - Ghana (%)
Place of birth for the foreign-born population - Liberia (%)
Place of birth for the foreign-born population - Nigeria (%)
Place of birth for the foreign-born population - Senegal (%)
Place of birth for the foreign-born population - Sierra Leone (%)
Place of birth for the foreign-born population - Other Western Africa (%)
Place of birth for the foreign-born population - Australia (%)
Place of birth for the foreign-born population - New Zealand (%)
Place of birth for the foreign-born population - Fiji (%)
Place of birth for the foreign-born population - Micronesia (%)
Place of birth for the foreign-born population - Bahamas (%)
Place of birth for the foreign-born population - Barbados (%)
Place of birth for the foreign-born population - Cuba (%)
Place of birth for the foreign-born population - Dominica (%)
Place of birth for the foreign-born population - Dominican Republic (%)
Place of birth for the foreign-born population - Grenada (%)
Place of birth for the foreign-born population - Haiti (%)
Place of birth for the foreign-born population - Jamaica (%)
Place of birth for the foreign-born population - St. Vincent and the Grenadines (%)
Place of birth for the foreign-born population - Trinidad and Tobago (%)
Place of birth for the foreign-born population - West Indies (%)
Place of birth for the foreign-born population - Other Caribbean (%)
Place of birth for the foreign-born population - Belize (%)
Place of birth for the foreign-born population - Costa Rica (%)
Place of birth for the foreign-born population - El Salvador (%)
Place of birth for the foreign-born population - Guatemala (%)
Place of birth for the foreign-born population - Honduras (%)
Place of birth for the foreign-born population - Mexico (%)
Place of birth for the foreign-born population - Nicaragua (%)
Place of birth for the foreign-born population - Panama (%)
Place of birth for the foreign-born population - Other Central America (%)
Place of birth for the foreign-born population - Argentina (%)
Place of birth for the foreign-born population - Bolivia (%)
Place of birth for the foreign-born population - Brazil (%)
Place of birth for the foreign-born population - Chile (%)
Place of birth for the foreign-born population - Colombia (%)
Place of birth for the foreign-born population - Ecuador (%)
Place of birth for the foreign-born population - Guyana (%)
Place of birth for the foreign-born population - Peru (%)
Place of birth for the foreign-born population - Uruguay (%)
Place of birth for the foreign-born population - Venezuela (%)
Place of birth for the foreign-born population - Other South America (%)
Place of birth for the foreign-born population - Canada (%)
Place of birth for the foreign-born population - Other Northern America (%)
Place of birth for the foreign-born population - Other (%)
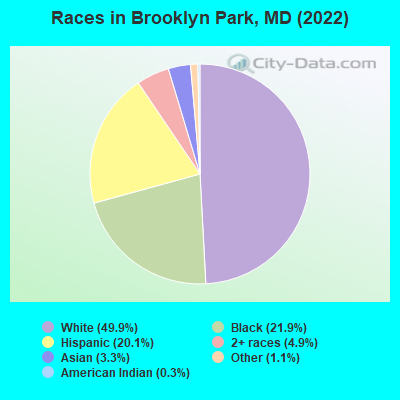
According to 2022 data, the most numerous races in Brooklyn Park, MD are White alone (8,004 residents), Black alone (3,513 residents), and Hispanic (3,220 residents). 76.9% of Brooklyn Park residents speak English at home. 15.4% of Brooklyn Park, MD residents are foreign-born (9.5% born in Latin America, 2.5% born in Africa, 2.1% born in Asia), which is 3.6% less than the foreign-born rate of 16.0% across the entire state of Maryland.
Race distribution in Brooklyn Park
2000 2022
3,286,547 62.1% White alone 1,464,735 27.7% Black alone 227,916 4.3% Hispanic 209,738 4.0% Asian alone 82,946 1.6% Two or more races 13,312 0.3% American Indian alone 9,379 0.2% Other race alone 1,913 0.04% Native Hawaiian and Other
2,906,492 47.1% White alone 1,800,914 29.2% Black alone 705,842 11.4% Hispanic 401,818 6.5% Asian alone 291,317 4.7% Two or more races 46,930 0.8% Other race alone 8,930 0.1% American Indian alone 2,417 0.04% Native Hawaiian and Other
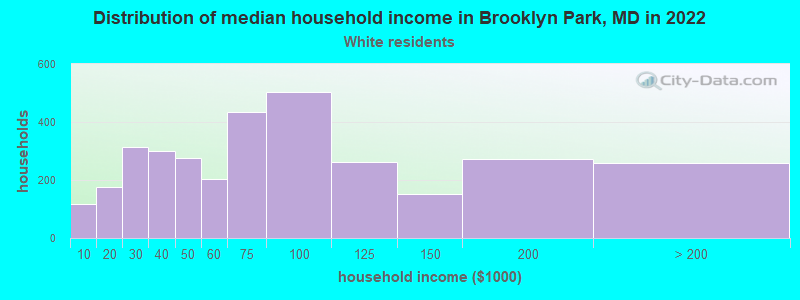
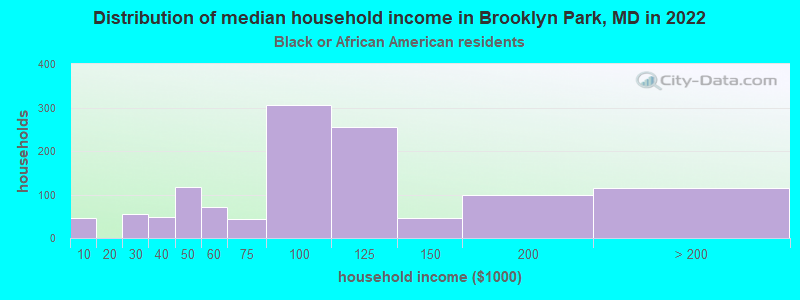
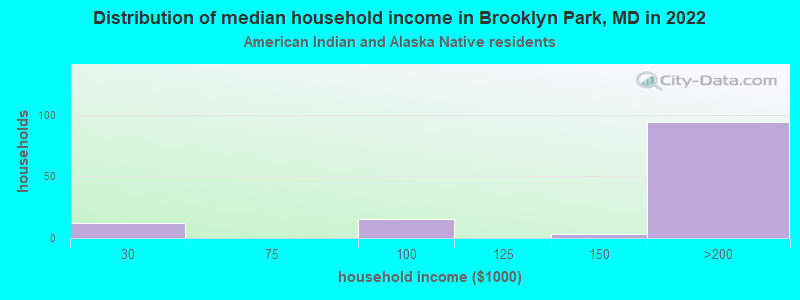
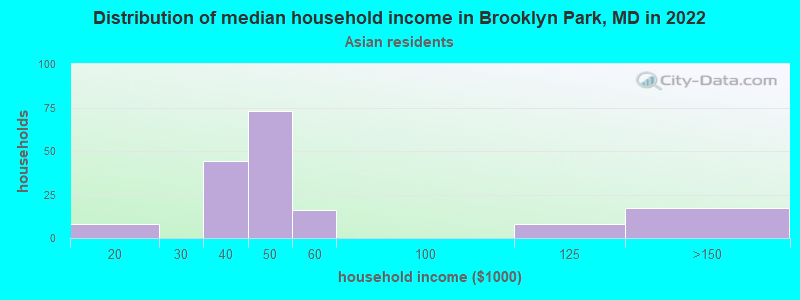
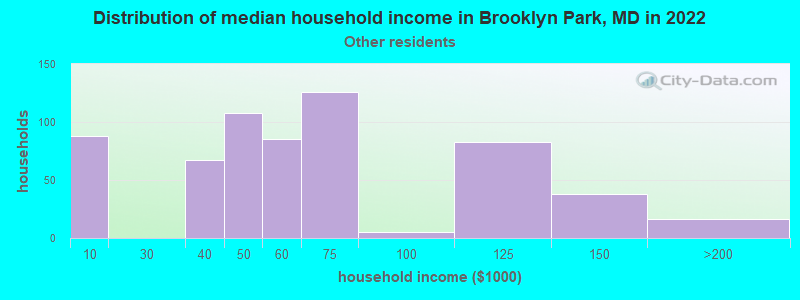
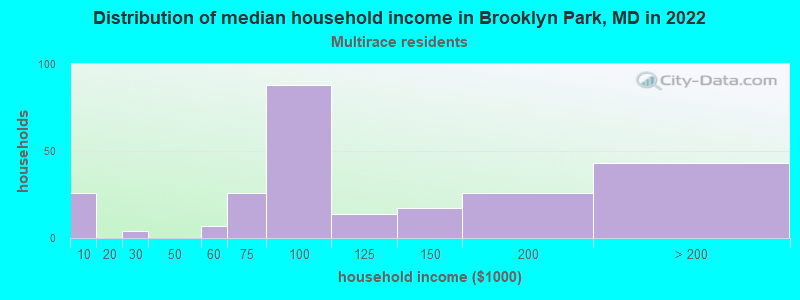
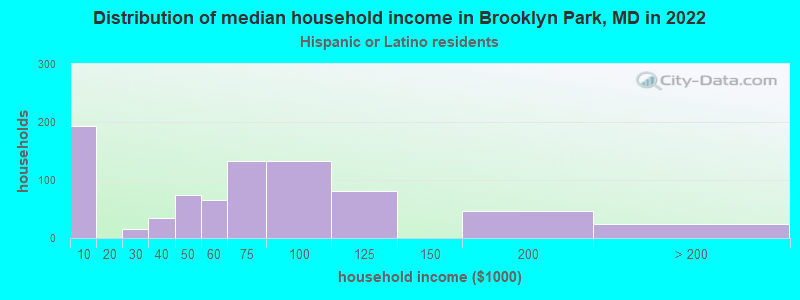
Income and house value in Brooklyn Park Median household income in 2022 $69,300 White non-Hispanic householders$81,473 Black householdersover $200,000 American Indian and Alaska Native householders$39,485 Asian householders$58,982 Some other race householders$90,400 Two or more races householders$66,832 Hispanic or Latino race householdersMedian 2022 house value $248,309 White Non-Hispanic householders$224,888 Black or African American householders$188,876 American Indian or Alaska Native householders $295,402 Asian householders$173,262 Some other race householders$579,220 Two or more races householders$493,092 Hispanic or Latino householders
Median age by race in Brooklyn Park
46.6 Median age for White residents50.3 44.9 41.2 Median age for Black or African American residents38.6 44.4 30.6 Median age for American Indian / Alaska Native residents36.7 39.1 37.4 Median age for Asian residents42.2 28.1 -534,101,824.6 Median age for Native Hawaiian / Pacific Islander residents-720,061,021.4 -760,942,760.2 33.7 Median age for Other race residents22.5 40.2 24.4 Median age for Two or more races residents27.8 21.0 47.5 Median age for White alone residents49.9 45.8 30.0 Median age for Hispanic or Latino residents27.0 31.2
Owner/renter occupied households by race in Brooklyn Park
House owners and renters - White residents 2,851 87.2% Owner occupied420 12.8% Renter occupiedHouse owners and renters - Black or African American residents 784 61.3% Owner occupied496 38.7% Renter occupiedHouse owners and renters - American Indian / Alaska Native residents 105 96.5% Owner occupied4 3.5% Renter occupiedHouse owners and renters - Asian residents 154 95.8% Owner occupied7 4.2% Renter occupiedHouse owners and renters - Other race residents 616 83.4% Owner occupied122 16.6% Renter occupiedHouse owners and renters - Two or more races residents 235 94.8% Owner occupied13 5.2% Renter occupiedHouse owners and renters - White alone residents 2,812 86.8% Owner occupied427 13.2% Renter occupiedHouse owners and renters - Hispanic or Latino residents 735 83.7% Owner occupied143 16.3% Renter occupied
Language usage in Brooklyn Park
English speakers - Total 76.9% of residents of Brooklyn Park speak English at home.
16.7% of residents speak Spanish at home 1,366 54.7% Speak English very well1,133 45.3% Speak English less than very well7.2% of residents speak other language at home 793 73.8% Speak English very well281 26.2% Speak English less than very well
English speakers - Born in the United States 81.0% of residents of Brooklyn Park speak English at home.
14.5% of residents speak Spanish at home 412 95.8% Speak English very well18 4.2% Speak English less than very well3.5% of residents speak other language at home 48 45.7% Speak English very well57 54.3% Speak English less than very well
English speakers - Native, born elsewhere 43.0% of residents of Brooklyn Park speak English at home.
66.0% of residents speak other language at home 278 100.0% Speak English very well
English speakers - Foreign-born 12.7% of residents of Brooklyn Park speak English at home.
66.2% of residents speak Spanish at home 373 23.5% Speak English very well1,217 76.5% Speak English less than very well26.0% of residents speak other language at home 430 68.9% Speak English very well194 31.1% Speak English less than very well
White (Caucasian) - Speak only English Native:
97.1% (7,429)Foreign-born:
18.9% (17)
White (Caucasian) - Speak another language Native:
2.8% (217)Foreign-born:
74.5% (68)
Black or African American - Speak only English Native:
90.0% (2,633)Foreign-born:
39.7% (204)
Black or African American - Speak another language Native:
11.1% (325)Foreign-born:
60.0% (308)
American Indian / Alaska Native - Speak another language Native:
74.3% (217)Foreign-born:
100.0% (235)
Asian - Speak only English Native:
55.7% (32)Foreign-born:
11.8% (49)
Asian - Speak another language Native:
44.3% (26)Foreign-born:
88.3% (367)
Other race - Speak only English Native:
21.5% (183)Foreign-born:
2.9% (45)
Other race - Speak another language Native:
81.4% (692)Foreign-born:
100.0% (1,563)
Two or more races - Speak another language Native:
5.7% (56)Foreign-born:
88.6% (69)
White alone - Speak only English Native:
97.3% (7,384)Foreign-born:
35.0% (19)
White alone - Speak another language Native:
2.7% (203)Foreign-born:
65.0% (35)
Hispanic or Latino - Speak only English Native:
31.1% (376)Foreign-born:
3.8% (59)
Hispanic or Latino - Speak another language Native:
67.9% (822)Foreign-born:
98.2% (1,547)
Foreign-born residents in Brooklyn Park 2,477 residents are foreign born (9.5% Latin America , 2.5% Africa , 2.1% Asia ).
This city:
15.4%Maryland:
15.7%
Marital status for residents in Brooklyn Park Marital status - White (Caucasian) population 15 years and over
Males 33.1% Never married45.6% Now married3.0% Separated6.3% Widowed12.0% DivorcedFemales 28.8% Never married46.3% Now married1.6% Separated10.3% Widowed13.0% DivorcedWomen who gave birth in the past 12 months Now married:
65.0% (72)Unmarried:
35.0% (39)
Women who did not give birth in the past 12 months Now married:
41.4% (651)Unmarried:
58.6% (922)
Marital status - Black or African American population 15 years and over
Males 46.3% Never married39.3% Now married2.5% Separated0.3% Widowed11.5% DivorcedFemales 41.5% Never married37.3% Now married3.5% Separated3.8% Widowed14.0% DivorcedWomen who gave birth in the past 12 months Now married:
100.0% (19)Unmarried:
0.0% (0)
Women who did not give birth in the past 12 months Now married:
31.5% (276)Unmarried:
68.5% (600)
Marital status - American Indian / Alaska Native population 15 years and over
Males 46.8% Never married51.4% Now married0.0% Separated1.8% Widowed0.0% DivorcedFemales 65.2% Never married34.8% Now married0.0% Separated0.0% Widowed0.0% DivorcedWomen who did not give birth in the past 12 months Now married:
36.5% (93)Unmarried:
63.5% (161)
Marital status - Asian population 15 years and over
Males 32.3% Never married56.2% Now married0.0% Separated0.0% Widowed11.5% DivorcedFemales 27.2% Never married38.9% Now married4.3% Separated0.0% Widowed29.6% DivorcedWomen who gave birth in the past 12 months Now married:
100.0% (16)Unmarried:
0.0% (0)
Women who did not give birth in the past 12 months Now married:
31.0% (31)Unmarried:
69.0% (68)
Marital status - Other race population 15 years and over
Males 39.2% Never married55.9% Now married2.1% Separated0.6% Widowed2.2% DivorcedFemales 44.6% Never married37.1% Now married0.0% Separated12.0% Widowed6.3% DivorcedWomen who did not give birth in the past 12 months Now married:
38.7% (314)Unmarried:
61.3% (498)
Marital status - Two or more races population 15 years and over
Males 65.7% Never married24.7% Now married4.9% Separated0.0% Widowed4.6% DivorcedFemales 41.3% Never married52.7% Now married0.0% Separated5.7% Widowed0.3% DivorcedWomen who gave birth in the past 12 months Now married:
0.0% (0)Unmarried:
100.0% (38)
Women who did not give birth in the past 12 months Now married:
55.1% (169)Unmarried:
44.9% (138)
Marital status - White alone, not Hispanic / Latino population 15 years and over
Males 33.6% Never married44.7% Now married3.0% Separated6.4% Widowed12.2% DivorcedFemales 28.9% Never married45.5% Now married1.6% Separated10.6% Widowed13.4% DivorcedWomen who gave birth in the past 12 months Now married:
65.0% (74)Unmarried:
35.0% (40)
Women who did not give birth in the past 12 months Now married:
39.9% (613)Unmarried:
60.1% (923)
Marital status - Hispanic or Latino population 15 years and over
Males 37.4% Never married59.0% Now married1.7% Separated0.0% Widowed1.8% DivorcedFemales 43.8% Never married44.1% Now married0.0% Separated7.8% Widowed4.3% DivorcedWomen who gave birth in the past 12 months Now married:
0.0% (0)Unmarried:
100.0% (14)
Women who did not give birth in the past 12 months Now married:
44.2% (471)Unmarried:
55.8% (594)
Ancestries in Brooklyn Park
882 9.9% English639 7.2% German589 6.6% American497 5.6% Irish231 2.6% Ghanaian171 1.9% Italian153 1.7% Polish111 1.2% European109 1.2% Nigerian82 0.9% Albanian38 0.4% Slovak28 0.3% Swedish26 0.3% French24 0.3% Ukrainian20 0.2% Scotch-Irish19 0.2% Portuguese18 0.2% Hungarian17 0.2% African15 0.2% Dutch13 0.1% Yugoslavian12 0.1% Jamaican9 0.1% Czech9 0.1% Greek7 0.08% Czechoslovakian6 0.07% Kenyan5 0.06% French Canadian
Geographical mobility in Brooklyn Park Same house 1 year ago 7,592 94.5% White (Caucasian)3,404 96.1% Black or African American509 95.7% American Indian / Alaska Native473 91.3% Asian2,392 92.3% Other race1,147 100.0% Two or more races7,419 94.4% White alone, not Hispanic / Latino3,109 96.5% Hispanic or LatinoMoved within same county 248 3.1% White / Caucasian139 3.9% Black or African American114 4.4% Other race18 1.5% Two or more races218 2.8% White alone, not Hispanic / Latino113 3.5% Hispanic or LatinoMoved within same state 100 1.2% White / Caucasian35 1.0% Black or African American143 5.5% Other race6 0.5% Two or more races118 1.5% White alone, not Hispanic / Latino84 2.6% Hispanic or LatinoMoved from different state 61 0.8% White / Caucasian11 0.3% Black or African American12 2.3% American Indian / Alaska Native62 0.8% White alone, not Hispanic / Latino16 0.5% Hispanic or LatinoMoved from abroad 9 0.1% White10 0.1% White alone, not Hispanic / Latino
Children Nativity (place of birth) in Brooklyn Park
Children under 6 years - Living with two parents Both parents native 344 100.0% NativeBoth parents foreign-born 364 100.0% NativeOne native, one foreign-born parent 59 100.0% NativeChildren under 6 years - Living with one parent Native parent 206 100.0% NativeForeign-born parent 121 100.0% NativeChildren 6 to 17 years - Living with two parents Both parents native 930 97.7% Native22 2.3% Foreign-bornBoth parents foreign-born 454 86.4% Native71 13.6% Foreign-bornOne native, one foreign-born parent 28 43.7% Native36 56.3% Foreign-bornChildren 6 to 17 years - Living with one parent Native parent 477 100.0% NativeForeign-born parent 304 57.5% Native225 42.5% Foreign-born
Grandparents responsible for own grandchildren in Brooklyn Park
Grandparents (30 to 59 years) White / Caucasian 37 68.3% Responsible for grandchildren17 31.7% Not responsible for grandchildrenBlack or African American 60 94.0% Responsible for grandchildren4 6.0% Not responsible for grandchildrenWhite alone, not Hispanic / Latino 37 67.7% Responsible for grandchildren18 32.3% Not responsible for grandchildrenGrandparents (60 years and over) White / Caucasian 19 10.1% Responsible for grandchildren167 89.9% Not responsible for grandchildrenBlack or African American 56 46.7% Responsible for grandchildren64 53.3% Not responsible for grandchildrenWhite alone, not Hispanic / Latino 20 10.2% Responsible for grandchildren172 89.8% Not responsible for grandchildren