Races in Brookfield, Illinois (IL) Detailed Stats
Data:
Races - White alone (%)
Races - White alone (% change since 2000)
Races - Black alone (%)
Races - Black alone (% change since 2000)
Races - American Indian alone (%)
Races - American Indian alone (% change since 2000)
Races - Asian alone (%)
Races - Asian alone (% change since 2000)
Races - Hispanic (%)
Races - Hispanic (% change since 2000)
Races - Native Hawaiian and Other Pacific Islander alone (%)
Races - Native Hawaiian and Other Pacific Islander alone (% change since 2000)
Races - Two or more races(%)
Races - Two or more races(% change since 2000)
Races - Other race alone (%)
Races - Other race alone (% change since 2000)
Racial diversity
Place of birth - Born in state of residence (%)
Place of birth - Born in state of residence (%) - White
Place of birth - Born in state of residence (%) - Black or African American
Place of birth - Born in state of residence (%) - Asian
Place of birth - Born in state of residence (%) - Hispanic or Latino
Place of birth - Born in state of residence (%) - American Indian and Alaska Native
Place of birth - Born in state of residence (%) - Multirace
Place of birth - Born in state of residence (%) - Other Race
Place of birth - Born in other state (%)
Place of birth - Born in other state (%) - White
Place of birth - Born in other state (%) - Black or African American
Place of birth - Born in other state (%) - Asian
Place of birth - Born in other state (%) - Hispanic or Latino
Place of birth - Born in other state (%) - American Indian and Alaska Native
Place of birth - Born in other state (%) - Multirace
Place of birth - Born in other state (%) - Other Race
Place of birth - Native, outside of US (%)
Place of birth - Native, outside of US (%) - White
Place of birth - Native, outside of US (%) - Black or African American
Place of birth - Native, outside of US (%) - Asian
Place of birth - Native, outside of US (%) - Hispanic or Latino
Place of birth - Native, outside of US (%) - American Indian and Alaska Native
Place of birth - Native, outside of US (%) - Multirace
Place of birth - Native, outside of US (%) - Other Race
Place of birth - Foreign born (%)
Place of birth - Foreign born (%) - White
Place of birth - Foreign born (%) - Black or African American
Place of birth - Foreign born (%) - Asian
Place of birth - Foreign born (%) - Hispanic or Latino
Place of birth - Foreign born (%) - American Indian and Alaska Native
Place of birth - Foreign born (%) - Multirace
Place of birth - Foreign born (%) - Other Race
Residents speaking English at home (%)
Residents speaking English at home - Born in the United States (%)
Residents speaking English at home - Native, born elsewhere (%)
Residents speaking English at home - Foreign born (%)
Residents speaking Spanish at home (%)
Residents speaking Spanish at home - Born in the United States (%)
Residents speaking Spanish at home - Native, born elsewhere (%)
Residents speaking Spanish at home - Foreign born (%)
Residents speaking other language at home (%)
Residents speaking other language at home - Born in the United States (%)
Residents speaking other language at home - Native, born elsewhere (%)
Residents speaking other language at home - Foreign born (%)
Marital status - Never married (%)
Marital status - Now married (%)
Marital status - Separated (%)
Marital status - Widowed (%)
Marital status - Divorced (%)
Ancestries Reported - Arab (%)
Ancestries Reported - Czech (%)
Ancestries Reported - Danish (%)
Ancestries Reported - Dutch (%)
Ancestries Reported - English (%)
Ancestries Reported - French (%)
Ancestries Reported - French Canadian (%)
Ancestries Reported - German (%)
Ancestries Reported - Greek (%)
Ancestries Reported - Hungarian (%)
Ancestries Reported - Irish (%)
Ancestries Reported - Italian (%)
Ancestries Reported - Lithuanian (%)
Ancestries Reported - Norwegian (%)
Ancestries Reported - Polish (%)
Ancestries Reported - Portuguese (%)
Ancestries Reported - Russian (%)
Ancestries Reported - Scotch-Irish (%)
Ancestries Reported - Scottish (%)
Ancestries Reported - Slovak (%)
Ancestries Reported - Subsaharan African (%)
Ancestries Reported - Swedish (%)
Ancestries Reported - Swiss (%)
Ancestries Reported - Ukrainian (%)
Ancestries Reported - United States (%)
Ancestries Reported - Welsh (%)
Ancestries Reported - West Indian (%)
Ancestries Reported - Other (%)
Geographical mobility - Same house 1 year ago (%)
Geographical mobility - Same house 1 year ago (%) - White
Geographical mobility - Same house 1 year ago (%) - Black or African American
Geographical mobility - Same house 1 year ago (%) - Asian
Geographical mobility - Same house 1 year ago (%) - Hispanic or Latino
Geographical mobility - Same house 1 year ago (%) - American Indian and Alaska Native
Geographical mobility - Same house 1 year ago (%) - Multirace
Geographical mobility - Same house 1 year ago (%) - Other Race
Geographical mobility - Moved within same county (%)
Geographical mobility - Moved within same county (%) - White
Geographical mobility - Moved within same county (%) - Black or African American
Geographical mobility - Moved within same county (%) - Asian
Geographical mobility - Moved within same county (%) - Hispanic or Latino
Geographical mobility - Moved within same county (%) - American Indian and Alaska Native
Geographical mobility - Moved within same county (%) - Multirace
Geographical mobility - Moved within same county (%) - Other Race
Geographical mobility - Moved from different county within same state (%)
Geographical mobility - Moved from different county within same state (%) - White
Geographical mobility - Moved from different county within same state (%) - Black or African American
Geographical mobility - Moved from different county within same state (%) - Asian
Geographical mobility - Moved from different county within same state (%) - Hispanic or Latino
Geographical mobility - Moved from different county within same state (%) - American Indian and Alaska Native
Geographical mobility - Moved from different county within same state (%) - Multirace
Geographical mobility - Moved from different county within same state (%) - Other Race
Geographical mobility - Moved from different state (%)
Geographical mobility - Moved from different state (%) - White
Geographical mobility - Moved from different state (%) - Black or African American
Geographical mobility - Moved from different state (%) - Asian
Geographical mobility - Moved from different state (%) - Hispanic or Latino
Geographical mobility - Moved from different state (%) - American Indian and Alaska Native
Geographical mobility - Moved from different state (%) - Multirace
Geographical mobility - Moved from different state (%) - Other Race
Geographical mobility - Moved from abroad (%)
Geographical mobility - Moved from abroad (%) - White
Geographical mobility - Moved from abroad (%) - Black or African American
Geographical mobility - Moved from abroad (%) - Asian
Geographical mobility - Moved from abroad (%) - Hispanic or Latino
Geographical mobility - Moved from abroad (%) - American Indian and Alaska Native
Geographical mobility - Moved from abroad (%) - Multirace
Geographical mobility - Moved from abroad (%) - Other Race
Place of birth for the foreign-born population - Ireland (%)
Place of birth for the foreign-born population - Denmark (%)
Place of birth for the foreign-born population - Norway (%)
Place of birth for the foreign-born population - Sweden (%)
Place of birth for the foreign-born population - United Kingdom (%)
Place of birth for the foreign-born population - England (%)
Place of birth for the foreign-born population - Scotland (%)
Place of birth for the foreign-born population - Other Northern Europe (%)
Place of birth for the foreign-born population - Austria (%)
Place of birth for the foreign-born population - Belgium (%)
Place of birth for the foreign-born population - France (%)
Place of birth for the foreign-born population - Germany (%)
Place of birth for the foreign-born population - Netherlands (%)
Place of birth for the foreign-born population - Switzerland (%)
Place of birth for the foreign-born population - Other Western Europe (%)
Place of birth for the foreign-born population - Greece (%)
Place of birth for the foreign-born population - Italy (%)
Place of birth for the foreign-born population - Portugal (%)
Place of birth for the foreign-born population - Spain (%)
Place of birth for the foreign-born population - Other Southern Europe (%)
Place of birth for the foreign-born population - Albania (%)
Place of birth for the foreign-born population - Belarus (%)
Place of birth for the foreign-born population - Bosnia and Herzegovina (%)
Place of birth for the foreign-born population - Bulgaria (%)
Place of birth for the foreign-born population - Croatia (%)
Place of birth for the foreign-born population - Czechoslovakia (%)
Place of birth for the foreign-born population - Hungary (%)
Place of birth for the foreign-born population - Latvia (%)
Place of birth for the foreign-born population - Lithuania (%)
Place of birth for the foreign-born population - North Macedonia (Macedonia) (%)
Place of birth for the foreign-born population - Moldova (%)
Place of birth for the foreign-born population - Poland (%)
Place of birth for the foreign-born population - Romania (%)
Place of birth for the foreign-born population - Russia (%)
Place of birth for the foreign-born population - Serbia (%)
Place of birth for the foreign-born population - Ukraine (%)
Place of birth for the foreign-born population - Other Eastern Europe (%)
Place of birth for the foreign-born population - China (%)
Place of birth for the foreign-born population - Hong Kong (%)
Place of birth for the foreign-born population - Taiwan (%)
Place of birth for the foreign-born population - Japan (%)
Place of birth for the foreign-born population - Korea (%)
Place of birth for the foreign-born population - Other Eastern Asia (%)
Place of birth for the foreign-born population - Afghanistan (%)
Place of birth for the foreign-born population - Bangladesh (%)
Place of birth for the foreign-born population - India (%)
Place of birth for the foreign-born population - Iran (%)
Place of birth for the foreign-born population - Kazakhstan (%)
Place of birth for the foreign-born population - Nepal (%)
Place of birth for the foreign-born population - Pakistan (%)
Place of birth for the foreign-born population - Sri Lanka (%)
Place of birth for the foreign-born population - Uzbekistan (%)
Place of birth for the foreign-born population - Other South Central Asia (%)
Place of birth for the foreign-born population - Burma (%)
Place of birth for the foreign-born population - Cambodia (%)
Place of birth for the foreign-born population - Indonesia (%)
Place of birth for the foreign-born population - Laos (%)
Place of birth for the foreign-born population - Malaysia (%)
Place of birth for the foreign-born population - Philippines (%)
Place of birth for the foreign-born population - Singapore (%)
Place of birth for the foreign-born population - Thailand (%)
Place of birth for the foreign-born population - Vietnam (%)
Place of birth for the foreign-born population - Other South Eastern Asia (%)
Place of birth for the foreign-born population - Armenia (%)
Place of birth for the foreign-born population - Iraq (%)
Place of birth for the foreign-born population - Israel (%)
Place of birth for the foreign-born population - Jordan (%)
Place of birth for the foreign-born population - Kuwait (%)
Place of birth for the foreign-born population - Lebanon (%)
Place of birth for the foreign-born population - Saudi Arabia (%)
Place of birth for the foreign-born population - Syria (%)
Place of birth for the foreign-born population - Turkey (%)
Place of birth for the foreign-born population - Yemen (%)
Place of birth for the foreign-born population - Other Western Asia (%)
Place of birth for the foreign-born population - Eritrea (%)
Place of birth for the foreign-born population - Ethiopia (%)
Place of birth for the foreign-born population - Kenya (%)
Place of birth for the foreign-born population - Somalia (%)
Place of birth for the foreign-born population - Uganda (%)
Place of birth for the foreign-born population - Zimbabwe (%)
Place of birth for the foreign-born population - Other Eastern Africa (%)
Place of birth for the foreign-born population - Cameroon (%)
Place of birth for the foreign-born population - Congo (%)
Place of birth for the foreign-born population - Democratic Republic of Congo (Zaire) (%)
Place of birth for the foreign-born population - Other Middle Africa (%)
Place of birth for the foreign-born population - Egypt (%)
Place of birth for the foreign-born population - Morocco (%)
Place of birth for the foreign-born population - Sudan (%)
Place of birth for the foreign-born population - Other Northern Africa (%)
Place of birth for the foreign-born population - South Africa (%)
Place of birth for the foreign-born population - Other Southern Africa (%)
Place of birth for the foreign-born population - Cabo Verde (%)
Place of birth for the foreign-born population - Ghana (%)
Place of birth for the foreign-born population - Liberia (%)
Place of birth for the foreign-born population - Nigeria (%)
Place of birth for the foreign-born population - Senegal (%)
Place of birth for the foreign-born population - Sierra Leone (%)
Place of birth for the foreign-born population - Other Western Africa (%)
Place of birth for the foreign-born population - Australia (%)
Place of birth for the foreign-born population - New Zealand (%)
Place of birth for the foreign-born population - Fiji (%)
Place of birth for the foreign-born population - Micronesia (%)
Place of birth for the foreign-born population - Bahamas (%)
Place of birth for the foreign-born population - Barbados (%)
Place of birth for the foreign-born population - Cuba (%)
Place of birth for the foreign-born population - Dominica (%)
Place of birth for the foreign-born population - Dominican Republic (%)
Place of birth for the foreign-born population - Grenada (%)
Place of birth for the foreign-born population - Haiti (%)
Place of birth for the foreign-born population - Jamaica (%)
Place of birth for the foreign-born population - St. Vincent and the Grenadines (%)
Place of birth for the foreign-born population - Trinidad and Tobago (%)
Place of birth for the foreign-born population - West Indies (%)
Place of birth for the foreign-born population - Other Caribbean (%)
Place of birth for the foreign-born population - Belize (%)
Place of birth for the foreign-born population - Costa Rica (%)
Place of birth for the foreign-born population - El Salvador (%)
Place of birth for the foreign-born population - Guatemala (%)
Place of birth for the foreign-born population - Honduras (%)
Place of birth for the foreign-born population - Mexico (%)
Place of birth for the foreign-born population - Nicaragua (%)
Place of birth for the foreign-born population - Panama (%)
Place of birth for the foreign-born population - Other Central America (%)
Place of birth for the foreign-born population - Argentina (%)
Place of birth for the foreign-born population - Bolivia (%)
Place of birth for the foreign-born population - Brazil (%)
Place of birth for the foreign-born population - Chile (%)
Place of birth for the foreign-born population - Colombia (%)
Place of birth for the foreign-born population - Ecuador (%)
Place of birth for the foreign-born population - Guyana (%)
Place of birth for the foreign-born population - Peru (%)
Place of birth for the foreign-born population - Uruguay (%)
Place of birth for the foreign-born population - Venezuela (%)
Place of birth for the foreign-born population - Other South America (%)
Place of birth for the foreign-born population - Canada (%)
Place of birth for the foreign-born population - Other Northern America (%)
Place of birth for the foreign-born population - Other (%)
Latest news about races in Brookfield, IL collected exclusively by city-data.com from local newspapers, TV, and radio stations
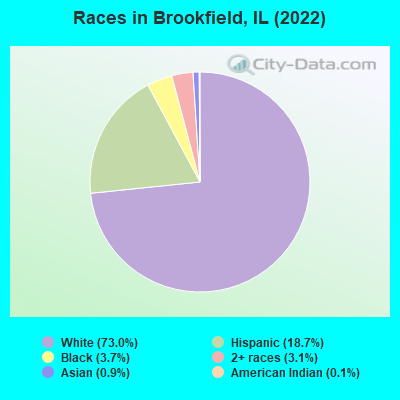
According to 2022 data, the most numerous races in Brookfield, IL are White alone (13,816 residents), Hispanic (3,534 residents), and Black alone (696 residents). 79.5% of Brookfield residents speak English at home. 9.8% of Brookfield, IL residents are foreign-born (4.4% born in Europe, 4.2% born in Latin America), which is 43.3% less than the foreign-born rate of 14.0% across the entire state of Illinois.
Race distribution in Brookfield
2000 2022
8,424,140 67.8% White alone 1,856,152 14.9% Black alone 1,530,262 12.3% Hispanic 419,916 3.4% Asian alone 153,996 1.2% Two or more races 13,479 0.1% Other race alone 18,232 0.1% American Indian alone 3,116 0.03% Native Hawaiian and Other
7,356,301 58.5% White alone 2,299,726 18.3% Hispanic 1,660,423 13.2% Black alone 747,296 5.9% Asian alone 458,599 3.6% Two or more races 45,386 0.4% Other race alone 10,405 0.08% American Indian alone 3,896 0.03% Native Hawaiian and Other
Income and house value in Brookfield Median household income in 2022 $98,872 White non-Hispanic householders$42,502 Black householders$137,020 Some other race householders$60,416 Two or more races householders$100,335 Hispanic or Latino race householdersMedian 2022 house value $299,676 White Non-Hispanic householders$273,064 Black or African American householders $307,818 Asian householders$336,813 Some other race householders$236,523 Two or more races householders$329,663 Hispanic or Latino householders
Median age by race in Brookfield
43.7 Median age for White residents42.2 45.4 57.1 Median age for Black or African American residents51.1 58.0 29.6 Median age for American Indian / Alaska Native residents-736,736,736.0 43.0 52.8 Median age for Asian residents46.3 53.1 -687,999,999.3 Median age for Native Hawaiian / Pacific Islander residents-918,721,460.3 -610,229,276.3 35.2 Median age for Other race residents40.2 30.2 31.2 Median age for Two or more races residents31.6 18.8 43.4 Median age for White alone residents42.6 44.6 31.6 Median age for Hispanic or Latino residents31.7 31.5
Owner/renter occupied households by race in Brookfield
House owners and renters - White residents 5,144 84.8% Owner occupied923 15.2% Renter occupiedHouse owners and renters - Black or African American residents 96 27.8% Owner occupied248 72.2% Renter occupiedHouse owners and renters - American Indian / Alaska Native residents 21 38.9% Owner occupied33 61.1% Renter occupiedHouse owners and renters - Asian residents 31 73.0% Owner occupied12 27.0% Renter occupiedHouse owners and renters - Other race residents 263 66.1% Owner occupied135 33.9% Renter occupiedHouse owners and renters - Two or more races residents 402 57.5% Owner occupied297 42.5% Renter occupiedHouse owners and renters - White alone residents 4,977 83.2% Owner occupied1,008 16.8% Renter occupiedHouse owners and renters - Hispanic or Latino residents 962 74.6% Owner occupied327 25.4% Renter occupied
Language usage in Brookfield
English speakers - Total 79.5% of residents of Brookfield speak English at home.
12.8% of residents speak Spanish at home 1,758 76.4% Speak English very well543 23.6% Speak English less than very well7.2% of residents speak other language at home 882 68.6% Speak English very well404 31.4% Speak English less than very well
English speakers - Born in the United States 90.3% of residents of Brookfield speak English at home.
6.2% of residents speak Spanish at home 131 95.6% Speak English very well6 4.4% Speak English less than very well3.1% of residents speak other language at home 70 100.0% Speak English very well
English speakers - Native, born elsewhere 72.6% of residents of Brookfield speak English at home.
26.0% of residents speak Spanish at home 29 27.1% Speak English very well78 72.9% Speak English less than very well1.2% of residents speak other language at home 5 100.0% Speak English very well
English speakers - Foreign-born 12.6% of residents of Brookfield speak English at home.
39.1% of residents speak Spanish at home 311 43.1% Speak English very well411 56.9% Speak English less than very well48.0% of residents speak other language at home 492 55.5% Speak English very well395 44.5% Speak English less than very well
White (Caucasian) - Speak only English Native:
96.4% (11,815)Foreign-born:
9.7% (81)
White (Caucasian) - Speak another language Native:
5.8% (711)Foreign-born:
90.0% (757)
Black or African American - Speak another language Native:
3.5% (23)Foreign-born:
91.2% (7)
American Indian / Alaska Native - Speak another language Native:
62.4% (51)Foreign-born:
100.0% (30)
Asian - Speak only English Native:
64.2% (41)Foreign-born:
26.8% (29)
Asian - Speak another language Native:
35.9% (23)Foreign-born:
71.0% (76)
Other race - Speak only English Native:
12.9% (108)Foreign-born:
7.3% (21)
Other race - Speak another language Native:
86.0% (719)Foreign-born:
92.3% (262)
Two or more races - Speak only English Native:
78.5% (1,294)Foreign-born:
26.8% (141)
Two or more races - Speak another language Native:
19.1% (315)Foreign-born:
73.2% (386)
White alone - Speak only English Native:
95.4% (11,583)Foreign-born:
10.1% (90)
White alone - Speak another language Native:
4.2% (508)Foreign-born:
90.5% (802)
Hispanic or Latino - Speak only English Native:
48.4% (1,271)Foreign-born:
8.7% (69)
Hispanic or Latino - Speak another language Native:
52.6% (1,380)Foreign-born:
90.8% (724)
Foreign-born residents in Brookfield 1,848 residents are foreign born (4.4% Europe , 4.2% Latin America ).
This city:
9.8%Illinois:
14.1%
Marital status for residents in Brookfield Marital status - White (Caucasian) population 15 years and over
Males 31.0% Never married57.3% Now married1.4% Separated1.2% Widowed9.1% DivorcedFemales 26.1% Never married49.2% Now married0.2% Separated10.2% Widowed14.3% DivorcedWomen who gave birth in the past 12 months Now married:
94.5% (132)Unmarried:
5.5% (8)
Women who did not give birth in the past 12 months Now married:
49.3% (1,481)Unmarried:
50.7% (1,525)
Marital status - Black or African American population 15 years and over
Males 17.0% Never married83.0% Now married0.0% Separated0.0% Widowed0.0% DivorcedFemales 20.7% Never married45.3% Now married0.0% Separated22.8% Widowed11.3% DivorcedWomen who did not give birth in the past 12 months Now married:
39.2% (55)Unmarried:
60.8% (85)
Marital status - American Indian / Alaska Native population 15 years and over
Males 0.0% Never married100.0% Now married0.0% Separated0.0% Widowed0.0% DivorcedFemales 0.0% Never married100.0% Now married0.0% Separated0.0% Widowed0.0% DivorcedWomen who did not give birth in the past 12 months Now married:
100.0% (51)Unmarried:
0.0% (0)
Marital status - Asian population 15 years and over
Males 7.0% Never married93.0% Now married0.0% Separated0.0% Widowed0.0% DivorcedFemales 20.8% Never married71.9% Now married0.0% Separated7.3% Widowed0.0% DivorcedWomen who gave birth in the past 12 months Now married:
100.0% (15)Unmarried:
0.0% (0)
Women who did not give birth in the past 12 months Now married:
50.0% (11)Unmarried:
50.0% (11)
Marital status - Other race population 15 years and over
Males 51.4% Never married31.5% Now married0.0% Separated0.0% Widowed17.1% DivorcedFemales 51.3% Never married38.5% Now married3.6% Separated6.5% Widowed0.0% DivorcedWomen who gave birth in the past 12 months Now married:
100.0% (5)Unmarried:
0.0% (0)
Women who did not give birth in the past 12 months Now married:
43.7% (165)Unmarried:
56.3% (212)
Marital status - Two or more races population 15 years and over
Males 49.5% Never married48.7% Now married0.0% Separated0.0% Widowed1.7% DivorcedFemales 17.0% Never married45.2% Now married12.4% Separated0.0% Widowed25.3% DivorcedWomen who gave birth in the past 12 months Now married:
100.0% (10)Unmarried:
0.0% (0)
Women who did not give birth in the past 12 months Now married:
41.6% (103)Unmarried:
58.4% (144)
Marital status - White alone, not Hispanic / Latino population 15 years and over
Males 28.9% Never married58.7% Now married1.6% Separated1.3% Widowed9.5% DivorcedFemales 24.7% Never married50.6% Now married0.1% Separated10.7% Widowed14.0% DivorcedWomen who gave birth in the past 12 months Now married:
93.8% (129)Unmarried:
6.2% (9)
Women who did not give birth in the past 12 months Now married:
50.6% (1,520)Unmarried:
49.4% (1,485)
Marital status - Hispanic or Latino population 15 years and over
Males 53.1% Never married39.4% Now married0.0% Separated0.0% Widowed7.5% DivorcedFemales 36.8% Never married42.0% Now married5.7% Separated4.4% Widowed11.1% DivorcedWomen who gave birth in the past 12 months Now married:
100.0% (31)Unmarried:
0.0% (0)
Women who did not give birth in the past 12 months Now married:
43.2% (380)Unmarried:
56.8% (500)
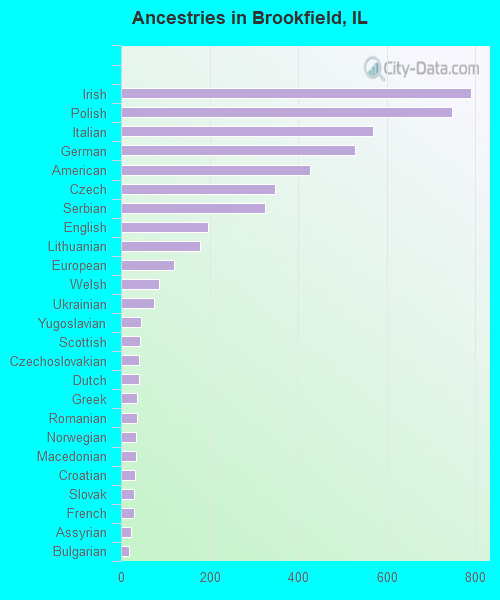
Ancestries in Brookfield
792 10.9% Irish749 10.3% Polish570 7.8% Italian528 7.3% German427 5.9% American348 4.8% Czech325 4.5% Serbian196 2.7% English179 2.5% Lithuanian120 1.7% European85 1.2% Welsh74 1.0% Ukrainian45 0.6% Yugoslavian42 0.6% Scottish41 0.6% Czechoslovakian40 0.6% Dutch37 0.5% Greek37 0.5% Romanian35 0.5% Norwegian33 0.5% Macedonian31 0.4% Croatian30 0.4% Slovak29 0.4% French22 0.3% Assyrian18 0.2% Bulgarian18 0.2% Danish15 0.2% Scotch-Irish11 0.2% Swedish9 0.1% Palestinian4 0.06% British
Children Nativity (place of birth) in Brookfield
Children under 6 years - Living with two parents Both parents native 902 100.0% NativeBoth parents foreign-born 75 100.0% NativeOne native, one foreign-born parent 141 100.0% NativeChildren under 6 years - Living with one parent Native parent 74 100.0% NativeForeign-born parent 24 100.0% NativeChildren 6 to 17 years - Living with two parents Both parents native 2,059 100.0% NativeBoth parents foreign-born 18 100.0% NativeOne native, one foreign-born parent 303 100.0% NativeChildren 6 to 17 years - Living with one parent Native parent 383 100.0% NativeForeign-born parent 160 51.1% Native153 48.9% Foreign-born
Grandparents responsible for own grandchildren in Brookfield
Grandparents (30 to 59 years) White / Caucasian 7 100.0% Not responsible for grandchildrenWhite alone, not Hispanic / Latino 6 100.0% Not responsible for grandchildrenGrandparents (60 years and over) White / Caucasian 16 26.9% Responsible for grandchildren43 73.1% Not responsible for grandchildrenWhite alone, not Hispanic / Latino 19 49.2% Responsible for grandchildren20 50.8% Not responsible for grandchildren