Races in Bristol, Tennessee (TN) Detailed Stats
Ancestries, Foreign-born residents, place of birth
Settings
X


Recent posts about races in Bristol, Tennessee on our local forum with over 2,400,000 registered users:
 | Bristol TN is a good place for artists (2 replies) |
| Bristol Bound (14 replies) |
| Bristol/Tri-Cities Area Information (11 replies) |
| JC vs Bristol, TN (18 replies) |
| Bristol TN/VA area. Where to live (4 replies) |
| What's Bristol like?? (11 replies) |
Latest news about races in Bristol, TN collected exclusively by city-data.com from local newspapers, TV, and radio stations
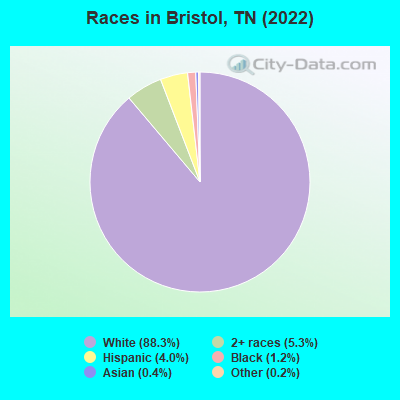
According to 2022 data, the most numerous races in Bristol, TN are White alone (24,428 residents), Black alone (338 residents), and Hispanic (1,108 residents). 97.5% of Bristol residents speak English at home. 2.0% of Bristol, TN residents are foreign-born (0.9% born in Latin America, 0.6% born in Europe, 0.3% born in Asia), which is 147.9% less than the foreign-born rate of 5.0% across the entire state of Tennessee.
Race distribution in Bristol
2000
2022

- 23,49694.7%White alone
- 7282.9%Black alone
- 1700.7%Hispanic
- 1690.7%Two or more races
- 1580.6%Asian alone
- 770.3%American Indian alone
- 210.08%Other race alone
- 20.01%Native Hawaiian and Other
Pacific Islander alone

-
- 24,42888.3%White alone
- 1,4635.3%Two or more races
- 1,1084.0%Hispanic
- 3381.2%Black alone
- 1190.4%Asian alone
- 650.2%Other race alone
- 200.07%American Indian alone
2000
2022
-
- 4,505,93079.2%White alone
- 928,20416.3%Black alone
- 123,8382.2%Hispanic
- 54,8241.0%Two or more races
- 56,0771.0%Asian alone
- 13,8200.2%American Indian alone
- 4,7800.08%Other race alone
- 1,8100.03%Native Hawaiian and Other
Pacific Islander alone

-
- 5,070,02671.9%White alone
- 1,089,73815.5%Black alone
- 442,6296.3%Hispanic
- 279,3814.0%Two or more races
- 131,8171.9%Asian alone
- 26,9720.4%Other race alone
- 6,3870.09%American Indian alone
- 4,3890.06%Native Hawaiian and Other
Pacific Islander alone

Income and house value in Bristol
- Median household income in 2022
- $48,789White non-Hispanic householders
- $17,286Black householders
- $179,188Some other race householders
- $39,579Two or more races householders
- $64,163Hispanic or Latino race householders
- Median 2022 house value
- $227,651White Non-Hispanic householders
- $148,658Black or African American householders
- $668,088Asian householders
- $245,432Two or more races householders
- $340,165Hispanic or Latino householders
Household income for White non-Hispanic householders

Household income for Black householders

Household income for American Indian and Alaska Native householders

Household income for Asian householders

Household income for Some other race householders

Household income for Two or more races householders

Household income for Hispanic or Latino race householders

Median age by race in Bristol
- 41.6Median age for White residents
- 40.0Males
- 42.7Females
- 58.7Median age for Black or African American residents
- 69.8Males
- 50.8Females
- 39.0Median age for American Indian / Alaska Native residents
- 60.1Males
- -801,477,376.9Females
- 49.0Median age for Asian residents
- -662,846,226.7Males
- 49.1Females
- -666,666,666.0Median age for Native Hawaiian / Pacific Islander residents
- -666,666,666.0Males
- -666,666,666.0Females
- 17.1Median age for Other race residents
- 17.4Males
- 12.6Females
- 29.0Median age for Two or more races residents
- 21.1Males
- 37.5Females
- 41.7Median age for White alone residents
- 40.0Males
- 43.1Females
- 19.3Median age for Hispanic or Latino residents
- 20.6Males
- 17.6Females
Owner/renter occupied households by race in Bristol
- House owners and renters - White residents
- 7,62467.6%Owner occupied
- 3,64632.4%Renter occupied
- House owners and renters - Black or African American residents
- 6926.6%Owner occupied
- 19073.4%Renter occupied
- House owners and renters - American Indian / Alaska Native residents
- 549.9%Owner occupied
- 550.1%Renter occupied
- House owners and renters - Asian residents
- 35100.0%Owner occupied
- House owners and renters - Other race residents
- 46100.0%Owner occupied
- House owners and renters - Two or more races residents
- 41448.1%Owner occupied
- 44751.9%Renter occupied
- House owners and renters - White alone residents
- 7,56967.7%Owner occupied
- 3,60932.3%Renter occupied
- House owners and renters - Hispanic or Latino residents
- 23074.1%Owner occupied
- 8125.9%Renter occupied
Language usage in Bristol
- English speakers - Total
- 97.5% of residents of Bristol speak English at home.
- 2.0% of residents speak Spanish at home
- 14126.6%Speak English very well
- 38973.4%Speak English less than very well
- 0.8% of residents speak other language at home
- 20093.5%Speak English very well
- 146.5%Speak English less than very well
- English speakers - Born in the United States
- 99.5% of residents of Bristol speak English at home.
- 1.1% of residents speak Spanish at home
- 7852.0%Speak English very well
- 7248.0%Speak English less than very well
- 0.2% of residents speak other language at home
- 1959.4%Speak English very well
- 1340.6%Speak English less than very well
- English speakers - Native, born elsewhere
- 89.9% of residents of Bristol speak English at home.
- 28.1% of residents speak Spanish at home
- 1025.6%Speak English very well
- 2974.4%Speak English less than very well
- 8.6% of residents speak other language at home
- 12100.0%Speak English very well
- English speakers - Foreign-born
- 61.3% of residents of Bristol speak English at home.
- 24.6% of residents speak Spanish at home
- 7146.4%Speak English very well
- 8253.6%Speak English less than very well
- 16.4% of residents speak other language at home
- 9795.1%Speak English very well
- 54.9%Speak English less than very well
White (Caucasian) - Speak only English
| Native: | 99.4% (22,733) |
| Foreign-born: | 81.3% (286) |
White (Caucasian) - Speak another language
| Native: | 0.6% (132) |
| Foreign-born: | 18.5% (65) |
Asian - Speak only English
| Native: | 28.5% (8) |
| Foreign-born: | 52.8% (39) |
Asian - Speak another language
| Native: | 73.2% (19) |
| Foreign-born: | 46.7% (35) |
Other race - Speak only English
| Native: | 82.0% (163) |
| Foreign-born: | 27.8% (23) |
Other race - Speak another language
| Native: | 20.8% (41) |
| Foreign-born: | 61.4% (51) |
Two or more races - Speak another language
| Native: | 14.0% (234) |
| Foreign-born: | 99.8% (145) |
White alone - Speak only English
| Native: | 99.5% (22,648) |
| Foreign-born: | 80.3% (237) |
White alone - Speak another language
| Native: | 0.5% (110) |
| Foreign-born: | 19.9% (59) |
Hispanic or Latino - Speak only English
| Native: | 75.8% (558) |
| Foreign-born: | 45.4% (127) |
Hispanic or Latino - Speak another language
| Native: | 23.8% (175) |
| Foreign-born: | 62.0% (173) |
Foreign-born residents in Bristol
558 residents are foreign born (0.9% Latin America, 0.6% Europe, 0.3% Asia).
| This city: | 2.0% |
| Tennessee: | 5.4% |


Marital status for residents in Bristol
Marital status - White (Caucasian) population 15 years and over
- Males
- 25.5%Never married
- 52.4%Now married
- 3.0%Separated
- 2.8%Widowed
- 16.2%Divorced
- Females
- 24.0%Never married
- 44.5%Now married
- 1.8%Separated
- 13.3%Widowed
- 16.4%Divorced
Women who gave birth in the past 12 months
| Now married: | 56.8% (165) |
| Unmarried: | 43.2% (126) |
Women who did not give birth in the past 12 months
| Now married: | 42.8% (2,267) |
| Unmarried: | 57.2% (3,030) |
Marital status - Black or African American population 15 years and over
- Males
- 56.4%Never married
- 13.6%Now married
- 2.3%Separated
- 1.1%Widowed
- 26.6%Divorced
- Females
- 51.3%Never married
- 18.7%Now married
- 0.0%Separated
- 11.3%Widowed
- 18.7%Divorced
Women who did not give birth in the past 12 months
| Now married: | 23.2% (35) |
| Unmarried: | 76.8% (116) |
Marital status - American Indian / Alaska Native population 15 years and over
- Males
- 41.7%Never married
- 50.0%Now married
- 8.3%Separated
- 0.0%Widowed
- 0.0%Divorced
- Females
- 0.0%Never married
- 50.0%Now married
- 0.0%Separated
- 0.0%Widowed
- 50.0%Divorced
Marital status - Asian population 15 years and over
- Males
- 0.0%Never married
- 100.0%Now married
- 0.0%Separated
- 0.0%Widowed
- 0.0%Divorced
- Females
- 33.7%Never married
- 33.7%Now married
- 0.0%Separated
- 32.6%Widowed
- 0.0%Divorced
Women who did not give birth in the past 12 months
| Now married: | 32.1% (18) |
| Unmarried: | 67.9% (38) |
Marital status - Other race population 15 years and over
- Males
- 73.1%Never married
- 26.9%Now married
- 0.0%Separated
- 0.0%Widowed
- 0.0%Divorced
- Females
- 30.8%Never married
- 69.2%Now married
- 0.0%Separated
- 0.0%Widowed
- 0.0%Divorced
Women who did not give birth in the past 12 months
| Now married: | 69.2% (43) |
| Unmarried: | 30.8% (19) |
Marital status - Two or more races population 15 years and over
- Males
- 64.9%Never married
- 27.8%Now married
- 0.0%Separated
- 0.0%Widowed
- 7.3%Divorced
- Females
- 43.1%Never married
- 14.7%Now married
- 2.6%Separated
- 10.5%Widowed
- 29.1%Divorced
Women who did not give birth in the past 12 months
| Now married: | 17.9% (112) |
| Unmarried: | 82.1% (512) |
Marital status - White alone, not Hispanic / Latino population 15 years and over
- Males
- 25.5%Never married
- 52.3%Now married
- 3.1%Separated
- 2.8%Widowed
- 16.3%Divorced
- Females
- 24.2%Never married
- 44.5%Now married
- 1.7%Separated
- 13.1%Widowed
- 16.6%Divorced
Women who gave birth in the past 12 months
| Now married: | 56.8% (165) |
| Unmarried: | 43.2% (125) |
Women who did not give birth in the past 12 months
| Now married: | 42.6% (2,229) |
| Unmarried: | 57.4% (3,010) |
Marital status - Hispanic or Latino population 15 years and over
- Males
- 42.8%Never married
- 51.0%Now married
- 0.0%Separated
- 0.0%Widowed
- 6.2%Divorced
- Females
- 32.4%Never married
- 32.6%Now married
- 3.1%Separated
- 17.2%Widowed
- 14.7%Divorced
Women who did not give birth in the past 12 months
| Now married: | 33.2% (86) |
| Unmarried: | 66.8% (173) |
Ancestries in Bristol

- 4,04028.5%American
- 3,54625.0%English
- 1,70012.0%Irish
- 1,2328.7%German
- 4803.4%Scotch-Irish
- 4152.9%Scottish
- 3602.5%Italian
- 1441.0%Jamaican
- 1320.9%European
- 680.5%French
- 480.3%African
- 350.2%Dutch
- 340.2%Northern European
- 290.2%Czech
- 250.2%Eastern European
- 250.2%Polish
- 250.2%Swedish
- 230.2%Assyrian
- 210.1%Danish
- 180.1%Welsh
- 150.1%Cypriot
- 150.1%Iranian
- 150.1%Portuguese
- 130.09%British
- 130.09%Yugoslavian
- 120.08%Canadian
- 120.08%Finnish
- 90.06%Norwegian
- 70.05%Slovak
- 70.05%Ethiopian
- 60.04%Croatian
- 60.04%Trinidadian and Tobagonian
- 50.04%Austrian
- 50.04%Macedonian

Geographical mobility in Bristol

- Same house 1 year ago
- 22,53992.1%White (Caucasian)
- 68285.9%Black or African American
- 1254.4%American Indian / Alaska Native
- 8280.4%Asian
- 25393.8%Other race
- 1,55475.4%Two or more races
- 22,36292.2%White alone, not Hispanic / Latino
- 73775.2%Hispanic or Latino

-
- Moved within same county
- 7122.9%White / Caucasian
- 9211.7%Black or African American
- 942.7%American Indian / Alaska Native
- 29814.5%Two or more races
- 7223.0%White alone, not Hispanic / Latino
- 272.8%Hispanic or Latino

-
- Moved within same state
- 1420.6%White / Caucasian
- 91.1%Black or African American
- 361.7%Two or more races
- 1370.6%White alone, not Hispanic / Latino

-
- Moved from different state
- 9603.9%White / Caucasian
- 70.9%Black or African American
- 2221.3%Asian
- 93.3%Other race
- 1627.9%Two or more races
- 9313.8%White alone, not Hispanic / Latino
- 19519.9%Hispanic or Latino

-
- Moved from abroad
- 80.0%White
- 113.9%Other race
- 160.1%White alone, not Hispanic / Latino
- 70.7%Hispanic or Latino

Children Nativity (place of birth) in Bristol
Place of birth for residents in Bristol
![Place of birth for the foreign-born population - Regions]()
- 264Americas
- 243Latin America
- 177Central America
- 167Europe
- 88Asia
- 85Northern Europe
- 38Oceania
- 38Australia and New Zealand Subregion
- 33Western Europe
- 33South America
- 32Caribbean
- 30Southern Europe
- 28South Eastern Asia
- 27South Central Asia
- 20Northern America
- 17Eastern Europe
- 17Eastern Asia
- 15Western Asia
- 11China

![Place of birth for the foreign-born population - Countries]()
- 159Mexico
- 74England
- 33Germany
- 32Cuba
- 30Spain
- 27Australia
- 24Philippines
- 24Guyana
- 20Iran
- 20Canada
- 17Honduras
- 11United Kingdom
- 11China
- 11New Zealand
- 9Bosnia and Herzegovina
- 9Colombia
- 8Croatia
- 6Korea
- 6India
- 4Thailand

Grandparents responsible for own grandchildren in Bristol
Zip codes: 37620.