Races in Bristol, Pennsylvania (PA) Detailed Stats
Ancestries, Foreign-born residents, place of birth
Settings
X


Recent posts about races in Bristol, Pennsylvania on our local forum with over 2,400,000 registered users:
 | PA Republicans bucking party to endorse Democrat Josh Shapiro for governor (284 replies) |
| 95-295 Signage Change - Actually Worse Than Before?!? (33 replies) |
| Which city has retained more of its poor white working class, Philadelphia or Pittsburgh? (10 replies) |
| Bristol & Bristol township Levittown (15 replies) |
| Best Philadelphia Suburb (38 replies) |
| Philadelphia 2035 (9298 replies) |
Latest news about races in Bristol, PA collected exclusively by city-data.com from local newspapers, TV, and radio stations
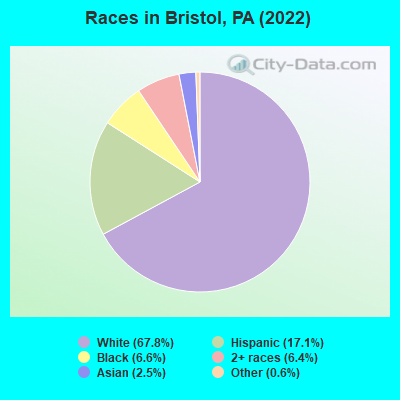
According to 2022 data, the most numerous races in Bristol, PA are White alone (6,685 residents), Black alone (654 residents), and Hispanic (1,682 residents). 86.2% of Bristol residents speak English at home. 3.5% of Bristol, PA residents are foreign-born (1.4% born in Asia, 1.0% born in Africa, 0.6% born in Latin America), which is 100.6% less than the foreign-born rate of 7.0% across the entire state of Pennsylvania.
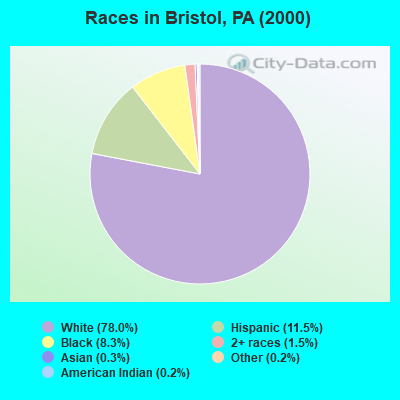
Race distribution in Bristol
2000
2022

- 7,73978.0%White alone
- 1,14411.5%Hispanic
- 8238.3%Black alone
- 1511.5%Two or more races
- 330.3%Asian alone
- 150.2%Other race alone
- 150.2%American Indian alone
- 30.03%Native Hawaiian and Other
Pacific Islander alone
-
- 6,68567.8%White alone
- 1,68217.1%Hispanic
- 6546.6%Black alone
- 6316.4%Two or more races
- 2432.5%Asian alone
- 640.6%Other race alone
- 80.08%American Indian alone
2000
2022
-
- 10,322,45584.1%White alone
- 1,202,4379.8%Black alone
- 394,0883.2%Hispanic
- 218,2961.8%Asian alone
- 113,0970.9%Two or more races
- 13,0860.1%Other race alone
- 14,9040.1%American Indian alone
- 2,6910.02%Native Hawaiian and Other
Pacific Islander alone

-
- 9,487,22873.1%White alone
- 1,311,58110.1%Black alone
- 1,115,9978.6%Hispanic
- 493,9423.8%Two or more races
- 487,1243.8%Asian alone
- 63,5820.5%Other race alone
- 10,1300.08%American Indian alone
- 2,4240.02%Native Hawaiian and Other
Pacific Islander alone

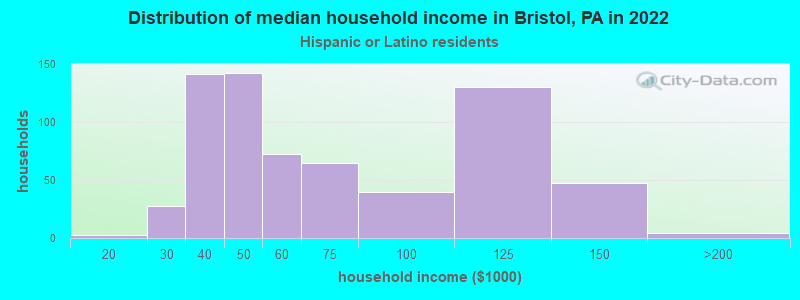
Income and house value in Bristol
- Median household income in 2022
- $67,690White non-Hispanic householders
- $93,468Black householders
- $119,884Some other race householders
- $60,174Hispanic or Latino race householders
- Median 2022 house value
- $231,640White Non-Hispanic householders
- $212,295Black or African American householders
- $350,006Asian householders
- $219,422Some other race householders
- $330,915Two or more races householders
- $223,240Hispanic or Latino householders
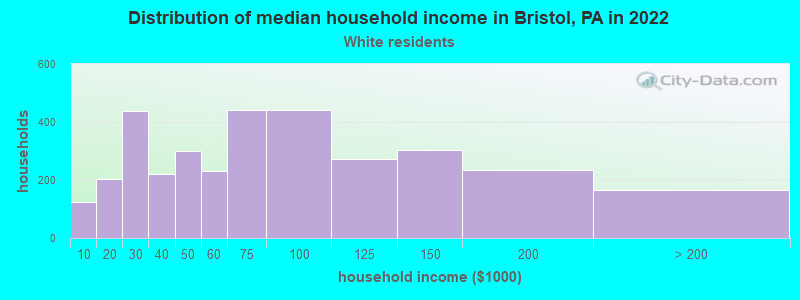
Household income for White non-Hispanic householders
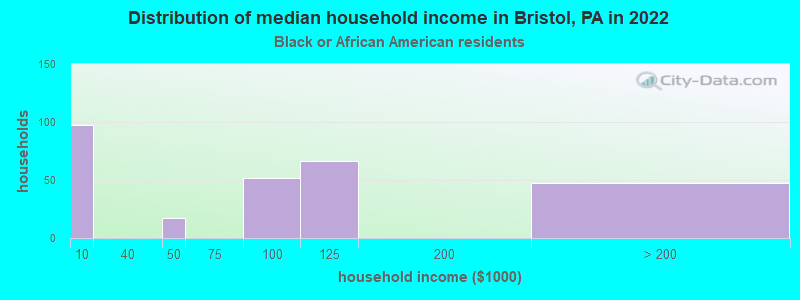
Household income for Black householders
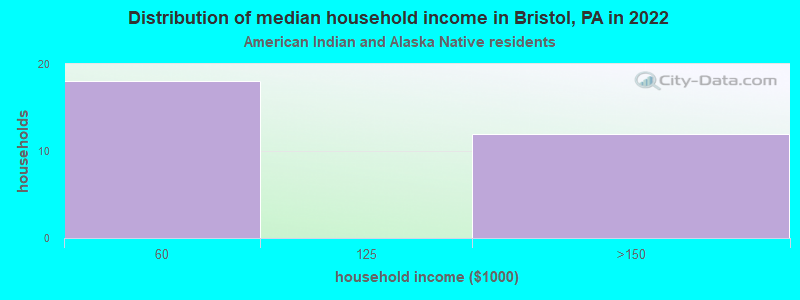
Household income for American Indian and Alaska Native householders
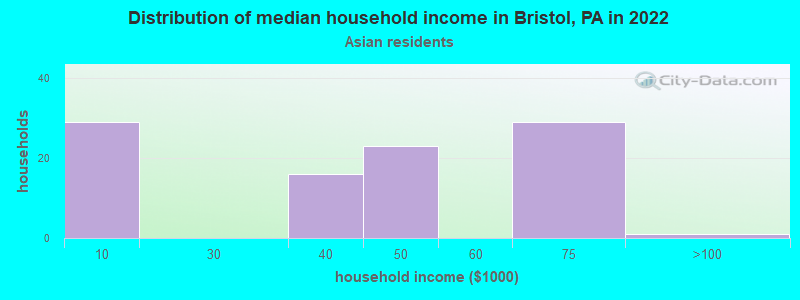
Household income for Asian householders
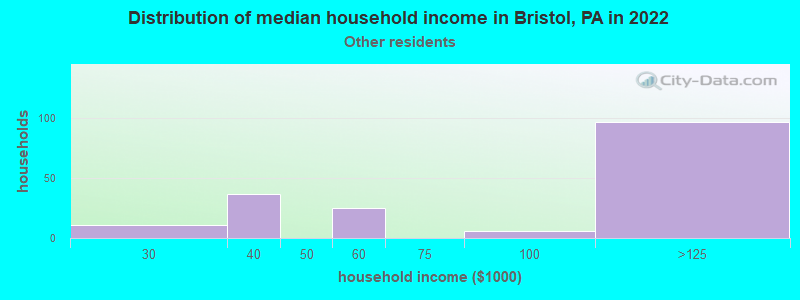
Household income for Some other race householders
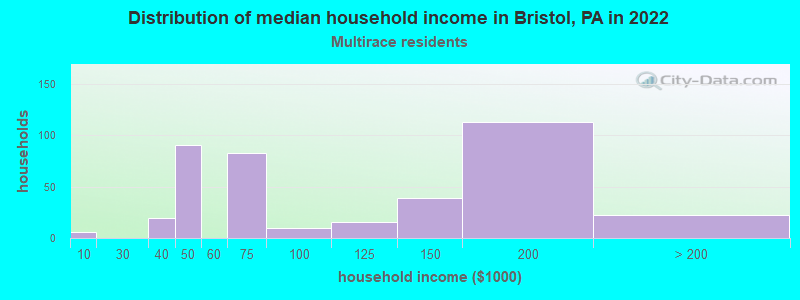
Household income for Two or more races householders
Household income for Hispanic or Latino race householders
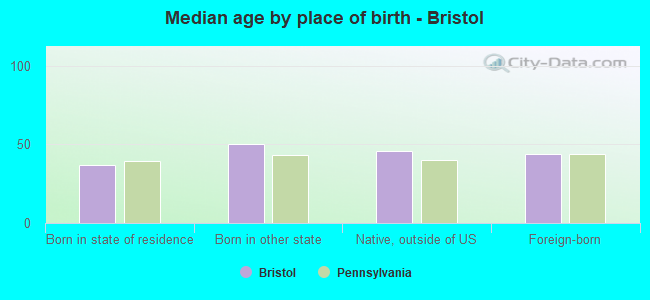
Median age by race in Bristol
- 40.0Median age for White residents
- 39.5Males
- 41.0Females
- 47.7Median age for Black or African American residents
- 33.7Males
- 53.0Females
- 27.2Median age for American Indian / Alaska Native residents
- 26.7Males
- -858,283,432.3Females
- 31.1Median age for Asian residents
- 50.6Males
- 20.6Females
- -680,432,644.4Median age for Native Hawaiian / Pacific Islander residents
- -649,523,808.9Males
- -747,474,746.7Females
- 35.0Median age for Other race residents
- 34.4Males
- 35.3Females
- 42.5Median age for Two or more races residents
- 18.6Males
- 49.8Females
- 40.4Median age for White alone residents
- 39.8Males
- 42.6Females
- 34.9Median age for Hispanic or Latino residents
- 31.5Males
- 38.7Females
Owner/renter occupied households by race in Bristol
- House owners and renters - White residents
- 2,06161.7%Owner occupied
- 1,28138.3%Renter occupied
- House owners and renters - Black or African American residents
- 15362.8%Owner occupied
- 9137.2%Renter occupied
- House owners and renters - American Indian / Alaska Native residents
- 1542.7%Owner occupied
- 2057.3%Renter occupied
- House owners and renters - Asian residents
- 8280.1%Owner occupied
- 2019.9%Renter occupied
- House owners and renters - Other race residents
- 3429.5%Owner occupied
- 8170.5%Renter occupied
- House owners and renters - Two or more races residents
- 32275.0%Owner occupied
- 10725.0%Renter occupied
- House owners and renters - White alone residents
- 1,94061.7%Owner occupied
- 1,20338.3%Renter occupied
- House owners and renters - Hispanic or Latino residents
- 35459.7%Owner occupied
- 23840.3%Renter occupied
Language usage in Bristol
- English speakers - Total
- 86.2% of residents of Bristol speak English at home.
- 11.5% of residents speak Spanish at home
- 80977.2%Speak English very well
- 23922.8%Speak English less than very well
- 3.0% of residents speak other language at home
- 8430.3%Speak English very well
- 19369.7%Speak English less than very well
- English speakers - Born in the United States
- 86.0% of residents of Bristol speak English at home.
- 9.5% of residents speak Spanish at home
- 12088.2%Speak English very well
- 1611.8%Speak English less than very well
- 3.5% of residents speak other language at home
- 4384.3%Speak English very well
- 815.7%Speak English less than very well
- English speakers - Native, born elsewhere
- 7.0% of residents of Bristol speak English at home.
- 67.3% of residents speak Spanish at home
- 8647.0%Speak English very well
- 9753.0%Speak English less than very well
- English speakers - Foreign-born
- 43.4% of residents of Bristol speak English at home.
- 16.6% of residents speak Spanish at home
- 57100.0%Speak English less than very well
- 39.4% of residents speak other language at home
- 128.9%Speak English very well
- 12391.1%Speak English less than very well
White (Caucasian) - Speak only English
| Native: | 91.4% (6,329) |
| Foreign-born: | 3.3% (1) |
White (Caucasian) - Speak another language
| Native: | 6.8% (474) |
| Foreign-born: | 97.7% (24) |
Black or African American - Speak only English
| Native: | 98.7% (559) |
| Foreign-born: | 60.6% (60) |
American Indian / Alaska Native - Speak only English
| Native: | 15.0% (11) |
| Foreign-born: | 71.9% (13) |
Asian - Speak only English
| Native: | 66.6% (46) |
| Foreign-born: | 35.6% (54) |
Asian - Speak another language
| Native: | 35.0% (24) |
| Foreign-born: | 64.9% (98) |
Other race - Speak another language
| Native: | 76.5% (289) |
| Foreign-born: | 88.4% (65) |
White alone - Speak only English
| Native: | 97.0% (6,017) |
| Foreign-born: | 3.2% (1) |
White alone - Speak another language
| Native: | 2.9% (178) |
| Foreign-born: | 99.3% (26) |
Hispanic or Latino - Speak only English
| Native: | 38.7% (532) |
| Foreign-born: | 24.1% (18) |
Hispanic or Latino - Speak another language
| Native: | 63.3% (871) |
| Foreign-born: | 77.4% (58) |
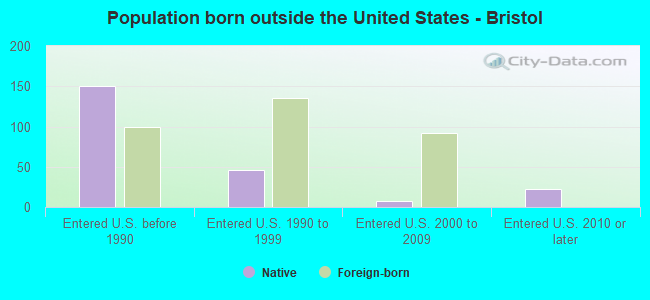
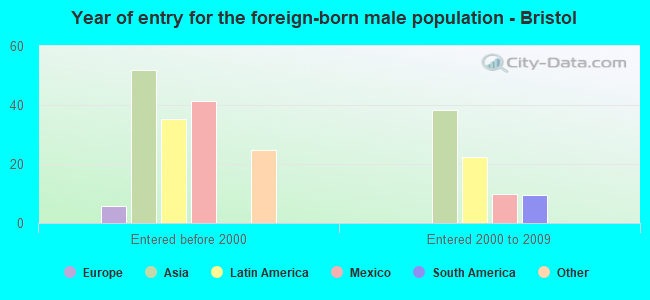
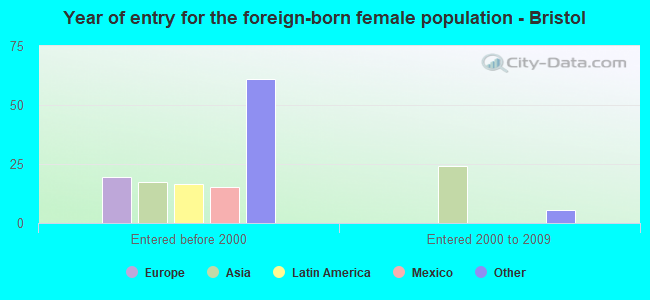
Foreign-born residents in Bristol
344 residents are foreign born (1.4% Asia, 1.0% Africa, 0.6% Latin America).
| This city: | 3.5% |
| Pennsylvania: | 7.3% |
Marital status for residents in Bristol
Marital status - White (Caucasian) population 15 years and over
- Males
- 37.5%Never married
- 45.7%Now married
- 3.8%Separated
- 2.9%Widowed
- 10.1%Divorced
- Females
- 30.0%Never married
- 39.2%Now married
- 1.7%Separated
- 11.6%Widowed
- 17.5%Divorced
Women who gave birth in the past 12 months
| Now married: | 41.1% (29) |
| Unmarried: | 58.9% (41) |
Women who did not give birth in the past 12 months
| Now married: | 37.5% (603) |
| Unmarried: | 62.5% (1,005) |
Marital status - Black or African American population 15 years and over
- Males
- 57.8%Never married
- 38.4%Now married
- 0.0%Separated
- 0.0%Widowed
- 3.8%Divorced
- Females
- 5.6%Never married
- 56.7%Now married
- 0.0%Separated
- 16.7%Widowed
- 21.0%Divorced
Women who did not give birth in the past 12 months
| Now married: | 93.3% (121) |
| Unmarried: | 6.7% (9) |
Marital status - American Indian / Alaska Native population 15 years and over
- Males
- 100.0%Never married
- 0.0%Now married
- 0.0%Separated
- 0.0%Widowed
- 0.0%Divorced
- Females
- 100.0%Never married
- 0.0%Now married
- 0.0%Separated
- 0.0%Widowed
- 0.0%Divorced
Women who did not give birth in the past 12 months
| Now married: | 0.0% (0) |
| Unmarried: | 100.0% (24) |
Marital status - Asian population 15 years and over
- Males
- 0.0%Never married
- 66.3%Now married
- 0.0%Separated
- 0.0%Widowed
- 33.7%Divorced
- Females
- 36.9%Never married
- 51.2%Now married
- 11.9%Separated
- 0.0%Widowed
- 0.0%Divorced
Women who did not give birth in the past 12 months
| Now married: | 62.7% (55) |
| Unmarried: | 37.3% (33) |
Marital status - Other race population 15 years and over
- Males
- 33.3%Never married
- 60.8%Now married
- 0.0%Separated
- 0.0%Widowed
- 5.8%Divorced
- Females
- 28.4%Never married
- 71.6%Now married
- 0.0%Separated
- 0.0%Widowed
- 0.0%Divorced
Women who did not give birth in the past 12 months
| Now married: | 40.8% (46) |
| Unmarried: | 59.2% (67) |
Marital status - Two or more races population 15 years and over
- Males
- 27.3%Never married
- 61.4%Now married
- 11.4%Separated
- 0.0%Widowed
- 0.0%Divorced
- Females
- 32.1%Never married
- 57.7%Now married
- 0.0%Separated
- 1.8%Widowed
- 8.4%Divorced
Women who did not give birth in the past 12 months
| Now married: | 55.5% (184) |
| Unmarried: | 44.5% (147) |
Marital status - White alone, not Hispanic / Latino population 15 years and over
- Males
- 37.2%Never married
- 47.6%Now married
- 3.5%Separated
- 1.9%Widowed
- 9.7%Divorced
- Females
- 28.9%Never married
- 41.2%Now married
- 2.0%Separated
- 11.8%Widowed
- 16.2%Divorced
Women who gave birth in the past 12 months
| Now married: | 63.8% (29) |
| Unmarried: | 36.2% (16) |
Women who did not give birth in the past 12 months
| Now married: | 39.0% (535) |
| Unmarried: | 61.0% (837) |
Marital status - Hispanic or Latino population 15 years and over
- Males
- 41.8%Never married
- 39.1%Now married
- 3.5%Separated
- 7.0%Widowed
- 8.6%Divorced
- Females
- 33.5%Never married
- 39.1%Now married
- 0.0%Separated
- 6.8%Widowed
- 20.6%Divorced
Women who gave birth in the past 12 months
| Now married: | 0.0% (0) |
| Unmarried: | 100.0% (29) |
Women who did not give birth in the past 12 months
| Now married: | 31.7% (149) |
| Unmarried: | 68.3% (320) |
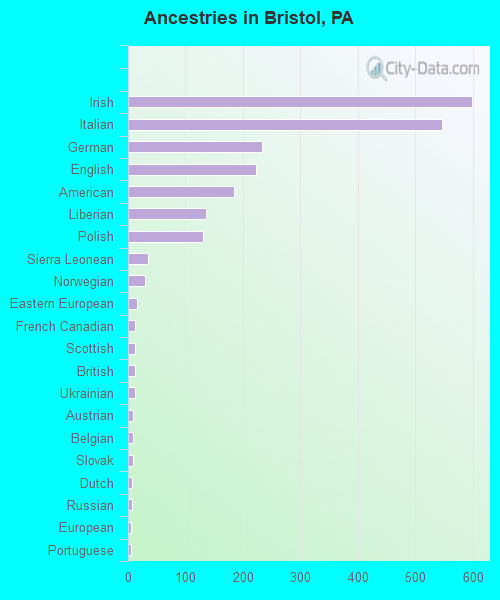
Ancestries in Bristol

- 59817.5%Irish
- 54616.0%Italian
- 2336.8%German
- 2236.5%English
- 1845.4%American
- 1364.0%Liberian
- 1313.8%Polish
- 341.0%Sierra Leonean
- 290.9%Norwegian
- 160.5%Eastern European
- 130.4%French Canadian
- 130.4%Scottish
- 120.4%British
- 120.4%Ukrainian
- 80.2%Austrian
- 80.2%Belgian
- 80.2%Slovak
- 70.2%Dutch
- 70.2%Russian
- 60.2%European
- 60.2%Portuguese
- 30.09%French
- 30.09%African
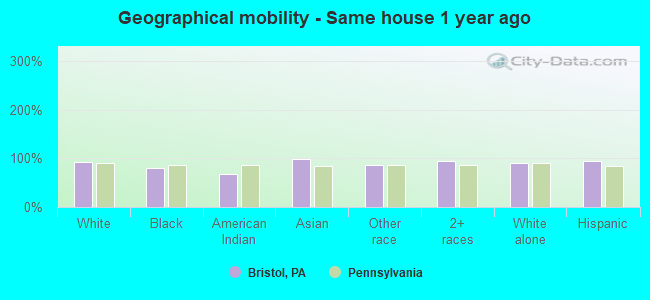
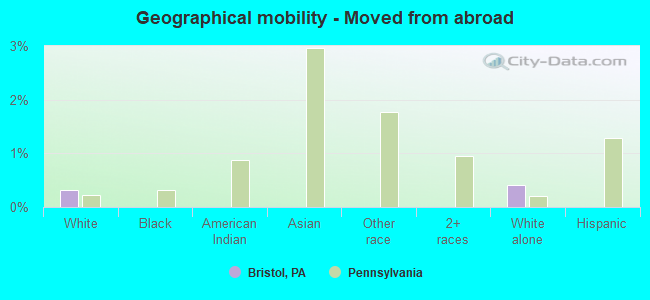
Geographical mobility in Bristol

- Same house 1 year ago
- 6,85492.0%White (Caucasian)
- 56179.1%Black or African American
- 6267.0%American Indian / Alaska Native
- 24198.8%Asian
- 38287.1%Other race
- 92694.9%Two or more races
- 6,05291.0%White alone, not Hispanic / Latino
- 1,55594.3%Hispanic or Latino
-
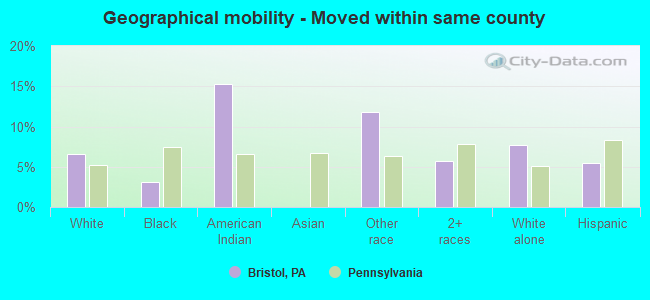
- Moved within same county
- 4946.6%White / Caucasian
- 223.1%Black or African American
- 1415.3%American Indian / Alaska Native
- 5211.9%Other race
- 565.8%Two or more races
- 5117.7%White alone, not Hispanic / Latino
- 905.4%Hispanic or Latino
-
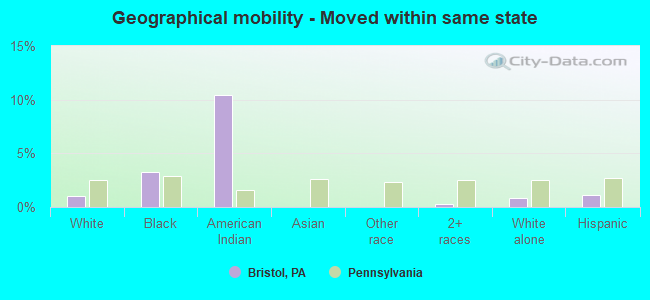
- Moved within same state
- 741.0%White / Caucasian
- 233.3%Black or African American
- 1010.5%American Indian / Alaska Native
- 30.3%Two or more races
- 560.8%White alone, not Hispanic / Latino
- 191.1%Hispanic or Latino
-
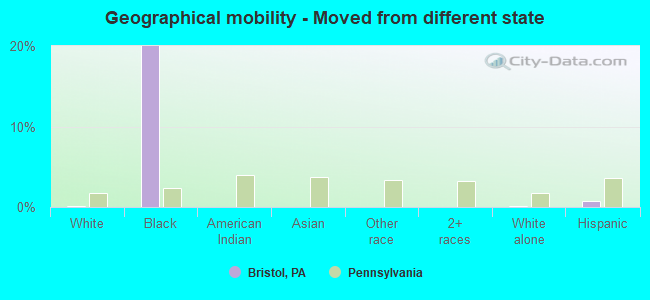
- Moved from different state
- 90.1%White / Caucasian
- 14220.0%Black or African American
- 90.1%White alone, not Hispanic / Latino
- 110.7%Hispanic or Latino
-
- Moved from abroad
- 240.3%White
- 270.4%White alone, not Hispanic / Latino
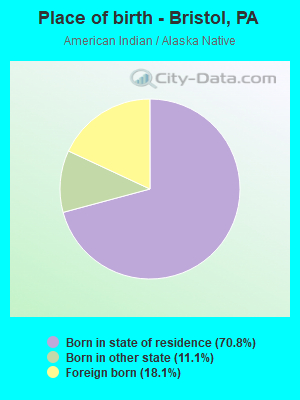
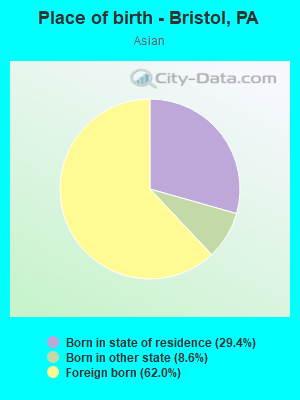
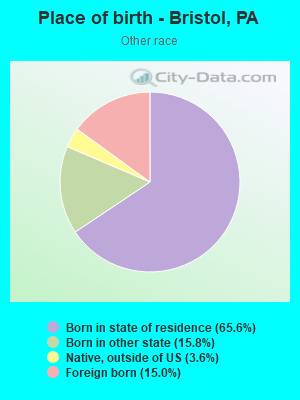
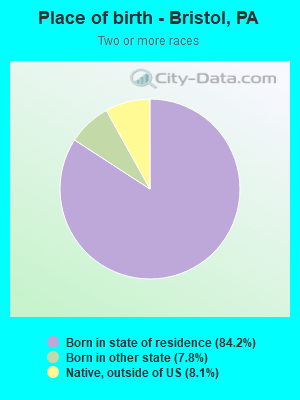
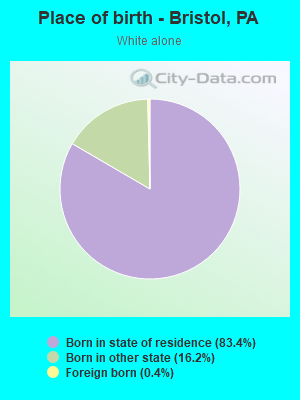
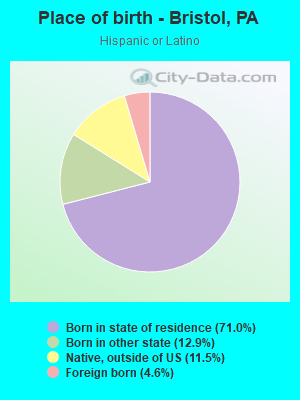
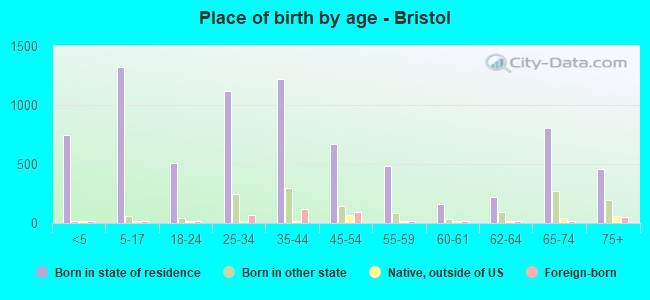
Children Nativity (place of birth) in Bristol
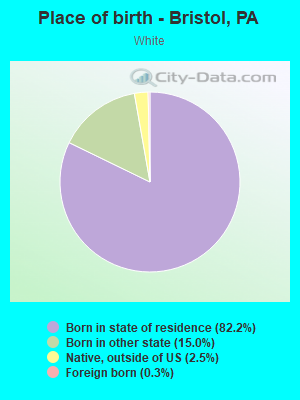
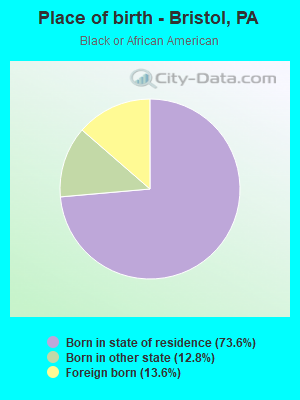
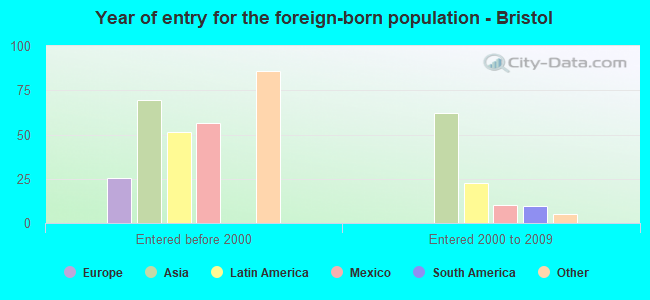
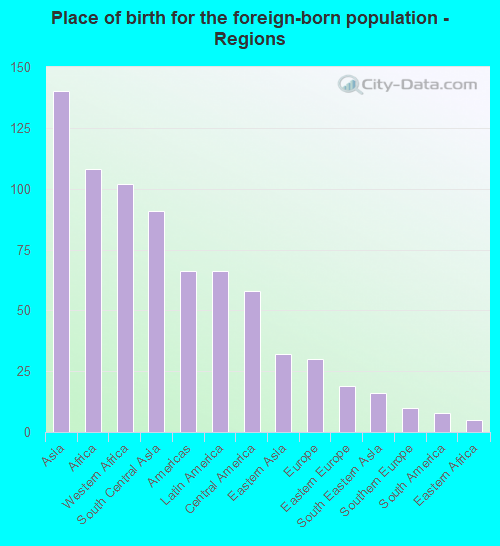
Place of birth for residents in Bristol
![Place of birth for the foreign-born population - Regions]()
- 140Asia
- 108Africa
- 102Western Africa
- 91South Central Asia
- 66Americas
- 66Latin America
- 58Central America
- 32Eastern Asia
- 30Europe
- 19Eastern Europe
- 16South Eastern Asia
- 10Southern Europe
- 8South America
- 5Eastern Africa
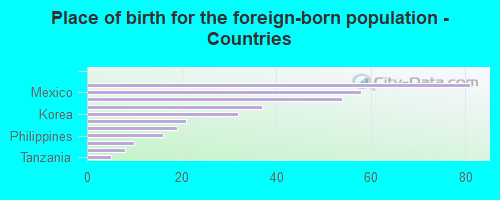
![Place of birth for the foreign-born population - Countries]()
- 81Liberia
- 58Mexico
- 54Bhutan
- 37India
- 32Korea
- 21Sierra Leone
- 19Poland
- 16Philippines
- 10Italy
- 8Ecuador
- 5Tanzania
Grandparents responsible for own grandchildren in Bristol
Zip codes: 19007.