Races in Boone, North Carolina (NC) Detailed Stats
Ancestries, Foreign-born residents, place of birth
Settings
X


Recent posts about races in Boone, North Carolina on our local forum with over 2,400,000 registered users:
 | Comparing Boone & Brevard to Black Mountain (50 replies) |
| Breakfast Spot Boone or Blowing Rock (7 replies) |
| Rentals around N. Wilkesboro and Boone (6 replies) |
| Living in Boone vs Asheville (28 replies) |
| Anyone familiar with both Boone, NC and Bellingham, WA? (59 replies) |
| Early Retirment in Boone, NC (27 replies) |
Latest news about races in Boone, NC collected exclusively by city-data.com from local newspapers, TV, and radio stations
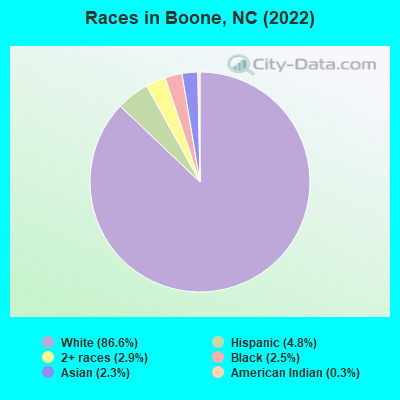
According to 2022 data, the most numerous races in Boone, NC are White alone (17,134 residents), Black alone (492 residents), and Hispanic (959 residents). 94.7% of Boone residents speak English at home. 3.4% of Boone, NC residents are foreign-born (1.3% born in Asia, 1.2% born in Europe, 0.6% born in Latin America), which is 134.2% less than the foreign-born rate of 8.0% across the entire state of North Carolina.
Race distribution in Boone
2000
2022

- 12,51892.9%White alone
- 4563.4%Black alone
- 2211.6%Hispanic
- 1601.2%Asian alone
- 740.5%Two or more races
- 290.2%American Indian alone
- 80.06%Other race alone
- 60.04%Native Hawaiian and Other
Pacific Islander alone

-
- 17,13486.6%White alone
- 9594.8%Hispanic
- 5802.9%Two or more races
- 4922.5%Black alone
- 4632.3%Asian alone
- 520.3%American Indian alone
2000
2022
-
- 5,647,15570.2%White alone
- 1,723,30121.4%Black alone
- 378,9634.7%Hispanic
- 112,4161.4%Asian alone
- 95,3331.2%American Indian alone
- 79,9651.0%Two or more races
- 9,0150.1%Other race alone
- 3,1650.04%Native Hawaiian and Other
Pacific Islander alone

-
- 6,497,51960.7%White alone
- 2,155,65020.1%Black alone
- 1,114,79910.4%Hispanic
- 438,0614.1%Two or more races
- 341,0523.2%Asian alone
- 91,7580.9%American Indian alone
- 50,1800.5%Other race alone
- 9,9540.09%Native Hawaiian and Other
Pacific Islander alone

Income and house value in Boone
- Median household income in 2022
- $28,250White non-Hispanic householders
- $105,860Asian householders
- $30,664Two or more races householders
- $31,761Hispanic or Latino race householders
- Median 2022 house value
- $401,932White Non-Hispanic householders
- $181,750Black or African American householders
- $397,309Asian householders
- $830,737Two or more races householders
Household income for White non-Hispanic householders

Household income for Black householders

Household income for Asian householders

Household income for Some other race householders

Household income for Two or more races householders

Household income for Hispanic or Latino race householders

Median age by race in Boone
- 21.7Median age for White residents
- 22.1Males
- 21.5Females
- 23.0Median age for Black or African American residents
- 27.4Males
- 21.2Females
- 48.2Median age for American Indian / Alaska Native residents
- -668,604,650.5Males
- 49.5Females
- 21.6Median age for Asian residents
- 20.9Males
- 21.8Females
- -609,884,331.7Median age for Native Hawaiian / Pacific Islander residents
- -611,708,482.1Males
- -612,403,100.2Females
- 20.9Median age for Other race residents
- 20.2Males
- 34.9Females
- 24.2Median age for Two or more races residents
- 25.0Males
- 23.6Females
- 21.4Median age for White alone residents
- 21.9Males
- 21.1Females
- 23.3Median age for Hispanic or Latino residents
- 25.4Males
- 22.1Females
Owner/renter occupied households by race in Boone
- House owners and renters - White residents
- 1,30024.6%Owner occupied
- 3,97975.4%Renter occupied
- House owners and renters - Black or African American residents
- 119100.0%Renter occupied
- House owners and renters - American Indian / Alaska Native residents
- 30100.0%Renter occupied
- House owners and renters - Asian residents
- 6771.4%Owner occupied
- 2728.6%Renter occupied
- House owners and renters - Other race residents
- 40100.0%Renter occupied
- House owners and renters - Two or more races residents
- 103.0%Owner occupied
- 31397.0%Renter occupied
- House owners and renters - White alone residents
- 1,30424.6%Owner occupied
- 4,00775.4%Renter occupied
- House owners and renters - Hispanic or Latino residents
- 134.8%Owner occupied
- 25195.2%Renter occupied
Language usage in Boone
- English speakers - Total
- 94.7% of residents of Boone speak English at home.
- 2.1% of residents speak Spanish at home
- 28768.2%Speak English very well
- 13431.8%Speak English less than very well
- 2.9% of residents speak other language at home
- 41173.1%Speak English very well
- 15126.9%Speak English less than very well
- English speakers - Born in the United States
- 97.7% of residents of Boone speak English at home.
- 1.0% of residents speak Spanish at home
- 65100.0%Speak English very well
- 1.2% of residents speak other language at home
- 74100.0%Speak English very well
- English speakers - Native, born elsewhere
- 38.5% of residents of Boone speak English at home.
- 41.0% of residents speak Spanish at home
- 3240.0%Speak English very well
- 4860.0%Speak English less than very well
- 26.2% of residents speak other language at home
- 51100.0%Speak English very well
- English speakers - Foreign-born
- 40.7% of residents of Boone speak English at home.
- 20.4% of residents speak Spanish at home
- 5036.2%Speak English very well
- 8863.8%Speak English less than very well
- 39.6% of residents speak other language at home
- 11944.6%Speak English very well
- 14855.4%Speak English less than very well
White (Caucasian) - Speak only English
| Native: | 99.2% (16,787) |
| Foreign-born: | 52.2% (103) |
White (Caucasian) - Speak another language
| Native: | 1.2% (207) |
| Foreign-born: | 52.8% (105) |
Black or African American - Speak only English
| Native: | 97.8% (497) |
| Foreign-born: | 100.0% (16) |
Asian - Speak only English
| Native: | 63.5% (158) |
| Foreign-born: | 62.0% (144) |
Asian - Speak another language
| Native: | 36.3% (91) |
| Foreign-born: | 37.1% (86) |
Other race - Speak another language
| Native: | 80.4% (66) |
| Foreign-born: | 100.0% (3) |
Two or more races - Speak another language
| Native: | 18.0% (152) |
| Foreign-born: | 100.0% (185) |
White alone - Speak only English
| Native: | 98.8% (16,530) |
| Foreign-born: | 27.8% (70) |
White alone - Speak another language
| Native: | 1.1% (189) |
| Foreign-born: | 72.2% (183) |
Hispanic or Latino - Speak only English
| Native: | 66.9% (539) |
| Foreign-born: | 23.3% (37) |
Hispanic or Latino - Speak another language
| Native: | 34.9% (282) |
| Foreign-born: | 77.1% (122) |
Foreign-born residents in Boone
676 residents are foreign born (1.3% Asia, 1.2% Europe, 0.6% Latin America).
| This city: | 3.4% |
| North Carolina: | 8.3% |


Marital status for residents in Boone
Marital status - White (Caucasian) population 15 years and over
- Males
- 79.5%Never married
- 14.7%Now married
- 1.7%Separated
- 1.6%Widowed
- 2.5%Divorced
- Females
- 80.0%Never married
- 10.6%Now married
- 1.2%Separated
- 2.9%Widowed
- 5.3%Divorced
Women who gave birth in the past 12 months
| Now married: | 81.1% (41) |
| Unmarried: | 18.9% (10) |
Women who did not give birth in the past 12 months
| Now married: | 8.6% (663) |
| Unmarried: | 91.4% (7,040) |
Marital status - Black or African American population 15 years and over
- Males
- 90.4%Never married
- 6.8%Now married
- 0.4%Separated
- 2.4%Widowed
- 0.0%Divorced
- Females
- 87.4%Never married
- 0.4%Now married
- 0.0%Separated
- 6.1%Widowed
- 6.1%Divorced
Women who did not give birth in the past 12 months
| Now married: | 0.0% (0) |
| Unmarried: | 100.0% (233) |
Marital status - American Indian / Alaska Native population 15 years and over
- Males
- 100.0%Never married
- 0.0%Now married
- 0.0%Separated
- 0.0%Widowed
- 0.0%Divorced
- Females
- 92.2%Never married
- 7.8%Now married
- 0.0%Separated
- 0.0%Widowed
- 0.0%Divorced
Women who did not give birth in the past 12 months
| Now married: | 0.0% (0) |
| Unmarried: | 100.0% (50) |
Marital status - Asian population 15 years and over
- Males
- 75.5%Never married
- 14.9%Now married
- 0.0%Separated
- 0.0%Widowed
- 9.6%Divorced
- Females
- 82.0%Never married
- 18.0%Now married
- 0.0%Separated
- 0.0%Widowed
- 0.0%Divorced
Women who did not give birth in the past 12 months
| Now married: | 10.5% (26) |
| Unmarried: | 89.5% (224) |
Marital status - Other race population 15 years and over
- Males
- 88.2%Never married
- 11.8%Now married
- 0.0%Separated
- 0.0%Widowed
- 0.0%Divorced
- Females
- 45.8%Never married
- 0.0%Now married
- 54.2%Separated
- 0.0%Widowed
- 0.0%Divorced
Women who did not give birth in the past 12 months
| Now married: | 54.2% (36) |
| Unmarried: | 45.8% (30) |
Marital status - Two or more races population 15 years and over
- Males
- 80.8%Never married
- 10.1%Now married
- 0.0%Separated
- 0.0%Widowed
- 9.1%Divorced
- Females
- 86.3%Never married
- 8.3%Now married
- 0.0%Separated
- 0.0%Widowed
- 5.3%Divorced
Women who did not give birth in the past 12 months
| Now married: | 5.1% (19) |
| Unmarried: | 94.9% (354) |
Marital status - White alone, not Hispanic / Latino population 15 years and over
- Males
- 79.7%Never married
- 14.9%Now married
- 1.8%Separated
- 1.6%Widowed
- 2.0%Divorced
- Females
- 80.3%Never married
- 10.8%Now married
- 1.2%Separated
- 3.0%Widowed
- 4.7%Divorced
Women who gave birth in the past 12 months
| Now married: | 81.1% (43) |
| Unmarried: | 18.9% (10) |
Women who did not give birth in the past 12 months
| Now married: | 8.8% (679) |
| Unmarried: | 91.2% (7,080) |
Marital status - Hispanic or Latino population 15 years and over
- Males
- 74.5%Never married
- 14.8%Now married
- 0.0%Separated
- 0.0%Widowed
- 10.8%Divorced
- Females
- 69.6%Never married
- 5.9%Now married
- 6.1%Separated
- 0.0%Widowed
- 18.4%Divorced
Women who did not give birth in the past 12 months
| Now married: | 10.6% (43) |
| Unmarried: | 89.4% (364) |
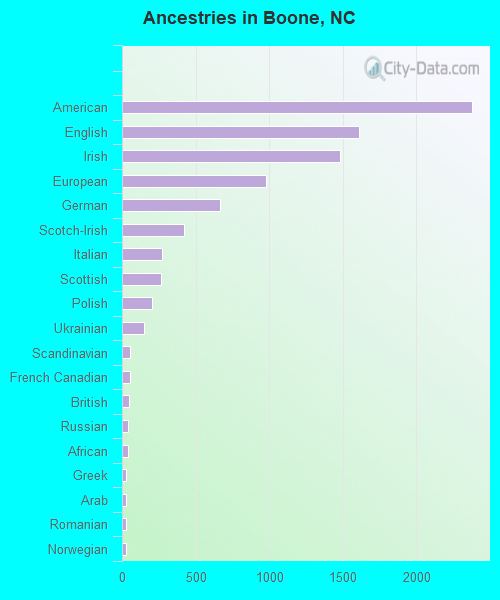
Ancestries in Boone

- 2,37621.5%American
- 1,61114.6%English
- 1,48213.4%Irish
- 9768.8%European
- 6646.0%German
- 4243.8%Scotch-Irish
- 2752.5%Italian
- 2682.4%Scottish
- 2031.8%Polish
- 1501.4%Ukrainian
- 560.5%Scandinavian
- 510.5%French Canadian
- 480.4%British
- 420.4%Russian
- 380.3%African
- 300.3%Greek
- 290.3%Arab
- 280.3%Romanian
- 270.2%Norwegian
- 160.1%Northern European
- 140.1%French
- 110.10%Lithuanian
- 80.07%Latvian
- 80.07%Welsh
- 50.05%Danish
Geographical mobility in Boone

- Same house 1 year ago
- 8,04047.1%White (Caucasian)
- 34966.1%Black or African American
- 1016.6%American Indian / Alaska Native
- 36977.5%Asian
- 5060.2%Other race
- 48546.2%Two or more races
- 7,91846.4%White alone, not Hispanic / Latino
- 59762.2%Hispanic or Latino

-
- Moved within same county
- 2,82416.5%White / Caucasian
- 6111.6%Black or African American
- 194.1%Asian
- 20119.1%Two or more races
- 2,91917.1%White alone, not Hispanic / Latino
- 14515.1%Hispanic or Latino

-
- Moved within same state
- 4,80228.1%White / Caucasian
- 9818.5%Black or African American
- 3660.6%American Indian / Alaska Native
- 5912.3%Asian
- 3744.5%Other race
- 30429.0%Two or more races
- 4,87028.5%White alone, not Hispanic / Latino
- 15616.2%Hispanic or Latino

-
- Moved from different state
- 8585.0%White / Caucasian
- 40.8%Black or African American
- 183.8%Asian
- 70.6%Two or more races
- 8635.1%White alone, not Hispanic / Latino
- 303.1%Hispanic or Latino

-
- Moved from abroad
- 270.2%White
- 111.0%Two or more races
- 220.1%White alone, not Hispanic / Latino
- 171.8%Hispanic or Latino

Children Nativity (place of birth) in Boone
Place of birth for residents in Boone
![Place of birth for the foreign-born population - Regions]()
- 268Asia
- 240Europe
- 153Eastern Europe
- 151Americas
- 129Eastern Asia
- 125Latin America
- 125Central America
- 92South Eastern Asia
- 50Northern Europe
- 45South Central Asia
- 36Southern Europe
- 32China
- 25Northern America
- 15Africa
- 15Southern Africa

![Place of birth for the foreign-born population - Countries]()
- 139Ukraine
- 97Korea
- 92Vietnam
- 91Mexico
- 39England
- 36Spain
- 33Honduras
- 32China
- 25Canada
- 23Nepal
- 22Iran
- 11Denmark
- 8Russia
- 5Latvia

Grandparents responsible for own grandchildren in Boone
Zip codes: 28607.