Races in Bon Air, Virginia (VA) Detailed Stats
Data:
Races - White alone (%)
Races - White alone (% change since 2000)
Races - Black alone (%)
Races - Black alone (% change since 2000)
Races - American Indian alone (%)
Races - American Indian alone (% change since 2000)
Races - Asian alone (%)
Races - Asian alone (% change since 2000)
Races - Hispanic (%)
Races - Hispanic (% change since 2000)
Races - Native Hawaiian and Other Pacific Islander alone (%)
Races - Native Hawaiian and Other Pacific Islander alone (% change since 2000)
Races - Two or more races(%)
Races - Two or more races(% change since 2000)
Races - Other race alone (%)
Races - Other race alone (% change since 2000)
Racial diversity
Place of birth - Born in state of residence (%)
Place of birth - Born in state of residence (%) - White
Place of birth - Born in state of residence (%) - Black or African American
Place of birth - Born in state of residence (%) - Asian
Place of birth - Born in state of residence (%) - Hispanic or Latino
Place of birth - Born in state of residence (%) - American Indian and Alaska Native
Place of birth - Born in state of residence (%) - Multirace
Place of birth - Born in state of residence (%) - Other Race
Place of birth - Born in other state (%)
Place of birth - Born in other state (%) - White
Place of birth - Born in other state (%) - Black or African American
Place of birth - Born in other state (%) - Asian
Place of birth - Born in other state (%) - Hispanic or Latino
Place of birth - Born in other state (%) - American Indian and Alaska Native
Place of birth - Born in other state (%) - Multirace
Place of birth - Born in other state (%) - Other Race
Place of birth - Native, outside of US (%)
Place of birth - Native, outside of US (%) - White
Place of birth - Native, outside of US (%) - Black or African American
Place of birth - Native, outside of US (%) - Asian
Place of birth - Native, outside of US (%) - Hispanic or Latino
Place of birth - Native, outside of US (%) - American Indian and Alaska Native
Place of birth - Native, outside of US (%) - Multirace
Place of birth - Native, outside of US (%) - Other Race
Place of birth - Foreign born (%)
Place of birth - Foreign born (%) - White
Place of birth - Foreign born (%) - Black or African American
Place of birth - Foreign born (%) - Asian
Place of birth - Foreign born (%) - Hispanic or Latino
Place of birth - Foreign born (%) - American Indian and Alaska Native
Place of birth - Foreign born (%) - Multirace
Place of birth - Foreign born (%) - Other Race
Residents speaking English at home (%)
Residents speaking English at home - Born in the United States (%)
Residents speaking English at home - Native, born elsewhere (%)
Residents speaking English at home - Foreign born (%)
Residents speaking Spanish at home (%)
Residents speaking Spanish at home - Born in the United States (%)
Residents speaking Spanish at home - Native, born elsewhere (%)
Residents speaking Spanish at home - Foreign born (%)
Residents speaking other language at home (%)
Residents speaking other language at home - Born in the United States (%)
Residents speaking other language at home - Native, born elsewhere (%)
Residents speaking other language at home - Foreign born (%)
Marital status - Never married (%)
Marital status - Now married (%)
Marital status - Separated (%)
Marital status - Widowed (%)
Marital status - Divorced (%)
Ancestries Reported - Arab (%)
Ancestries Reported - Czech (%)
Ancestries Reported - Danish (%)
Ancestries Reported - Dutch (%)
Ancestries Reported - English (%)
Ancestries Reported - French (%)
Ancestries Reported - French Canadian (%)
Ancestries Reported - German (%)
Ancestries Reported - Greek (%)
Ancestries Reported - Hungarian (%)
Ancestries Reported - Irish (%)
Ancestries Reported - Italian (%)
Ancestries Reported - Lithuanian (%)
Ancestries Reported - Norwegian (%)
Ancestries Reported - Polish (%)
Ancestries Reported - Portuguese (%)
Ancestries Reported - Russian (%)
Ancestries Reported - Scotch-Irish (%)
Ancestries Reported - Scottish (%)
Ancestries Reported - Slovak (%)
Ancestries Reported - Subsaharan African (%)
Ancestries Reported - Swedish (%)
Ancestries Reported - Swiss (%)
Ancestries Reported - Ukrainian (%)
Ancestries Reported - United States (%)
Ancestries Reported - Welsh (%)
Ancestries Reported - West Indian (%)
Ancestries Reported - Other (%)
Geographical mobility - Same house 1 year ago (%)
Geographical mobility - Same house 1 year ago (%) - White
Geographical mobility - Same house 1 year ago (%) - Black or African American
Geographical mobility - Same house 1 year ago (%) - Asian
Geographical mobility - Same house 1 year ago (%) - Hispanic or Latino
Geographical mobility - Same house 1 year ago (%) - American Indian and Alaska Native
Geographical mobility - Same house 1 year ago (%) - Multirace
Geographical mobility - Same house 1 year ago (%) - Other Race
Geographical mobility - Moved within same county (%)
Geographical mobility - Moved within same county (%) - White
Geographical mobility - Moved within same county (%) - Black or African American
Geographical mobility - Moved within same county (%) - Asian
Geographical mobility - Moved within same county (%) - Hispanic or Latino
Geographical mobility - Moved within same county (%) - American Indian and Alaska Native
Geographical mobility - Moved within same county (%) - Multirace
Geographical mobility - Moved within same county (%) - Other Race
Geographical mobility - Moved from different county within same state (%)
Geographical mobility - Moved from different county within same state (%) - White
Geographical mobility - Moved from different county within same state (%) - Black or African American
Geographical mobility - Moved from different county within same state (%) - Asian
Geographical mobility - Moved from different county within same state (%) - Hispanic or Latino
Geographical mobility - Moved from different county within same state (%) - American Indian and Alaska Native
Geographical mobility - Moved from different county within same state (%) - Multirace
Geographical mobility - Moved from different county within same state (%) - Other Race
Geographical mobility - Moved from different state (%)
Geographical mobility - Moved from different state (%) - White
Geographical mobility - Moved from different state (%) - Black or African American
Geographical mobility - Moved from different state (%) - Asian
Geographical mobility - Moved from different state (%) - Hispanic or Latino
Geographical mobility - Moved from different state (%) - American Indian and Alaska Native
Geographical mobility - Moved from different state (%) - Multirace
Geographical mobility - Moved from different state (%) - Other Race
Geographical mobility - Moved from abroad (%)
Geographical mobility - Moved from abroad (%) - White
Geographical mobility - Moved from abroad (%) - Black or African American
Geographical mobility - Moved from abroad (%) - Asian
Geographical mobility - Moved from abroad (%) - Hispanic or Latino
Geographical mobility - Moved from abroad (%) - American Indian and Alaska Native
Geographical mobility - Moved from abroad (%) - Multirace
Geographical mobility - Moved from abroad (%) - Other Race
Place of birth for the foreign-born population - Ireland (%)
Place of birth for the foreign-born population - Denmark (%)
Place of birth for the foreign-born population - Norway (%)
Place of birth for the foreign-born population - Sweden (%)
Place of birth for the foreign-born population - United Kingdom (%)
Place of birth for the foreign-born population - England (%)
Place of birth for the foreign-born population - Scotland (%)
Place of birth for the foreign-born population - Other Northern Europe (%)
Place of birth for the foreign-born population - Austria (%)
Place of birth for the foreign-born population - Belgium (%)
Place of birth for the foreign-born population - France (%)
Place of birth for the foreign-born population - Germany (%)
Place of birth for the foreign-born population - Netherlands (%)
Place of birth for the foreign-born population - Switzerland (%)
Place of birth for the foreign-born population - Other Western Europe (%)
Place of birth for the foreign-born population - Greece (%)
Place of birth for the foreign-born population - Italy (%)
Place of birth for the foreign-born population - Portugal (%)
Place of birth for the foreign-born population - Spain (%)
Place of birth for the foreign-born population - Other Southern Europe (%)
Place of birth for the foreign-born population - Albania (%)
Place of birth for the foreign-born population - Belarus (%)
Place of birth for the foreign-born population - Bosnia and Herzegovina (%)
Place of birth for the foreign-born population - Bulgaria (%)
Place of birth for the foreign-born population - Croatia (%)
Place of birth for the foreign-born population - Czechoslovakia (%)
Place of birth for the foreign-born population - Hungary (%)
Place of birth for the foreign-born population - Latvia (%)
Place of birth for the foreign-born population - Lithuania (%)
Place of birth for the foreign-born population - North Macedonia (Macedonia) (%)
Place of birth for the foreign-born population - Moldova (%)
Place of birth for the foreign-born population - Poland (%)
Place of birth for the foreign-born population - Romania (%)
Place of birth for the foreign-born population - Russia (%)
Place of birth for the foreign-born population - Serbia (%)
Place of birth for the foreign-born population - Ukraine (%)
Place of birth for the foreign-born population - Other Eastern Europe (%)
Place of birth for the foreign-born population - China (%)
Place of birth for the foreign-born population - Hong Kong (%)
Place of birth for the foreign-born population - Taiwan (%)
Place of birth for the foreign-born population - Japan (%)
Place of birth for the foreign-born population - Korea (%)
Place of birth for the foreign-born population - Other Eastern Asia (%)
Place of birth for the foreign-born population - Afghanistan (%)
Place of birth for the foreign-born population - Bangladesh (%)
Place of birth for the foreign-born population - India (%)
Place of birth for the foreign-born population - Iran (%)
Place of birth for the foreign-born population - Kazakhstan (%)
Place of birth for the foreign-born population - Nepal (%)
Place of birth for the foreign-born population - Pakistan (%)
Place of birth for the foreign-born population - Sri Lanka (%)
Place of birth for the foreign-born population - Uzbekistan (%)
Place of birth for the foreign-born population - Other South Central Asia (%)
Place of birth for the foreign-born population - Burma (%)
Place of birth for the foreign-born population - Cambodia (%)
Place of birth for the foreign-born population - Indonesia (%)
Place of birth for the foreign-born population - Laos (%)
Place of birth for the foreign-born population - Malaysia (%)
Place of birth for the foreign-born population - Philippines (%)
Place of birth for the foreign-born population - Singapore (%)
Place of birth for the foreign-born population - Thailand (%)
Place of birth for the foreign-born population - Vietnam (%)
Place of birth for the foreign-born population - Other South Eastern Asia (%)
Place of birth for the foreign-born population - Armenia (%)
Place of birth for the foreign-born population - Iraq (%)
Place of birth for the foreign-born population - Israel (%)
Place of birth for the foreign-born population - Jordan (%)
Place of birth for the foreign-born population - Kuwait (%)
Place of birth for the foreign-born population - Lebanon (%)
Place of birth for the foreign-born population - Saudi Arabia (%)
Place of birth for the foreign-born population - Syria (%)
Place of birth for the foreign-born population - Turkey (%)
Place of birth for the foreign-born population - Yemen (%)
Place of birth for the foreign-born population - Other Western Asia (%)
Place of birth for the foreign-born population - Eritrea (%)
Place of birth for the foreign-born population - Ethiopia (%)
Place of birth for the foreign-born population - Kenya (%)
Place of birth for the foreign-born population - Somalia (%)
Place of birth for the foreign-born population - Uganda (%)
Place of birth for the foreign-born population - Zimbabwe (%)
Place of birth for the foreign-born population - Other Eastern Africa (%)
Place of birth for the foreign-born population - Cameroon (%)
Place of birth for the foreign-born population - Congo (%)
Place of birth for the foreign-born population - Democratic Republic of Congo (Zaire) (%)
Place of birth for the foreign-born population - Other Middle Africa (%)
Place of birth for the foreign-born population - Egypt (%)
Place of birth for the foreign-born population - Morocco (%)
Place of birth for the foreign-born population - Sudan (%)
Place of birth for the foreign-born population - Other Northern Africa (%)
Place of birth for the foreign-born population - South Africa (%)
Place of birth for the foreign-born population - Other Southern Africa (%)
Place of birth for the foreign-born population - Cabo Verde (%)
Place of birth for the foreign-born population - Ghana (%)
Place of birth for the foreign-born population - Liberia (%)
Place of birth for the foreign-born population - Nigeria (%)
Place of birth for the foreign-born population - Senegal (%)
Place of birth for the foreign-born population - Sierra Leone (%)
Place of birth for the foreign-born population - Other Western Africa (%)
Place of birth for the foreign-born population - Australia (%)
Place of birth for the foreign-born population - New Zealand (%)
Place of birth for the foreign-born population - Fiji (%)
Place of birth for the foreign-born population - Micronesia (%)
Place of birth for the foreign-born population - Bahamas (%)
Place of birth for the foreign-born population - Barbados (%)
Place of birth for the foreign-born population - Cuba (%)
Place of birth for the foreign-born population - Dominica (%)
Place of birth for the foreign-born population - Dominican Republic (%)
Place of birth for the foreign-born population - Grenada (%)
Place of birth for the foreign-born population - Haiti (%)
Place of birth for the foreign-born population - Jamaica (%)
Place of birth for the foreign-born population - St. Vincent and the Grenadines (%)
Place of birth for the foreign-born population - Trinidad and Tobago (%)
Place of birth for the foreign-born population - West Indies (%)
Place of birth for the foreign-born population - Other Caribbean (%)
Place of birth for the foreign-born population - Belize (%)
Place of birth for the foreign-born population - Costa Rica (%)
Place of birth for the foreign-born population - El Salvador (%)
Place of birth for the foreign-born population - Guatemala (%)
Place of birth for the foreign-born population - Honduras (%)
Place of birth for the foreign-born population - Mexico (%)
Place of birth for the foreign-born population - Nicaragua (%)
Place of birth for the foreign-born population - Panama (%)
Place of birth for the foreign-born population - Other Central America (%)
Place of birth for the foreign-born population - Argentina (%)
Place of birth for the foreign-born population - Bolivia (%)
Place of birth for the foreign-born population - Brazil (%)
Place of birth for the foreign-born population - Chile (%)
Place of birth for the foreign-born population - Colombia (%)
Place of birth for the foreign-born population - Ecuador (%)
Place of birth for the foreign-born population - Guyana (%)
Place of birth for the foreign-born population - Peru (%)
Place of birth for the foreign-born population - Uruguay (%)
Place of birth for the foreign-born population - Venezuela (%)
Place of birth for the foreign-born population - Other South America (%)
Place of birth for the foreign-born population - Canada (%)
Place of birth for the foreign-born population - Other Northern America (%)
Place of birth for the foreign-born population - Other (%)
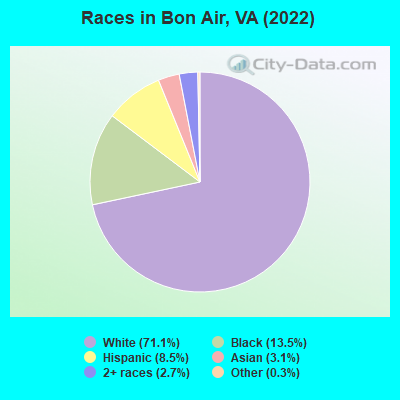
According to 2022 data, the most numerous races in Bon Air, VA are White alone (12,822 residents), Black alone (2,438 residents), and Hispanic (1,530 residents). 89.6% of Bon Air residents speak English at home. 6.9% of Bon Air, VA residents are foreign-born (3.3% born in Latin America, 2.2% born in Asia, 1.3% born in Europe), which is 73.5% less than the foreign-born rate of 12.0% across the entire state of Virginia.
Race distribution in Bon Air
2000 2022
4,965,637 70.2% White alone 1,376,378 19.4% Black alone 329,540 4.7% Hispanic 259,277 3.7% Asian alone 114,022 1.6% Two or more races 18,596 0.3% American Indian alone 11,685 0.2% Other race alone 3,380 0.05% Native Hawaiian and Other
5,095,130 58.7% White alone 1,594,785 18.4% Black alone 905,750 10.4% Hispanic 602,881 6.9% Asian alone 406,047 4.7% Two or more races 60,419 0.7% Other race alone 11,738 0.1% American Indian alone 6,869 0.08% Native Hawaiian and Other
Income and house value in Bon Air Median household income in 2022 $102,197 White non-Hispanic householders$99,549 Black householders$69,252 Asian householders$51,559 Some other race householders$92,562 Two or more races householders$58,375 Hispanic or Latino race householdersMedian 2022 house value $340,295 White Non-Hispanic householders$315,278 Black or African American householders$329,535 American Indian or Alaska Native householders $349,442 Asian householders$255,558 Some other race householders$700,498 Two or more races householders$255,558 Hispanic or Latino householders
Median age by race in Bon Air
43.3 Median age for White residents43.0 43.3 42.3 Median age for Black or African American residents34.6 44.3 -682,215,742.8 Median age for American Indian / Alaska Native residents-682,352,940.5 -687,861,271.0 44.8 Median age for Asian residents49.5 42.9 -611,955,419.9 Median age for Native Hawaiian / Pacific Islander residents-541,531,822.5 -714,150,046.8 34.9 Median age for Other race residents37.4 23.2 39.0 Median age for Two or more races residents45.6 28.3 43.1 Median age for White alone residents42.7 43.5 30.1 Median age for Hispanic or Latino residents37.0 23.1
Owner/renter occupied households by race in Bon Air
House owners and renters - White residents 4,467 80.1% Owner occupied1,113 19.9% Renter occupiedHouse owners and renters - Black or African American residents 418 42.5% Owner occupied567 57.5% Renter occupiedHouse owners and renters - Asian residents 138 83.6% Owner occupied27 16.4% Renter occupiedHouse owners and renters - Other race residents 138 100.0% Owner occupiedHouse owners and renters - Two or more races residents 90 38.7% Owner occupied142 61.3% Renter occupiedHouse owners and renters - White alone residents 4,431 79.6% Owner occupied1,138 20.4% Renter occupiedHouse owners and renters - Hispanic or Latino residents 278 81.4% Owner occupied63 18.6% Renter occupied
Language usage in Bon Air
English speakers - Total 89.6% of residents of Bon Air speak English at home.
6.3% of residents speak Spanish at home 746 68.7% Speak English very well340 31.3% Speak English less than very well4.1% of residents speak other language at home 451 64.2% Speak English very well251 35.8% Speak English less than very well
English speakers - Born in the United States 96.7% of residents of Bon Air speak English at home.
1.6% of residents speak Spanish at home 113 100.0% Speak English very well1.2% of residents speak other language at home 68 86.1% Speak English very well11 13.9% Speak English less than very well
English speakers - Native, born elsewhere 86.5% of residents of Bon Air speak English at home.
20.4% of residents speak Spanish at home 62 83.8% Speak English very well12 16.2% Speak English less than very well
English speakers - Foreign-born 28.1% of residents of Bon Air speak English at home.
34.3% of residents speak Spanish at home 165 37.2% Speak English very well279 62.8% Speak English less than very well38.8% of residents speak other language at home 322 64.1% Speak English very well180 35.9% Speak English less than very well
White (Caucasian) - Speak only English Native:
98.8% (11,799)Foreign-born:
47.0% (141)
White (Caucasian) - Speak another language Native:
1.6% (189)Foreign-born:
58.8% (176)
Black or African American - Speak only English Native:
95.6% (2,412)Foreign-born:
38.7% (63)
Black or African American - Speak another language Native:
5.1% (129)Foreign-born:
57.0% (93)
Asian - Speak only English Native:
27.2% (35)Foreign-born:
22.4% (92)
Asian - Speak another language Native:
77.3% (101)Foreign-born:
76.6% (315)
Other race - Speak another language Native:
82.1% (334)Foreign-born:
92.4% (212)
Two or more races - Speak only English Native:
84.5% (660)Foreign-born:
19.9% (21)
Two or more races - Speak another language Native:
14.9% (116)Foreign-born:
80.6% (86)
White alone - Speak only English Native:
98.2% (11,741)Foreign-born:
61.0% (144)
White alone - Speak another language Native:
1.8% (216)Foreign-born:
43.1% (102)
Hispanic or Latino - Speak another language Native:
47.1% (474)Foreign-born:
97.9% (468)
Foreign-born residents in Bon Air 1,248 residents are foreign born (3.3% Latin America , 2.2% Asia , 1.3% Europe ).
This city:
6.9%Virginia:
12.6%
Marital status for residents in Bon Air Marital status - White (Caucasian) population 15 years and over
Males 27.9% Never married55.4% Now married0.8% Separated4.6% Widowed11.2% DivorcedFemales 25.8% Never married48.9% Now married1.2% Separated12.1% Widowed12.0% DivorcedWomen who gave birth in the past 12 months Now married:
71.6% (102)Unmarried:
28.4% (41)
Women who did not give birth in the past 12 months Now married:
46.4% (1,244)Unmarried:
53.6% (1,437)
Marital status - Black or African American population 15 years and over
Males 56.1% Never married36.7% Now married0.0% Separated1.1% Widowed6.1% DivorcedFemales 24.2% Never married47.0% Now married9.2% Separated2.6% Widowed17.0% DivorcedWomen who did not give birth in the past 12 months Now married:
62.5% (461)Unmarried:
37.5% (277)
Marital status - Asian population 15 years and over
Males 19.3% Never married80.7% Now married0.0% Separated0.0% Widowed0.0% DivorcedFemales 15.3% Never married75.7% Now married0.0% Separated9.0% Widowed0.0% DivorcedWomen who did not give birth in the past 12 months Now married:
77.0% (115)Unmarried:
23.0% (34)
Marital status - Other race population 15 years and over
Males 29.4% Never married45.8% Now married0.0% Separated0.0% Widowed24.9% DivorcedFemales 26.5% Never married70.4% Now married0.0% Separated3.0% Widowed0.0% DivorcedWomen who gave birth in the past 12 months Now married:
0.0% (0)Unmarried:
100.0% (30)
Women who did not give birth in the past 12 months Now married:
95.7% (143)Unmarried:
4.3% (6)
Marital status - Two or more races population 15 years and over
Males 46.0% Never married54.0% Now married0.0% Separated0.0% Widowed0.0% DivorcedFemales 70.3% Never married12.3% Now married0.0% Separated4.3% Widowed13.0% DivorcedWomen who did not give birth in the past 12 months Now married:
17.0% (36)Unmarried:
83.0% (176)
Marital status - White alone, not Hispanic / Latino population 15 years and over
Males 27.3% Never married56.2% Now married0.9% Separated4.8% Widowed10.7% DivorcedFemales 26.0% Never married48.2% Now married1.3% Separated12.4% Widowed12.2% DivorcedWomen who gave birth in the past 12 months Now married:
71.4% (104)Unmarried:
28.6% (42)
Women who did not give birth in the past 12 months Now married:
45.7% (1,215)Unmarried:
54.3% (1,444)
Marital status - Hispanic or Latino population 15 years and over
Males 32.9% Never married49.4% Now married0.0% Separated0.0% Widowed17.7% DivorcedFemales 24.9% Never married66.1% Now married0.0% Separated2.4% Widowed6.6% DivorcedWomen who gave birth in the past 12 months Now married:
3.4% (1)Unmarried:
96.6% (33)
Women who did not give birth in the past 12 months Now married:
77.2% (308)Unmarried:
22.8% (91)
Ancestries in Bon Air
1,555 19.2% English662 8.2% American656 8.1% German519 6.4% Irish235 2.9% European189 2.3% Scotch-Irish163 2.0% Scottish149 1.8% Ukrainian126 1.6% British104 1.3% Italian103 1.3% Polish63 0.8% Eastern European56 0.7% Ugandan45 0.6% Swedish39 0.5% African38 0.5% Swiss29 0.4% Slovak23 0.3% Dutch22 0.3% French22 0.3% Cape Verdean22 0.3% British West Indian22 0.3% Jamaican20 0.2% Austrian19 0.2% Canadian19 0.2% Israeli15 0.2% Czechoslovakian10 0.1% Russian8 0.10% Lithuanian8 0.10% Welsh4 0.05% Northern European3 0.04% Jordanian1 0.01% Danish
Children Nativity (place of birth) in Bon Air
Children under 6 years - Living with two parents Both parents native 710 100.0% NativeBoth parents foreign-born 121 100.0% NativeOne native, one foreign-born parent 9 100.0% NativeChildren under 6 years - Living with one parent Native parent 147 100.0% NativeForeign-born parent 49 100.0% NativeChildren 6 to 17 years - Living with two parents Both parents native 1,422 100.0% NativeBoth parents foreign-born 251 84.4% Native46 15.6% Foreign-bornOne native, one foreign-born parent 83 100.0% NativeChildren 6 to 17 years - Living with one parent Native parent 593 100.0% NativeForeign-born parent 143 46.9% Native162 53.1% Foreign-born
Grandparents responsible for own grandchildren in Bon Air
Grandparents (30 to 59 years) White / Caucasian 11 100.0% Not responsible for grandchildrenBlack or African American 13 74.6% Responsible for grandchildren5 25.4% Not responsible for grandchildrenWhite alone, not Hispanic / Latino 12 100.0% Not responsible for grandchildrenGrandparents (60 years and over) White / Caucasian 38 56.0% Responsible for grandchildren30 44.0% Not responsible for grandchildrenBlack or African American 38 64.2% Responsible for grandchildren21 35.8% Not responsible for grandchildrenWhite alone, not Hispanic / Latino 25 44.5% Responsible for grandchildren32 55.5% Not responsible for grandchildren