Races in Boise, Idaho (ID) Detailed Stats
Data:
Races - White alone (%)
Races - White alone (% change since 2000)
Races - Black alone (%)
Races - Black alone (% change since 2000)
Races - American Indian alone (%)
Races - American Indian alone (% change since 2000)
Races - Asian alone (%)
Races - Asian alone (% change since 2000)
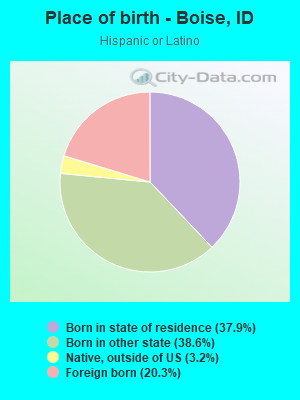
Races - Hispanic (%)
Races - Hispanic (% change since 2000)
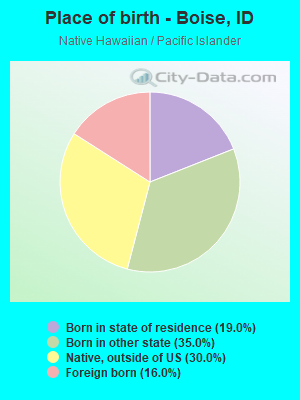
Races - Native Hawaiian and Other Pacific Islander alone (%)
Races - Native Hawaiian and Other Pacific Islander alone (% change since 2000)
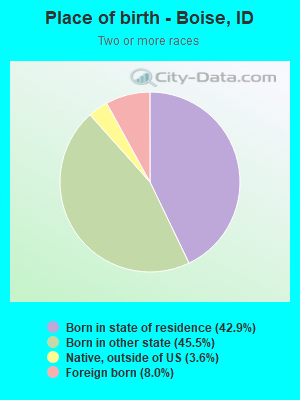
Races - Two or more races(%)
Races - Two or more races(% change since 2000)
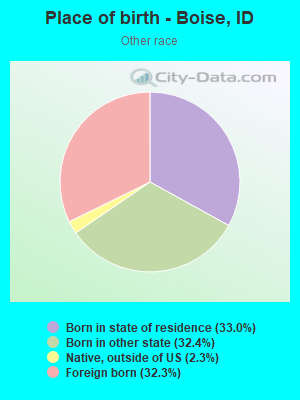
Races - Other race alone (%)
Races - Other race alone (% change since 2000)
Racial diversity
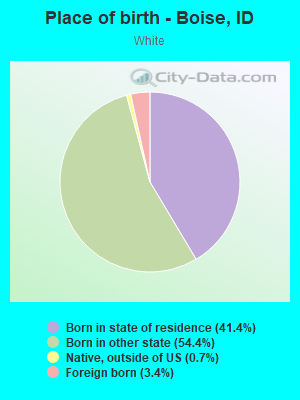
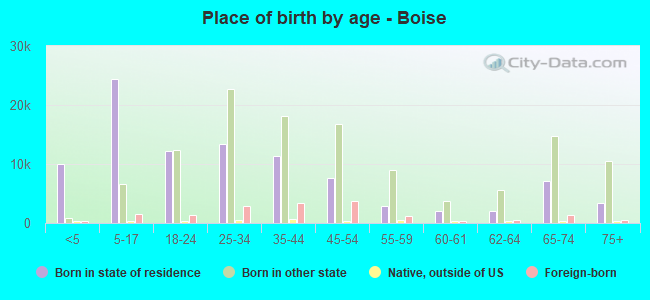
Place of birth - Born in state of residence (%)
Place of birth - Born in state of residence (%) - White
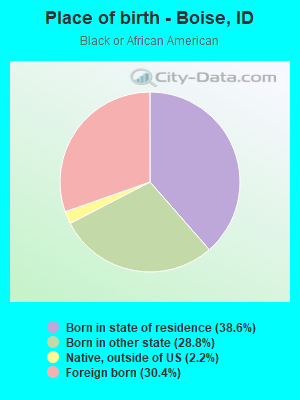
Place of birth - Born in state of residence (%) - Black or African American
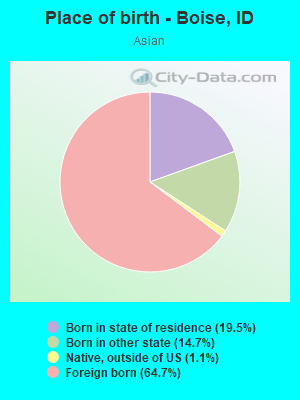
Place of birth - Born in state of residence (%) - Asian
Place of birth - Born in state of residence (%) - Hispanic or Latino
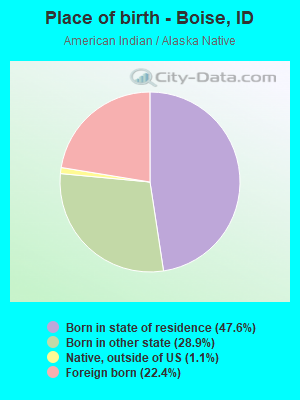
Place of birth - Born in state of residence (%) - American Indian and Alaska Native
Place of birth - Born in state of residence (%) - Multirace
Place of birth - Born in state of residence (%) - Other Race
Place of birth - Born in other state (%)
Place of birth - Born in other state (%) - White
Place of birth - Born in other state (%) - Black or African American
Place of birth - Born in other state (%) - Asian
Place of birth - Born in other state (%) - Hispanic or Latino
Place of birth - Born in other state (%) - American Indian and Alaska Native
Place of birth - Born in other state (%) - Multirace
Place of birth - Born in other state (%) - Other Race
Place of birth - Native, outside of US (%)
Place of birth - Native, outside of US (%) - White
Place of birth - Native, outside of US (%) - Black or African American
Place of birth - Native, outside of US (%) - Asian
Place of birth - Native, outside of US (%) - Hispanic or Latino
Place of birth - Native, outside of US (%) - American Indian and Alaska Native
Place of birth - Native, outside of US (%) - Multirace
Place of birth - Native, outside of US (%) - Other Race
Place of birth - Foreign born (%)
Place of birth - Foreign born (%) - White
Place of birth - Foreign born (%) - Black or African American
Place of birth - Foreign born (%) - Asian
Place of birth - Foreign born (%) - Hispanic or Latino
Place of birth - Foreign born (%) - American Indian and Alaska Native
Place of birth - Foreign born (%) - Multirace
Place of birth - Foreign born (%) - Other Race
Residents speaking English at home (%)
Residents speaking English at home - Born in the United States (%)
Residents speaking English at home - Native, born elsewhere (%)
Residents speaking English at home - Foreign born (%)
Residents speaking Spanish at home (%)
Residents speaking Spanish at home - Born in the United States (%)
Residents speaking Spanish at home - Native, born elsewhere (%)
Residents speaking Spanish at home - Foreign born (%)
Residents speaking other language at home (%)
Residents speaking other language at home - Born in the United States (%)
Residents speaking other language at home - Native, born elsewhere (%)
Residents speaking other language at home - Foreign born (%)
Marital status - Never married (%)
Marital status - Now married (%)
Marital status - Separated (%)
Marital status - Widowed (%)
Marital status - Divorced (%)
Ancestries Reported - Arab (%)
Ancestries Reported - Czech (%)
Ancestries Reported - Danish (%)
Ancestries Reported - Dutch (%)
Ancestries Reported - English (%)
Ancestries Reported - French (%)
Ancestries Reported - French Canadian (%)
Ancestries Reported - German (%)
Ancestries Reported - Greek (%)
Ancestries Reported - Hungarian (%)
Ancestries Reported - Irish (%)
Ancestries Reported - Italian (%)
Ancestries Reported - Lithuanian (%)
Ancestries Reported - Norwegian (%)
Ancestries Reported - Polish (%)
Ancestries Reported - Portuguese (%)
Ancestries Reported - Russian (%)
Ancestries Reported - Scotch-Irish (%)
Ancestries Reported - Scottish (%)
Ancestries Reported - Slovak (%)
Ancestries Reported - Subsaharan African (%)
Ancestries Reported - Swedish (%)
Ancestries Reported - Swiss (%)
Ancestries Reported - Ukrainian (%)
Ancestries Reported - United States (%)
Ancestries Reported - Welsh (%)
Ancestries Reported - West Indian (%)
Ancestries Reported - Other (%)
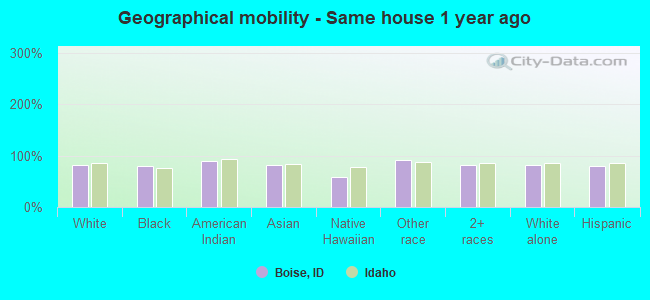
Geographical mobility - Same house 1 year ago (%)
Geographical mobility - Same house 1 year ago (%) - White
Geographical mobility - Same house 1 year ago (%) - Black or African American
Geographical mobility - Same house 1 year ago (%) - Asian
Geographical mobility - Same house 1 year ago (%) - Hispanic or Latino
Geographical mobility - Same house 1 year ago (%) - American Indian and Alaska Native
Geographical mobility - Same house 1 year ago (%) - Multirace
Geographical mobility - Same house 1 year ago (%) - Other Race
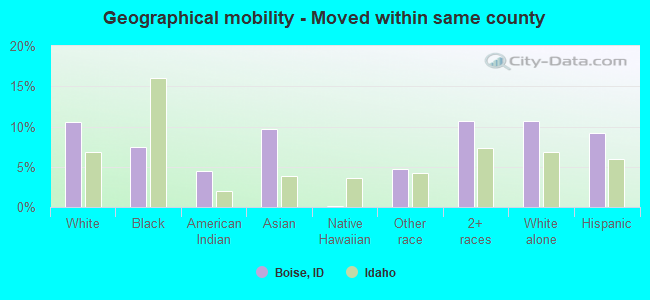
Geographical mobility - Moved within same county (%)
Geographical mobility - Moved within same county (%) - White
Geographical mobility - Moved within same county (%) - Black or African American
Geographical mobility - Moved within same county (%) - Asian
Geographical mobility - Moved within same county (%) - Hispanic or Latino
Geographical mobility - Moved within same county (%) - American Indian and Alaska Native
Geographical mobility - Moved within same county (%) - Multirace
Geographical mobility - Moved within same county (%) - Other Race
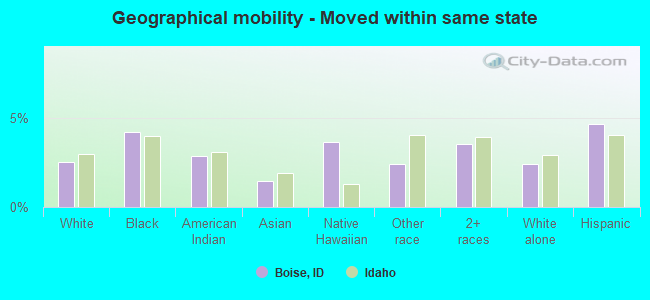
Geographical mobility - Moved from different county within same state (%)
Geographical mobility - Moved from different county within same state (%) - White
Geographical mobility - Moved from different county within same state (%) - Black or African American
Geographical mobility - Moved from different county within same state (%) - Asian
Geographical mobility - Moved from different county within same state (%) - Hispanic or Latino
Geographical mobility - Moved from different county within same state (%) - American Indian and Alaska Native
Geographical mobility - Moved from different county within same state (%) - Multirace
Geographical mobility - Moved from different county within same state (%) - Other Race
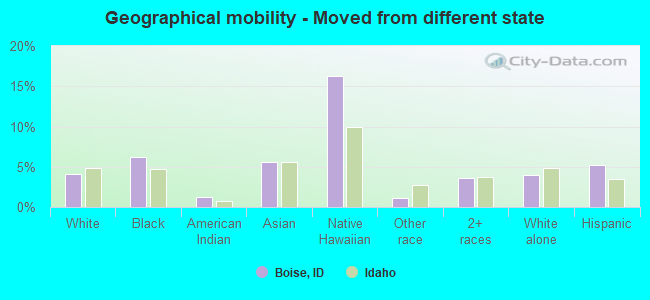
Geographical mobility - Moved from different state (%)
Geographical mobility - Moved from different state (%) - White
Geographical mobility - Moved from different state (%) - Black or African American
Geographical mobility - Moved from different state (%) - Asian
Geographical mobility - Moved from different state (%) - Hispanic or Latino
Geographical mobility - Moved from different state (%) - American Indian and Alaska Native
Geographical mobility - Moved from different state (%) - Multirace
Geographical mobility - Moved from different state (%) - Other Race
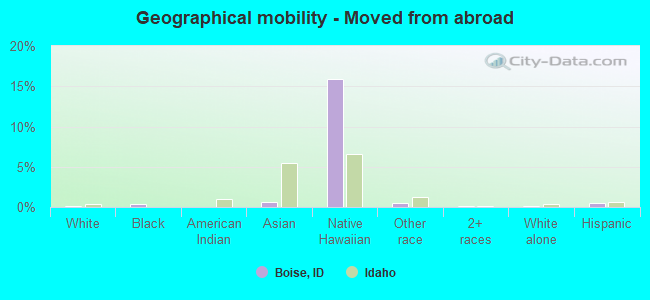
Geographical mobility - Moved from abroad (%)
Geographical mobility - Moved from abroad (%) - White
Geographical mobility - Moved from abroad (%) - Black or African American
Geographical mobility - Moved from abroad (%) - Asian
Geographical mobility - Moved from abroad (%) - Hispanic or Latino
Geographical mobility - Moved from abroad (%) - American Indian and Alaska Native
Geographical mobility - Moved from abroad (%) - Multirace
Geographical mobility - Moved from abroad (%) - Other Race
Place of birth for the foreign-born population - Ireland (%)
Place of birth for the foreign-born population - Denmark (%)
Place of birth for the foreign-born population - Norway (%)
Place of birth for the foreign-born population - Sweden (%)
Place of birth for the foreign-born population - United Kingdom (%)
Place of birth for the foreign-born population - England (%)
Place of birth for the foreign-born population - Scotland (%)
Place of birth for the foreign-born population - Other Northern Europe (%)
Place of birth for the foreign-born population - Austria (%)
Place of birth for the foreign-born population - Belgium (%)
Place of birth for the foreign-born population - France (%)
Place of birth for the foreign-born population - Germany (%)
Place of birth for the foreign-born population - Netherlands (%)
Place of birth for the foreign-born population - Switzerland (%)
Place of birth for the foreign-born population - Other Western Europe (%)
Place of birth for the foreign-born population - Greece (%)
Place of birth for the foreign-born population - Italy (%)
Place of birth for the foreign-born population - Portugal (%)
Place of birth for the foreign-born population - Spain (%)
Place of birth for the foreign-born population - Other Southern Europe (%)
Place of birth for the foreign-born population - Albania (%)
Place of birth for the foreign-born population - Belarus (%)
Place of birth for the foreign-born population - Bosnia and Herzegovina (%)
Place of birth for the foreign-born population - Bulgaria (%)
Place of birth for the foreign-born population - Croatia (%)
Place of birth for the foreign-born population - Czechoslovakia (%)
Place of birth for the foreign-born population - Hungary (%)
Place of birth for the foreign-born population - Latvia (%)
Place of birth for the foreign-born population - Lithuania (%)
Place of birth for the foreign-born population - North Macedonia (Macedonia) (%)
Place of birth for the foreign-born population - Moldova (%)
Place of birth for the foreign-born population - Poland (%)
Place of birth for the foreign-born population - Romania (%)
Place of birth for the foreign-born population - Russia (%)
Place of birth for the foreign-born population - Serbia (%)
Place of birth for the foreign-born population - Ukraine (%)
Place of birth for the foreign-born population - Other Eastern Europe (%)
Place of birth for the foreign-born population - China (%)
Place of birth for the foreign-born population - Hong Kong (%)
Place of birth for the foreign-born population - Taiwan (%)
Place of birth for the foreign-born population - Japan (%)
Place of birth for the foreign-born population - Korea (%)
Place of birth for the foreign-born population - Other Eastern Asia (%)
Place of birth for the foreign-born population - Afghanistan (%)
Place of birth for the foreign-born population - Bangladesh (%)
Place of birth for the foreign-born population - India (%)
Place of birth for the foreign-born population - Iran (%)
Place of birth for the foreign-born population - Kazakhstan (%)
Place of birth for the foreign-born population - Nepal (%)
Place of birth for the foreign-born population - Pakistan (%)
Place of birth for the foreign-born population - Sri Lanka (%)
Place of birth for the foreign-born population - Uzbekistan (%)
Place of birth for the foreign-born population - Other South Central Asia (%)
Place of birth for the foreign-born population - Burma (%)
Place of birth for the foreign-born population - Cambodia (%)
Place of birth for the foreign-born population - Indonesia (%)
Place of birth for the foreign-born population - Laos (%)
Place of birth for the foreign-born population - Malaysia (%)
Place of birth for the foreign-born population - Philippines (%)
Place of birth for the foreign-born population - Singapore (%)
Place of birth for the foreign-born population - Thailand (%)
Place of birth for the foreign-born population - Vietnam (%)
Place of birth for the foreign-born population - Other South Eastern Asia (%)
Place of birth for the foreign-born population - Armenia (%)
Place of birth for the foreign-born population - Iraq (%)
Place of birth for the foreign-born population - Israel (%)
Place of birth for the foreign-born population - Jordan (%)
Place of birth for the foreign-born population - Kuwait (%)
Place of birth for the foreign-born population - Lebanon (%)
Place of birth for the foreign-born population - Saudi Arabia (%)
Place of birth for the foreign-born population - Syria (%)
Place of birth for the foreign-born population - Turkey (%)
Place of birth for the foreign-born population - Yemen (%)
Place of birth for the foreign-born population - Other Western Asia (%)
Place of birth for the foreign-born population - Eritrea (%)
Place of birth for the foreign-born population - Ethiopia (%)
Place of birth for the foreign-born population - Kenya (%)
Place of birth for the foreign-born population - Somalia (%)
Place of birth for the foreign-born population - Uganda (%)
Place of birth for the foreign-born population - Zimbabwe (%)
Place of birth for the foreign-born population - Other Eastern Africa (%)
Place of birth for the foreign-born population - Cameroon (%)
Place of birth for the foreign-born population - Congo (%)
Place of birth for the foreign-born population - Democratic Republic of Congo (Zaire) (%)
Place of birth for the foreign-born population - Other Middle Africa (%)
Place of birth for the foreign-born population - Egypt (%)
Place of birth for the foreign-born population - Morocco (%)
Place of birth for the foreign-born population - Sudan (%)
Place of birth for the foreign-born population - Other Northern Africa (%)
Place of birth for the foreign-born population - South Africa (%)
Place of birth for the foreign-born population - Other Southern Africa (%)
Place of birth for the foreign-born population - Cabo Verde (%)
Place of birth for the foreign-born population - Ghana (%)
Place of birth for the foreign-born population - Liberia (%)
Place of birth for the foreign-born population - Nigeria (%)
Place of birth for the foreign-born population - Senegal (%)
Place of birth for the foreign-born population - Sierra Leone (%)
Place of birth for the foreign-born population - Other Western Africa (%)
Place of birth for the foreign-born population - Australia (%)
Place of birth for the foreign-born population - New Zealand (%)
Place of birth for the foreign-born population - Fiji (%)
Place of birth for the foreign-born population - Micronesia (%)
Place of birth for the foreign-born population - Bahamas (%)
Place of birth for the foreign-born population - Barbados (%)
Place of birth for the foreign-born population - Cuba (%)
Place of birth for the foreign-born population - Dominica (%)
Place of birth for the foreign-born population - Dominican Republic (%)
Place of birth for the foreign-born population - Grenada (%)
Place of birth for the foreign-born population - Haiti (%)
Place of birth for the foreign-born population - Jamaica (%)
Place of birth for the foreign-born population - St. Vincent and the Grenadines (%)
Place of birth for the foreign-born population - Trinidad and Tobago (%)
Place of birth for the foreign-born population - West Indies (%)
Place of birth for the foreign-born population - Other Caribbean (%)
Place of birth for the foreign-born population - Belize (%)
Place of birth for the foreign-born population - Costa Rica (%)
Place of birth for the foreign-born population - El Salvador (%)
Place of birth for the foreign-born population - Guatemala (%)
Place of birth for the foreign-born population - Honduras (%)
Place of birth for the foreign-born population - Mexico (%)
Place of birth for the foreign-born population - Nicaragua (%)
Place of birth for the foreign-born population - Panama (%)
Place of birth for the foreign-born population - Other Central America (%)
Place of birth for the foreign-born population - Argentina (%)
Place of birth for the foreign-born population - Bolivia (%)
Place of birth for the foreign-born population - Brazil (%)
Place of birth for the foreign-born population - Chile (%)
Place of birth for the foreign-born population - Colombia (%)
Place of birth for the foreign-born population - Ecuador (%)
Place of birth for the foreign-born population - Guyana (%)
Place of birth for the foreign-born population - Peru (%)
Place of birth for the foreign-born population - Uruguay (%)
Place of birth for the foreign-born population - Venezuela (%)
Place of birth for the foreign-born population - Other South America (%)
Place of birth for the foreign-born population - Canada (%)
Place of birth for the foreign-born population - Other Northern America (%)
Place of birth for the foreign-born population - Other (%)
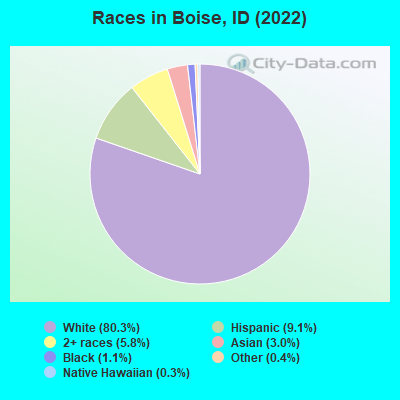
According to 2022 data, the most numerous races in Boise, ID are White alone (189,954 residents), Hispanic (21,632 residents), and Two or more races (13,643 residents). 90.7% of Boise residents speak English at home. 6.6% of Boise, ID residents are foreign-born (2.9% born in Asia, 1.6% born in Latin America, 1.1% born in Europe), which is 23.7% greater than the foreign-born rate of 5.0% across the entire state of Idaho.
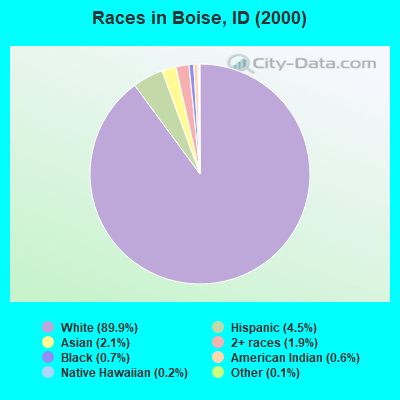
Race distribution in Boise
2000 2022
167,022 89.9% White alone 8,410 4.5% Hispanic 3,812 2.1% Asian alone 3,513 1.9% Two or more races 1,363 0.7% Black alone 1,147 0.6% American Indian alone 281 0.2% Native Hawaiian and Other 239 0.1% Other race alone
189,954 80.3% White alone 21,632 9.1% Hispanic 13,643 5.8% Two or more races 7,000 3.0% Asian alone 2,642 1.1% Black alone 946 0.4% Other race alone 617 0.3% Native Hawaiian and Other 198 0.08% American Indian alone
2000 2022
1,139,291 88.0% White alone 101,690 7.9% Hispanic 18,261 1.4% Two or more races 15,789 1.2% American Indian alone 11,641 0.9% Asian alone 4,889 0.4% Black alone 1,192 0.09% Other race alone 1,200 0.09% Native Hawaiian and Other
1,531,219 79.0% White alone 261,921 13.5% Hispanic 81,112 4.2% Two or more races 25,174 1.3% Asian alone 15,825 0.8% American Indian alone 11,868 0.6% Black alone 8,752 0.5% Other race alone 3,162 0.2% Native Hawaiian and Other
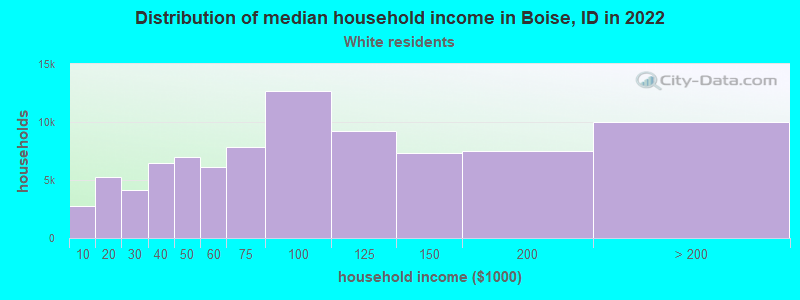
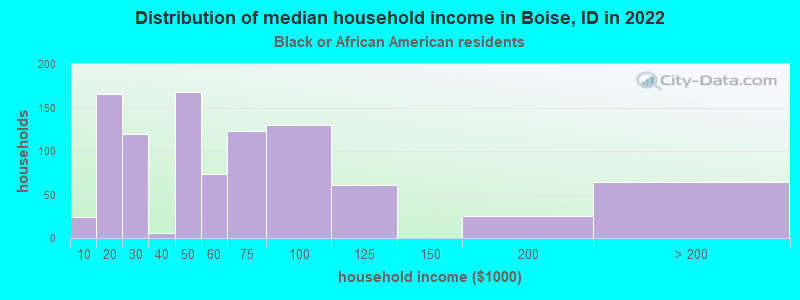
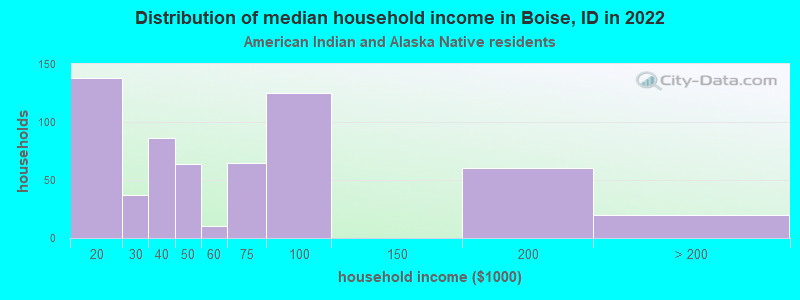
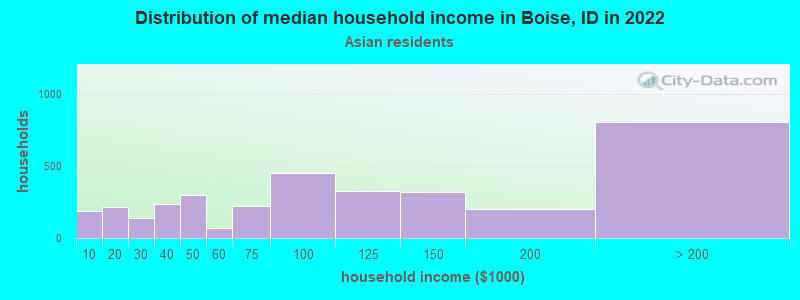
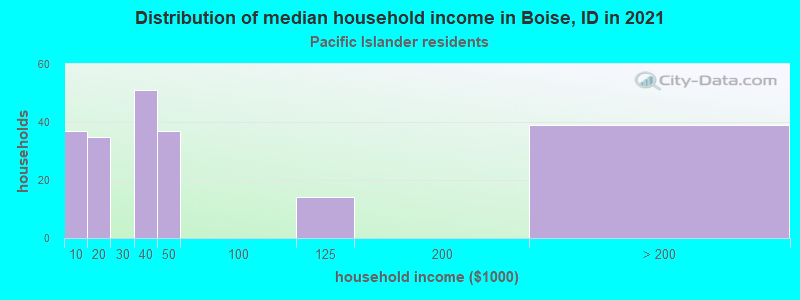
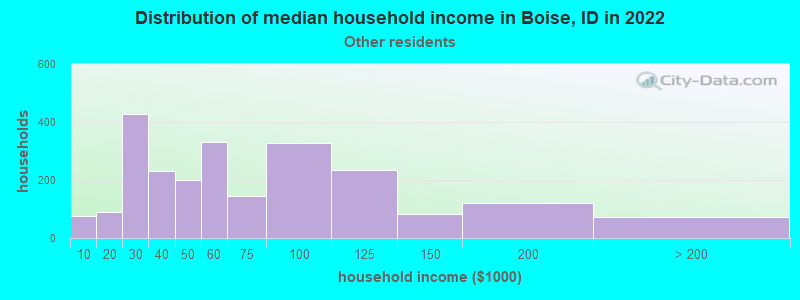
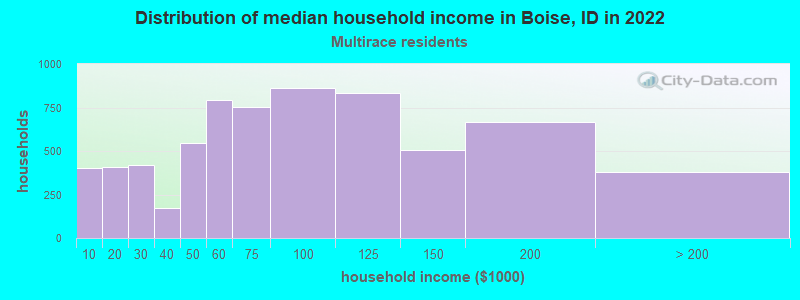
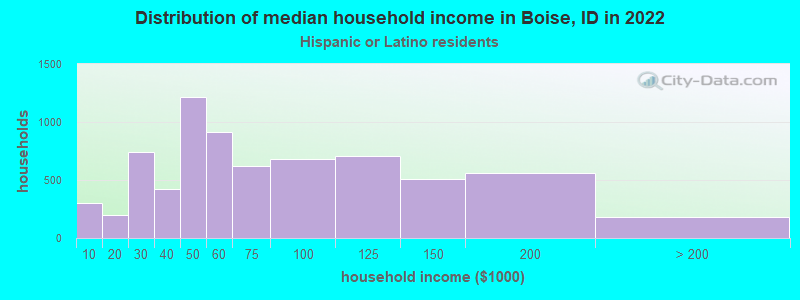
Income and house value in Boise Median household income in 2022 $82,852 White non-Hispanic householders$56,277 Black householders$36,745 American Indian and Alaska Native householders$120,137 Asian householders$54,139 Some other race householders$73,219 Two or more races householders$56,038 Hispanic or Latino race householdersMedian 2022 house value $511,675 White Non-Hispanic householders$515,900 Black or African American householders$415,340 American Indian or Alaska Native householders $490,127 Asian householders$399,284 Native Hawaiian and other Pacific Islander householders$467,733 Some other race householders$489,281 Two or more races householders$485,056 Hispanic or Latino householders
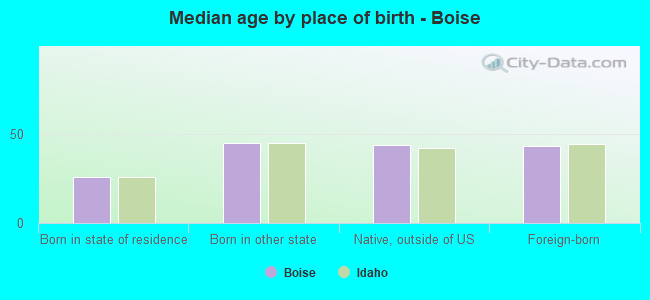
Median age by race in Boise
40.0 Median age for White residents38.9 40.7 25.3 Median age for Black or African American residents28.8 13.6 43.5 Median age for American Indian / Alaska Native residents48.3 21.9 35.7 Median age for Asian residents34.7 37.7 26.7 Median age for Native Hawaiian / Pacific Islander residents15.6 50.5 29.9 Median age for Other race residents27.7 31.3 30.1 Median age for Two or more races residents31.5 28.1 40.3 Median age for White alone residents39.4 41.0 30.6 Median age for Hispanic or Latino residents31.0 30.4
Owner/renter occupied households by race in Boise
House owners and renters - White residents 58,133 67.4% Owner occupied28,116 32.6% Renter occupiedHouse owners and renters - Black or African American residents 205 25.9% Owner occupied585 74.1% Renter occupiedHouse owners and renters - American Indian / Alaska Native residents 188 38.4% Owner occupied301 61.6% Renter occupiedHouse owners and renters - Asian residents 1,700 65.9% Owner occupied879 34.1% Renter occupiedHouse owners and renters - Native Hawaiian / Pacific Islander residents 38 24.4% Owner occupied118 75.6% Renter occupiedHouse owners and renters - Other race residents 1,218 59.3% Owner occupied836 40.7% Renter occupiedHouse owners and renters - Two or more races residents 3,723 55.2% Owner occupied3,022 44.8% Renter occupiedHouse owners and renters - White alone residents 56,994 67.7% Owner occupied27,249 32.3% Renter occupiedHouse owners and renters - Hispanic or Latino residents 4,024 57.0% Owner occupied3,039 43.0% Renter occupied
Language usage in Boise
English speakers - Total 90.7% of residents of Boise speak English at home.
4.4% of residents speak Spanish at home 7,081 71.9% Speak English very well2,768 28.1% Speak English less than very well5.0% of residents speak other language at home 6,806 60.8% Speak English very well4,384 39.2% Speak English less than very well
English speakers - Born in the United States 97.2% of residents of Boise speak English at home.
2.0% of residents speak Spanish at home 2,259 92.0% Speak English very well196 8.0% Speak English less than very well0.8% of residents speak other language at home 890 93.6% Speak English very well61 6.4% Speak English less than very well
English speakers - Native, born elsewhere 78.4% of residents of Boise speak English at home.
14.2% of residents speak Spanish at home 377 100.0% Speak English very well7.4% of residents speak other language at home 135 68.9% Speak English very well61 31.1% Speak English less than very well
English speakers - Foreign-born 19.3% of residents of Boise speak English at home.
25.3% of residents speak Spanish at home 1,932 45.8% Speak English very well2,282 54.2% Speak English less than very well55.4% of residents speak other language at home 5,234 56.7% Speak English very well4,001 43.3% Speak English less than very well
White (Caucasian) - Speak only English Native:
98.2% (176,844)Foreign-born:
26.7% (1,789)
White (Caucasian) - Speak another language Native:
1.8% (3,293)Foreign-born:
73.3% (4,923)
Black or African American - Speak only English Native:
95.7% (1,366)Foreign-born:
26.2% (204)
Black or African American - Speak another language Native:
4.3% (61)Foreign-born:
73.8% (574)
American Indian / Alaska Native - Speak only English Native:
79.9% (924)Foreign-born:
4.9% (16)
American Indian / Alaska Native - Speak another language Native:
20.5% (238)Foreign-born:
94.8% (317)
Asian - Speak only English Native:
83.8% (1,945)Foreign-born:
24.2% (1,116)
Asian - Speak another language Native:
16.2% (377)Foreign-born:
75.8% (3,494)
Native Hawaiian / Pacific Islander - Speak another language Native:
21.5% (126)Foreign-born:
100.0% (65)
Other race - Speak only English Native:
63.3% (2,794)Foreign-born:
1.3% (29)
Other race - Speak another language Native:
36.7% (1,622)Foreign-born:
98.7% (2,238)
Two or more races - Speak only English Native:
89.6% (17,478)Foreign-born:
4.4% (82)
Two or more races - Speak another language Native:
10.4% (2,037)Foreign-born:
95.6% (1,780)
White alone - Speak only English Native:
98.6% (173,528)Foreign-born:
26.5% (1,737)
White alone - Speak another language Native:
1.4% (2,454)Foreign-born:
73.5% (4,812)
Hispanic or Latino - Speak only English Native:
72.4% (11,360)Foreign-born:
1.8% (81)
Hispanic or Latino - Speak another language Native:
27.6% (4,325)Foreign-born:
98.2% (4,307)
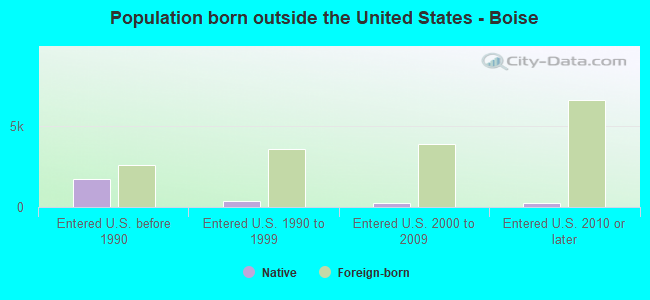
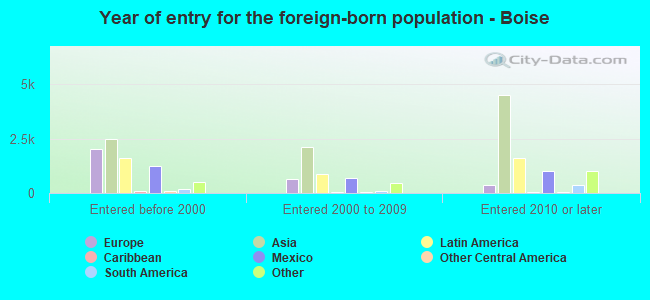
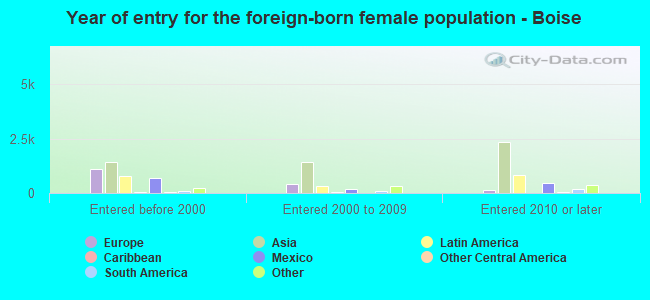
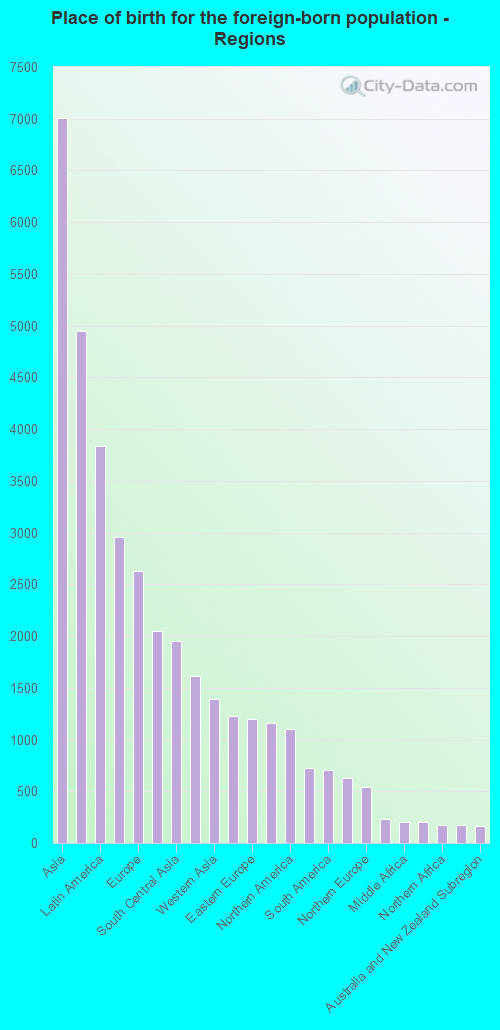
Foreign-born residents in Boise 16,009 residents are foreign born (2.9% Asia , 1.6% Latin America , 1.1% Europe ).
Marital status for residents in Boise Marital status - White (Caucasian) population 15 years and over
Males 37.2% Never married47.1% Now married1.0% Separated1.6% Widowed13.2% DivorcedFemales 31.4% Never married46.1% Now married0.9% Separated6.1% Widowed15.4% DivorcedWomen who gave birth in the past 12 months Now married:
70.8% (1,534)Unmarried:
29.2% (632)
Women who did not give birth in the past 12 months Now married:
40.7% (18,314)Unmarried:
59.3% (26,699)
Marital status - Black or African American population 15 years and over
Males 46.8% Never married47.2% Now married0.2% Separated0.0% Widowed5.8% DivorcedFemales 55.3% Never married33.6% Now married0.7% Separated0.0% Widowed10.4% DivorcedWomen who gave birth in the past 12 months Now married:
0.0% (0)Unmarried:
100.0% (28)
Women who did not give birth in the past 12 months Now married:
27.4% (179)Unmarried:
72.6% (472)
Marital status - American Indian / Alaska Native population 15 years and over
Males 16.1% Never married54.5% Now married5.1% Separated0.9% Widowed23.4% DivorcedFemales 40.8% Never married33.1% Now married0.0% Separated6.4% Widowed19.7% DivorcedWomen who gave birth in the past 12 months Now married:
100.0% (13)Unmarried:
0.0% (0)
Women who did not give birth in the past 12 months Now married:
21.7% (88)Unmarried:
78.3% (317)
Marital status - Asian population 15 years and over
Males 42.6% Never married51.2% Now married0.0% Separated0.6% Widowed5.5% DivorcedFemales 25.0% Never married53.8% Now married0.7% Separated5.6% Widowed14.9% DivorcedWomen who gave birth in the past 12 months Now married:
100.0% (237)Unmarried:
0.0% (0)
Women who did not give birth in the past 12 months Now married:
48.1% (1,073)Unmarried:
51.9% (1,159)
Marital status - Native Hawaiian / Pacific Islander population 15 years and over
Males 77.2% Never married22.8% Now married0.0% Separated0.0% Widowed0.0% DivorcedFemales 68.0% Never married32.0% Now married0.0% Separated0.0% Widowed0.0% DivorcedWomen who gave birth in the past 12 months Now married:
100.0% (35)Unmarried:
0.0% (0)
Women who did not give birth in the past 12 months Now married:
31.7% (75)Unmarried:
68.3% (161)
Marital status - Other race population 15 years and over
Males 50.7% Never married37.6% Now married0.0% Separated0.0% Widowed11.6% DivorcedFemales 37.7% Never married46.0% Now married0.0% Separated4.0% Widowed12.3% DivorcedWomen who gave birth in the past 12 months Now married:
100.0% (34)Unmarried:
0.0% (0)
Women who did not give birth in the past 12 months Now married:
39.5% (708)Unmarried:
60.5% (1,086)
Marital status - Two or more races population 15 years and over
Males 47.7% Never married36.6% Now married0.0% Separated4.0% Widowed11.7% DivorcedFemales 39.1% Never married41.1% Now married4.7% Separated5.1% Widowed10.0% DivorcedWomen who gave birth in the past 12 months Now married:
62.3% (152)Unmarried:
37.7% (92)
Women who did not give birth in the past 12 months Now married:
45.1% (2,771)Unmarried:
54.9% (3,369)
Marital status - White alone, not Hispanic / Latino population 15 years and over
Males 36.8% Never married47.4% Now married1.0% Separated1.6% Widowed13.2% DivorcedFemales 31.0% Never married46.7% Now married0.9% Separated6.0% Widowed15.4% DivorcedWomen who gave birth in the past 12 months Now married:
70.8% (1,534)Unmarried:
29.2% (632)
Women who did not give birth in the past 12 months Now married:
41.6% (18,115)Unmarried:
58.4% (25,391)
Marital status - Hispanic or Latino population 15 years and over
Males 45.7% Never married36.9% Now married0.0% Separated0.1% Widowed17.3% DivorcedFemales 42.4% Never married38.8% Now married3.7% Separated5.9% Widowed9.2% DivorcedWomen who gave birth in the past 12 months Now married:
61.0% (144)Unmarried:
39.0% (92)
Women who did not give birth in the past 12 months Now married:
41.1% (2,585)Unmarried:
58.9% (3,702)
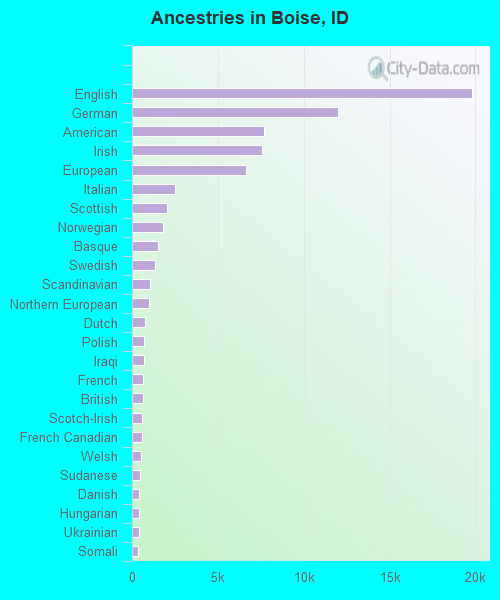
Ancestries in Boise
19,802 19.4% English12,012 11.8% German7,710 7.6% American7,565 7.4% Irish6,653 6.5% European2,527 2.5% Italian2,062 2.0% Scottish1,816 1.8% Norwegian1,488 1.5% Basque1,318 1.3% Swedish1,065 1.0% Scandinavian995 1.0% Northern European747 0.7% Dutch722 0.7% Polish711 0.7% Iraqi668 0.7% French644 0.6% British605 0.6% Scotch-Irish572 0.6% French Canadian523 0.5% Welsh486 0.5% Sudanese420 0.4% Danish417 0.4% Hungarian384 0.4% Ukrainian340 0.3% Somali301 0.3% Czech297 0.3% Eastern European264 0.3% Greek254 0.2% Arab237 0.2% Swiss224 0.2% Portuguese220 0.2% African212 0.2% Romanian210 0.2% Canadian167 0.2% Russian162 0.2% Yugoslavian161 0.2% Ethiopian160 0.2% Brazilian152 0.1% Lithuanian149 0.1% Nigerian146 0.1% Afghan143 0.1% Iranian121 0.1% Slovak112 0.1% Syrian107 0.1% Croatian106 0.1% Serbian97 0.10% Armenian90 0.09% Lebanese90 0.09% Haitian87 0.09% Bulgarian84 0.08% Slavic67 0.07% Jamaican61 0.06% Austrian60 0.06% Icelander59 0.06% Finnish52 0.05% Australian50 0.05% Czechoslovakian49 0.05% Belgian46 0.05% Pennsylvania German46 0.05% Jordanian40 0.04% South African34 0.03% Cajun29 0.03% Celtic26 0.03% Turkish20 0.02% Luxembourger14 0.01% Slovene13 0.01% Albanian11 0.01% Cape Verdean10 0.01% German Russian7 0.01% Moroccan6 0.01% Latvian
Geographical mobility in Boise Same house 1 year ago 159,551 82.6% White (Caucasian)2,671 80.0% Black or African American1,612 90.1% American Indian / Alaska Native5,890 82.7% Asian407 58.1% Native Hawaiian / Pacific Islander5,704 91.2% Other race18,785 82.0% Two or more races156,044 82.8% White alone, not Hispanic / Latino17,273 80.5% Hispanic or LatinoMoved within same county 20,488 10.6% White / Caucasian247 7.4% Black or African American80 4.5% American Indian / Alaska Native690 9.7% Asian1 0.1% Native Hawaiian / Pacific Islander296 4.7% Other race2,445 10.7% Two or more races20,112 10.7% White alone, not Hispanic / Latino1,971 9.2% Hispanic or LatinoMoved within same state 4,887 2.5% White / Caucasian141 4.2% Black or African American51 2.8% American Indian / Alaska Native103 1.4% Asian26 3.7% Native Hawaiian / Pacific Islander150 2.4% Other race804 3.5% Two or more races4,581 2.4% White alone, not Hispanic / Latino1,001 4.7% Hispanic or LatinoMoved from different state 7,999 4.1% White / Caucasian208 6.2% Black or African American23 1.3% American Indian / Alaska Native394 5.5% Asian114 16.3% Native Hawaiian / Pacific Islander71 1.1% Other race828 3.6% Two or more races7,565 4.0% White alone, not Hispanic / Latino1,110 5.2% Hispanic or LatinoMoved from abroad 179 0.1% White14 0.4% Black or African American47 0.7% Asian111 15.9% Native Hawaiian / Pacific Islander28 0.4% Other race41 0.2% Two or more races179 0.1% White alone, not Hispanic / Latino110 0.5% Hispanic or Latino
Children Nativity (place of birth) in Boise
Children under 6 years - Living with two parents Both parents native 7,638 100.0% NativeBoth parents foreign-born 657 100.0% NativeOne native, one foreign-born parent 1,167 100.0% NativeChildren under 6 years - Living with one parent Native parent 2,488 97.9% Native53 2.1% Foreign-bornForeign-born parent 674 100.0% NativeChildren 6 to 17 years - Living with two parents Both parents native 16,777 99.6% Native60 0.4% Foreign-bornBoth parents foreign-born 941 65.6% Native493 34.4% Foreign-bornOne native, one foreign-born parent 1,578 81.3% Native363 18.7% Foreign-bornChildren 6 to 17 years - Living with one parent Native parent 7,071 100.0% NativeForeign-born parent 1,456 61.1% Native927 38.9% Foreign-born
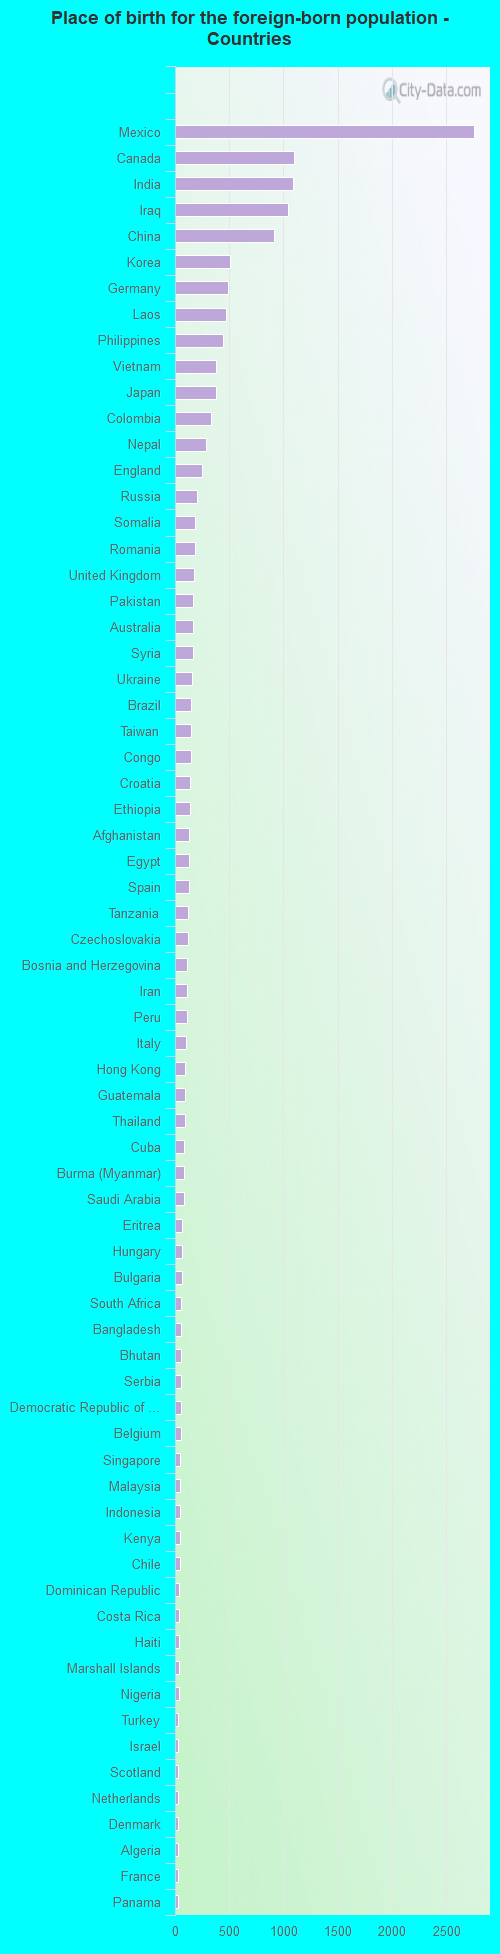
Place of birth for residents in Boise 7,010 Asia4,947 Americas3,840 Latin America2,953 Central America2,626 Europe2,047 Eastern Asia1,953 South Central Asia1,614 South Eastern Asia1,395 Western Asia1,224 Africa1,202 Eastern Europe1,162 China1,106 Northern America728 Eastern Africa709 South America626 Western Europe539 Northern Europe230 Southern Europe201 Middle Africa199 Oceania178 Northern Africa177 Caribbean163 Australia and New Zealand Subregion58 Southern Africa58 Western Africa2,758 Mexico1,097 Canada1,087 India1,046 Iraq917 China507 Korea493 Germany468 Laos439 Philippines378 Vietnam377 Japan333 Colombia284 Nepal252 England199 Russia188 Somalia186 Romania178 United Kingdom166 Pakistan163 Australia163 Syria160 Ukraine151 Brazil147 Taiwan147 Congo138 Croatia137 Ethiopia132 Afghanistan130 Egypt128 Spain124 Tanzania118 Czechoslovakia114 Bosnia and Herzegovina113 Iran112 Peru101 Italy96 Hong Kong95 Guatemala93 Thailand86 Cuba84 Burma (Myanmar)80 Saudi Arabia66 Eritrea66 Hungary65 Bulgaria58 South Africa56 Bangladesh56 Bhutan54 Serbia54 Democratic Republic of Congo (Zaire)53 Belgium49 Singapore49 Malaysia49 Indonesia47 Kenya43 Chile41 Dominican Republic41 Costa Rica39 Haiti36 Marshall Islands35 Nigeria32 Turkey32 Israel31 Scotland30 Netherlands30 Denmark29 Algeria28 France26 Panama25 Venezuela22 Uzbekistan22 Ireland21 El Salvador20 Switzerland20 Poland18 Ecuador16 Lithuania16 Kuwait13 Albania13 Zimbabwe13 Moldova13 Jordan12 Cabo Verde11 Norway11 Sudan10 Lebanon10 Ghana9 Jamaica9 Honduras7 Morocco5 Argentina2 Belarus
Grandparents responsible for own grandchildren in Boise
Grandparents (30 to 59 years) White / Caucasian 316 54.1% Responsible for grandchildren268 45.9% Not responsible for grandchildrenBlack or African American 40 100.0% Not responsible for grandchildrenAmerican Indian / Alaska Native 25 50.9% Responsible for grandchildren24 49.1% Not responsible for grandchildrenAsian 24 71.1% Responsible for grandchildren10 28.9% Not responsible for grandchildrenNative Hawaiian / Pacific Islander 71 100.0% Not responsible for grandchildrenOther race 23 48.7% Responsible for grandchildren24 51.3% Not responsible for grandchildrenTwo or more races 80 92.2% Responsible for grandchildren7 7.8% Not responsible for grandchildrenWhite alone, not Hispanic / Latino 316 54.1% Responsible for grandchildren268 45.9% Not responsible for grandchildrenHispanic or Latino 44 52.4% Responsible for grandchildren40 47.6% Not responsible for grandchildrenGrandparents (60 years and over) White / Caucasian 482 41.5% Responsible for grandchildren680 58.5% Not responsible for grandchildrenBlack or African American 11 100.0% Responsible for grandchildrenAsian 27 20.1% Responsible for grandchildren106 79.9% Not responsible for grandchildrenTwo or more races 10 12.0% Responsible for grandchildren70 88.0% Not responsible for grandchildrenWhite alone, not Hispanic / Latino 416 38.0% Responsible for grandchildren680 62.0% Not responsible for grandchildrenHispanic or Latino 25 23.6% Responsible for grandchildren82 76.4% Not responsible for grandchildren
Zip codes: 83616 , 83634 , 83642 , 83646 , 83702 , 83703 , 83704 , 83705 , 83706 , 83709 , 83712 , 83713 , 83714 , 83716 .