Races in Boca Pointe, Florida (FL) Detailed Stats
Ancestries, Foreign-born residents, place of birth

Recent posts about races in Boca Pointe, Florida on our local forum with over 2,400,000 registered users:
 | Advice on Wellington vs West Boca (4 replies) |
| 1 bedroom apts - dog friendly $1100? Boca/Delray (8 replies) |
| Boca raton communities suggestions. (20 replies) |
| Boca Pointe reviews Good/Bad (47 replies) |
| We have decided on Boca! Help! (24 replies) |
| a favor request of house info: west boca 33498 (zip) area (8 replies) |
11.4% of Boca Pointe, FL residents are foreign-born (5.6% born in Europe, 3.6% born in Latin America, 1.6% born in North America), which is 83.4% less than the foreign-born rate of 21.0% across the entire state of Florida.
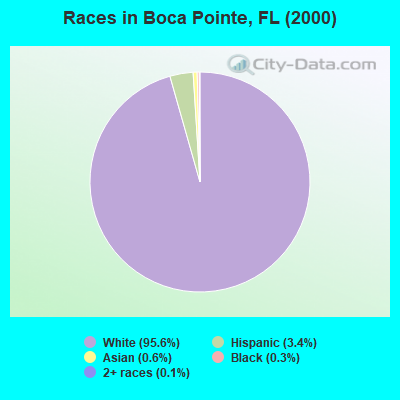
Race distribution in Boca Pointe

- 3,15695.6%White alone
- 1113.4%Hispanic
- 200.6%Asian alone
- 110.3%Black alone
- 40.1%Two or more races
2000
2022
-
- 10,458,50965.4%White alone
- 2,682,71516.8%Hispanic
- 2,264,26814.2%Black alone
- 261,6931.6%Asian alone
- 236,9541.5%Two or more races
- 42,3580.3%American Indian alone
- 28,9940.2%Other race alone
- 6,8870.04%Native Hawaiian and Other
Pacific Islander alone

-
- 11,309,40350.8%White alone
- 6,025,03927.1%Hispanic
- 3,241,01514.6%Black alone
- 861,6303.9%Two or more races
- 623,6922.8%Asian alone
- 152,0540.7%Other race alone
- 22,5040.1%American Indian alone
- 9,4860.04%Native Hawaiian and Other
Pacific Islander alone

Income and house value in Boca Pointe
- Median household income in 2022
- $154,794White non-Hispanic householders
- over $200,000Hispanic or Latino race householders
- Median 2022 house value
- over $1,000,000White Non-Hispanic householders
- over $1,000,000Hispanic or Latino householders
Household income for White non-Hispanic householders

Household income for Hispanic or Latino race householders

Foreign-born residents in Boca Pointe
378 residents are foreign born (5.6% Europe, 3.6% Latin America, 1.6% North America).
| This city: | 11.4% |
| Florida: | 16.7% |
Ancestries in Boca Pointe

- 96030.5%Other
- 58418.6%Russian
- 40012.7%United States
- 35911.4%Polish
- 2217.0%German
- 1494.7%Hungarian
- 1063.4%Italian
- 762.4%French
- 622.0%English
- 441.4%Dutch
- 411.3%Swedish
- 301.0%Arab
- 270.9%Irish
- 250.8%Ukrainian
- 170.5%Scottish
- 110.3%Swiss
- 90.3%West Indian
- 80.3%Danish
- 80.3%French Canadian
- 70.2%Lithuanian

Zip codes: 33433.