Races in Bluffton, South Carolina (SC) Detailed Stats
Data:
Races - White alone (%)
Races - White alone (% change since 2000)
Races - Black alone (%)
Races - Black alone (% change since 2000)
Races - American Indian alone (%)
Races - American Indian alone (% change since 2000)
Races - Asian alone (%)
Races - Asian alone (% change since 2000)
Races - Hispanic (%)
Races - Hispanic (% change since 2000)
Races - Native Hawaiian and Other Pacific Islander alone (%)
Races - Native Hawaiian and Other Pacific Islander alone (% change since 2000)
Races - Two or more races(%)
Races - Two or more races(% change since 2000)
Races - Other race alone (%)
Races - Other race alone (% change since 2000)
Racial diversity
Place of birth - Born in state of residence (%)
Place of birth - Born in state of residence (%) - White
Place of birth - Born in state of residence (%) - Black or African American
Place of birth - Born in state of residence (%) - Asian
Place of birth - Born in state of residence (%) - Hispanic or Latino
Place of birth - Born in state of residence (%) - American Indian and Alaska Native
Place of birth - Born in state of residence (%) - Multirace
Place of birth - Born in state of residence (%) - Other Race
Place of birth - Born in other state (%)
Place of birth - Born in other state (%) - White
Place of birth - Born in other state (%) - Black or African American
Place of birth - Born in other state (%) - Asian
Place of birth - Born in other state (%) - Hispanic or Latino
Place of birth - Born in other state (%) - American Indian and Alaska Native
Place of birth - Born in other state (%) - Multirace
Place of birth - Born in other state (%) - Other Race
Place of birth - Native, outside of US (%)
Place of birth - Native, outside of US (%) - White
Place of birth - Native, outside of US (%) - Black or African American
Place of birth - Native, outside of US (%) - Asian
Place of birth - Native, outside of US (%) - Hispanic or Latino
Place of birth - Native, outside of US (%) - American Indian and Alaska Native
Place of birth - Native, outside of US (%) - Multirace
Place of birth - Native, outside of US (%) - Other Race
Place of birth - Foreign born (%)
Place of birth - Foreign born (%) - White
Place of birth - Foreign born (%) - Black or African American
Place of birth - Foreign born (%) - Asian
Place of birth - Foreign born (%) - Hispanic or Latino
Place of birth - Foreign born (%) - American Indian and Alaska Native
Place of birth - Foreign born (%) - Multirace
Place of birth - Foreign born (%) - Other Race
Residents speaking English at home (%)
Residents speaking English at home - Born in the United States (%)
Residents speaking English at home - Native, born elsewhere (%)
Residents speaking English at home - Foreign born (%)
Residents speaking Spanish at home (%)
Residents speaking Spanish at home - Born in the United States (%)
Residents speaking Spanish at home - Native, born elsewhere (%)
Residents speaking Spanish at home - Foreign born (%)
Residents speaking other language at home (%)
Residents speaking other language at home - Born in the United States (%)
Residents speaking other language at home - Native, born elsewhere (%)
Residents speaking other language at home - Foreign born (%)
Marital status - Never married (%)
Marital status - Now married (%)
Marital status - Separated (%)
Marital status - Widowed (%)
Marital status - Divorced (%)
Ancestries Reported - Arab (%)
Ancestries Reported - Czech (%)
Ancestries Reported - Danish (%)
Ancestries Reported - Dutch (%)
Ancestries Reported - English (%)
Ancestries Reported - French (%)
Ancestries Reported - French Canadian (%)
Ancestries Reported - German (%)
Ancestries Reported - Greek (%)
Ancestries Reported - Hungarian (%)
Ancestries Reported - Irish (%)
Ancestries Reported - Italian (%)
Ancestries Reported - Lithuanian (%)
Ancestries Reported - Norwegian (%)
Ancestries Reported - Polish (%)
Ancestries Reported - Portuguese (%)
Ancestries Reported - Russian (%)
Ancestries Reported - Scotch-Irish (%)
Ancestries Reported - Scottish (%)
Ancestries Reported - Slovak (%)
Ancestries Reported - Subsaharan African (%)
Ancestries Reported - Swedish (%)
Ancestries Reported - Swiss (%)
Ancestries Reported - Ukrainian (%)
Ancestries Reported - United States (%)
Ancestries Reported - Welsh (%)
Ancestries Reported - West Indian (%)
Ancestries Reported - Other (%)
Geographical mobility - Same house 1 year ago (%)
Geographical mobility - Same house 1 year ago (%) - White
Geographical mobility - Same house 1 year ago (%) - Black or African American
Geographical mobility - Same house 1 year ago (%) - Asian
Geographical mobility - Same house 1 year ago (%) - Hispanic or Latino
Geographical mobility - Same house 1 year ago (%) - American Indian and Alaska Native
Geographical mobility - Same house 1 year ago (%) - Multirace
Geographical mobility - Same house 1 year ago (%) - Other Race
Geographical mobility - Moved within same county (%)
Geographical mobility - Moved within same county (%) - White
Geographical mobility - Moved within same county (%) - Black or African American
Geographical mobility - Moved within same county (%) - Asian
Geographical mobility - Moved within same county (%) - Hispanic or Latino
Geographical mobility - Moved within same county (%) - American Indian and Alaska Native
Geographical mobility - Moved within same county (%) - Multirace
Geographical mobility - Moved within same county (%) - Other Race
Geographical mobility - Moved from different county within same state (%)
Geographical mobility - Moved from different county within same state (%) - White
Geographical mobility - Moved from different county within same state (%) - Black or African American
Geographical mobility - Moved from different county within same state (%) - Asian
Geographical mobility - Moved from different county within same state (%) - Hispanic or Latino
Geographical mobility - Moved from different county within same state (%) - American Indian and Alaska Native
Geographical mobility - Moved from different county within same state (%) - Multirace
Geographical mobility - Moved from different county within same state (%) - Other Race
Geographical mobility - Moved from different state (%)
Geographical mobility - Moved from different state (%) - White
Geographical mobility - Moved from different state (%) - Black or African American
Geographical mobility - Moved from different state (%) - Asian
Geographical mobility - Moved from different state (%) - Hispanic or Latino
Geographical mobility - Moved from different state (%) - American Indian and Alaska Native
Geographical mobility - Moved from different state (%) - Multirace
Geographical mobility - Moved from different state (%) - Other Race
Geographical mobility - Moved from abroad (%)
Geographical mobility - Moved from abroad (%) - White
Geographical mobility - Moved from abroad (%) - Black or African American
Geographical mobility - Moved from abroad (%) - Asian
Geographical mobility - Moved from abroad (%) - Hispanic or Latino
Geographical mobility - Moved from abroad (%) - American Indian and Alaska Native
Geographical mobility - Moved from abroad (%) - Multirace
Geographical mobility - Moved from abroad (%) - Other Race
Place of birth for the foreign-born population - Ireland (%)
Place of birth for the foreign-born population - Denmark (%)
Place of birth for the foreign-born population - Norway (%)
Place of birth for the foreign-born population - Sweden (%)
Place of birth for the foreign-born population - United Kingdom (%)
Place of birth for the foreign-born population - England (%)
Place of birth for the foreign-born population - Scotland (%)
Place of birth for the foreign-born population - Other Northern Europe (%)
Place of birth for the foreign-born population - Austria (%)
Place of birth for the foreign-born population - Belgium (%)
Place of birth for the foreign-born population - France (%)
Place of birth for the foreign-born population - Germany (%)
Place of birth for the foreign-born population - Netherlands (%)
Place of birth for the foreign-born population - Switzerland (%)
Place of birth for the foreign-born population - Other Western Europe (%)
Place of birth for the foreign-born population - Greece (%)
Place of birth for the foreign-born population - Italy (%)
Place of birth for the foreign-born population - Portugal (%)
Place of birth for the foreign-born population - Spain (%)
Place of birth for the foreign-born population - Other Southern Europe (%)
Place of birth for the foreign-born population - Albania (%)
Place of birth for the foreign-born population - Belarus (%)
Place of birth for the foreign-born population - Bosnia and Herzegovina (%)
Place of birth for the foreign-born population - Bulgaria (%)
Place of birth for the foreign-born population - Croatia (%)
Place of birth for the foreign-born population - Czechoslovakia (%)
Place of birth for the foreign-born population - Hungary (%)
Place of birth for the foreign-born population - Latvia (%)
Place of birth for the foreign-born population - Lithuania (%)
Place of birth for the foreign-born population - North Macedonia (Macedonia) (%)
Place of birth for the foreign-born population - Moldova (%)
Place of birth for the foreign-born population - Poland (%)
Place of birth for the foreign-born population - Romania (%)
Place of birth for the foreign-born population - Russia (%)
Place of birth for the foreign-born population - Serbia (%)
Place of birth for the foreign-born population - Ukraine (%)
Place of birth for the foreign-born population - Other Eastern Europe (%)
Place of birth for the foreign-born population - China (%)
Place of birth for the foreign-born population - Hong Kong (%)
Place of birth for the foreign-born population - Taiwan (%)
Place of birth for the foreign-born population - Japan (%)
Place of birth for the foreign-born population - Korea (%)
Place of birth for the foreign-born population - Other Eastern Asia (%)
Place of birth for the foreign-born population - Afghanistan (%)
Place of birth for the foreign-born population - Bangladesh (%)
Place of birth for the foreign-born population - India (%)
Place of birth for the foreign-born population - Iran (%)
Place of birth for the foreign-born population - Kazakhstan (%)
Place of birth for the foreign-born population - Nepal (%)
Place of birth for the foreign-born population - Pakistan (%)
Place of birth for the foreign-born population - Sri Lanka (%)
Place of birth for the foreign-born population - Uzbekistan (%)
Place of birth for the foreign-born population - Other South Central Asia (%)
Place of birth for the foreign-born population - Burma (%)
Place of birth for the foreign-born population - Cambodia (%)
Place of birth for the foreign-born population - Indonesia (%)
Place of birth for the foreign-born population - Laos (%)
Place of birth for the foreign-born population - Malaysia (%)
Place of birth for the foreign-born population - Philippines (%)
Place of birth for the foreign-born population - Singapore (%)
Place of birth for the foreign-born population - Thailand (%)
Place of birth for the foreign-born population - Vietnam (%)
Place of birth for the foreign-born population - Other South Eastern Asia (%)
Place of birth for the foreign-born population - Armenia (%)
Place of birth for the foreign-born population - Iraq (%)
Place of birth for the foreign-born population - Israel (%)
Place of birth for the foreign-born population - Jordan (%)
Place of birth for the foreign-born population - Kuwait (%)
Place of birth for the foreign-born population - Lebanon (%)
Place of birth for the foreign-born population - Saudi Arabia (%)
Place of birth for the foreign-born population - Syria (%)
Place of birth for the foreign-born population - Turkey (%)
Place of birth for the foreign-born population - Yemen (%)
Place of birth for the foreign-born population - Other Western Asia (%)
Place of birth for the foreign-born population - Eritrea (%)
Place of birth for the foreign-born population - Ethiopia (%)
Place of birth for the foreign-born population - Kenya (%)
Place of birth for the foreign-born population - Somalia (%)
Place of birth for the foreign-born population - Uganda (%)
Place of birth for the foreign-born population - Zimbabwe (%)
Place of birth for the foreign-born population - Other Eastern Africa (%)
Place of birth for the foreign-born population - Cameroon (%)
Place of birth for the foreign-born population - Congo (%)
Place of birth for the foreign-born population - Democratic Republic of Congo (Zaire) (%)
Place of birth for the foreign-born population - Other Middle Africa (%)
Place of birth for the foreign-born population - Egypt (%)
Place of birth for the foreign-born population - Morocco (%)
Place of birth for the foreign-born population - Sudan (%)
Place of birth for the foreign-born population - Other Northern Africa (%)
Place of birth for the foreign-born population - South Africa (%)
Place of birth for the foreign-born population - Other Southern Africa (%)
Place of birth for the foreign-born population - Cabo Verde (%)
Place of birth for the foreign-born population - Ghana (%)
Place of birth for the foreign-born population - Liberia (%)
Place of birth for the foreign-born population - Nigeria (%)
Place of birth for the foreign-born population - Senegal (%)
Place of birth for the foreign-born population - Sierra Leone (%)
Place of birth for the foreign-born population - Other Western Africa (%)
Place of birth for the foreign-born population - Australia (%)
Place of birth for the foreign-born population - New Zealand (%)
Place of birth for the foreign-born population - Fiji (%)
Place of birth for the foreign-born population - Micronesia (%)
Place of birth for the foreign-born population - Bahamas (%)
Place of birth for the foreign-born population - Barbados (%)
Place of birth for the foreign-born population - Cuba (%)
Place of birth for the foreign-born population - Dominica (%)
Place of birth for the foreign-born population - Dominican Republic (%)
Place of birth for the foreign-born population - Grenada (%)
Place of birth for the foreign-born population - Haiti (%)
Place of birth for the foreign-born population - Jamaica (%)
Place of birth for the foreign-born population - St. Vincent and the Grenadines (%)
Place of birth for the foreign-born population - Trinidad and Tobago (%)
Place of birth for the foreign-born population - West Indies (%)
Place of birth for the foreign-born population - Other Caribbean (%)
Place of birth for the foreign-born population - Belize (%)
Place of birth for the foreign-born population - Costa Rica (%)
Place of birth for the foreign-born population - El Salvador (%)
Place of birth for the foreign-born population - Guatemala (%)
Place of birth for the foreign-born population - Honduras (%)
Place of birth for the foreign-born population - Mexico (%)
Place of birth for the foreign-born population - Nicaragua (%)
Place of birth for the foreign-born population - Panama (%)
Place of birth for the foreign-born population - Other Central America (%)
Place of birth for the foreign-born population - Argentina (%)
Place of birth for the foreign-born population - Bolivia (%)
Place of birth for the foreign-born population - Brazil (%)
Place of birth for the foreign-born population - Chile (%)
Place of birth for the foreign-born population - Colombia (%)
Place of birth for the foreign-born population - Ecuador (%)
Place of birth for the foreign-born population - Guyana (%)
Place of birth for the foreign-born population - Peru (%)
Place of birth for the foreign-born population - Uruguay (%)
Place of birth for the foreign-born population - Venezuela (%)
Place of birth for the foreign-born population - Other South America (%)
Place of birth for the foreign-born population - Canada (%)
Place of birth for the foreign-born population - Other Northern America (%)
Place of birth for the foreign-born population - Other (%)
Latest news about races in Bluffton, SC collected exclusively by city-data.com from local newspapers, TV, and radio stations
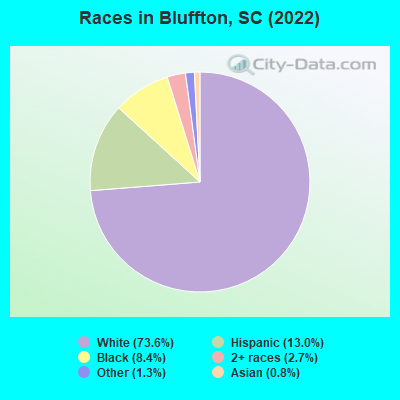
According to 2022 data, the most numerous races in Bluffton, SC are White alone (22,460 residents), Black alone (2,554 residents), and Hispanic (3,966 residents). 88.4% of Bluffton residents speak English at home. 5.6% of Bluffton, SC residents are foreign-born (4.2% born in Latin America, 0.6% born in Europe, 0.6% born in Asia), which is 9.9% greater than the foreign-born rate of 5.0% across the entire state of South Carolina.
Race distribution in Bluffton
2000 2022
2,652,291 66.1% White alone 1,178,486 29.4% Black alone 95,076 2.4% Hispanic 35,568 0.9% Asian alone 33,290 0.8% Two or more races 12,765 0.3% American Indian alone 3,266 0.08% Other race alone 1,270 0.03% Native Hawaiian and Other
3,301,739 62.5% White alone 1,313,290 24.9% Black alone 343,783 6.5% Hispanic 190,508 3.6% Two or more races 89,888 1.7% Asian alone 29,390 0.6% Other race alone 12,112 0.2% American Indian alone 1,924 0.04% Native Hawaiian and Other
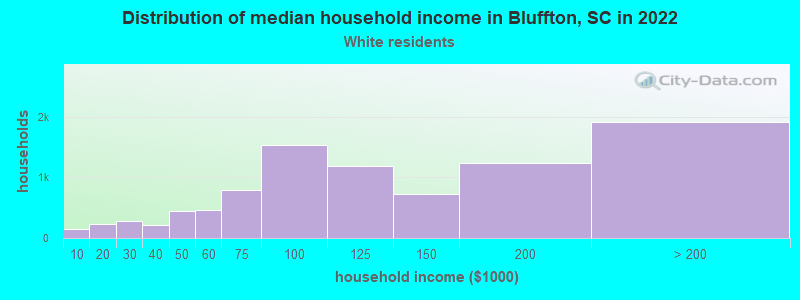
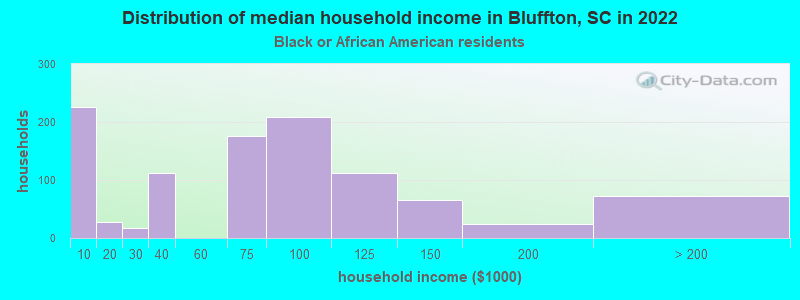
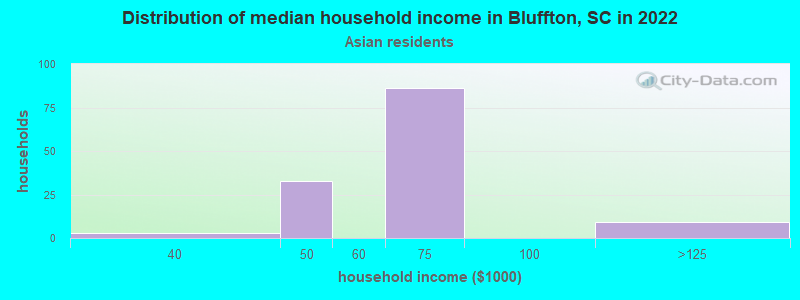
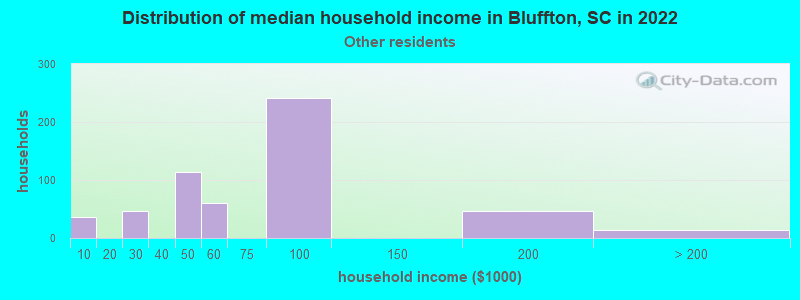
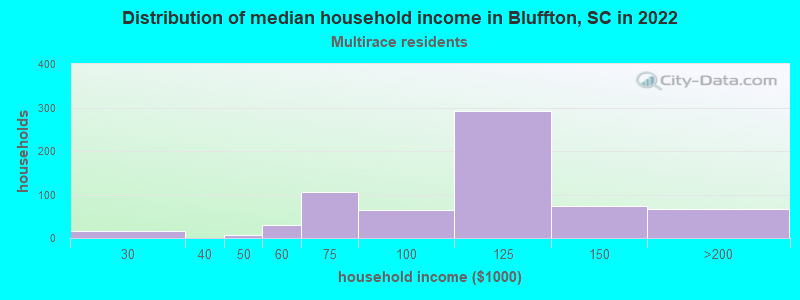
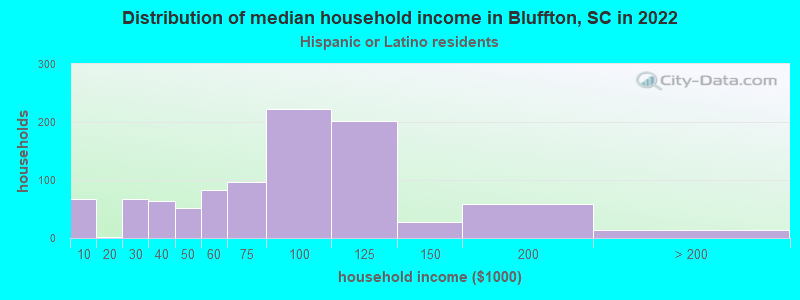
Income and house value in Bluffton Median household income in 2022 $109,676 White non-Hispanic householders$85,359 Black householders$67,389 Asian householders$83,327 Some other race householders$122,949 Two or more races householders$100,467 Hispanic or Latino race householdersMedian 2022 house value $615,559 White Non-Hispanic householders$438,420 Black or African American householdersover $1,000,000 Some other race householdersover $1,000,000 Hispanic or Latino householders
Median age by race in Bluffton
45.8 Median age for White residents45.2 46.3 36.8 Median age for Black or African American residents35.8 40.5 9.1 Median age for American Indian / Alaska Native residents12.1 -659,400,544.3 40.9 Median age for Asian residents52.0 39.9 -698,412,697.7 Median age for Native Hawaiian / Pacific Islander residents-551,574,375.1 -666,666,666.0 17.5 Median age for Other race residents12.7 22.0 18.2 Median age for Two or more races residents19.2 17.5 46.5 Median age for White alone residents45.4 46.9 17.5 Median age for Hispanic or Latino residents16.4 17.6
Owner/renter occupied households by race in Bluffton
House owners and renters - White residents 7,549 83.1% Owner occupied1,538 16.9% Renter occupiedHouse owners and renters - Black or African American residents 732 75.7% Owner occupied235 24.3% Renter occupiedHouse owners and renters - American Indian / Alaska Native residents 10 100.0% Owner occupiedHouse owners and renters - Asian residents 126 100.0% Owner occupiedHouse owners and renters - Native Hawaiian / Pacific Islander residents 6 100.0% Renter occupiedHouse owners and renters - Other race residents 294 63.2% Owner occupied171 36.8% Renter occupiedHouse owners and renters - Two or more races residents 576 88.7% Owner occupied73 11.3% Renter occupiedHouse owners and renters - White alone residents 7,419 82.9% Owner occupied1,531 17.1% Renter occupiedHouse owners and renters - Hispanic or Latino residents 640 72.9% Owner occupied237 27.1% Renter occupied
Language usage in Bluffton
English speakers - Total 88.4% of residents of Bluffton speak English at home.
9.5% of residents speak Spanish at home 2,038 73.2% Speak English very well745 26.8% Speak English less than very well2.4% of residents speak other language at home 534 75.3% Speak English very well175 24.7% Speak English less than very well
English speakers - Born in the United States 96.2% of residents of Bluffton speak English at home.
2.3% of residents speak Spanish at home 406 79.9% Speak English very well102 20.1% Speak English less than very well0.8% of residents speak other language at home 170 93.9% Speak English very well11 6.1% Speak English less than very well
English speakers - Native, born elsewhere 68.5% of residents of Bluffton speak English at home.
12.7% of residents speak Spanish at home 33 68.8% Speak English very well15 31.2% Speak English less than very well39.2% of residents speak other language at home 148 100.0% Speak English very well
English speakers - Foreign-born 18.6% of residents of Bluffton speak English at home.
60.2% of residents speak Spanish at home 418 41.8% Speak English very well582 58.2% Speak English less than very well19.1% of residents speak other language at home 193 60.9% Speak English very well124 39.1% Speak English less than very well
White (Caucasian) - Speak only English Native:
96.1% (21,013)Foreign-born:
30.0% (168)
White (Caucasian) - Speak another language Native:
3.9% (854)Foreign-born:
64.2% (360)
Black or African American - Speak only English Native:
97.3% (2,223)Foreign-born:
28.0% (18)
Black or African American - Speak another language Native:
2.8% (65)Foreign-born:
84.8% (55)
Asian - Speak only English Native:
72.6% (89)Foreign-born:
17.6% (21)
Asian - Speak another language Native:
25.2% (31)Foreign-born:
82.3% (100)
Other race - Speak only English Native:
21.5% (235)Foreign-born:
3.4% (28)
Other race - Speak another language Native:
76.0% (834)Foreign-born:
95.5% (804)
Two or more races - Speak only English Native:
94.9% (2,212)Foreign-born:
97.1% (54)
Two or more races - Speak another language Native:
8.3% (193)Foreign-born:
25.2% (14)
White alone - Speak only English Native:
97.7% (20,903)Foreign-born:
53.9% (142)
White alone - Speak another language Native:
2.3% (501)Foreign-born:
42.5% (112)
Hispanic or Latino - Speak only English Native:
57.9% (1,608)Foreign-born:
8.3% (90)
Hispanic or Latino - Speak another language Native:
44.7% (1,239)Foreign-born:
90.6% (989)
Foreign-born residents in Bluffton 1,694 residents are foreign born (4.2% Latin America , 0.6% Europe , 0.6% Asia ).
This city:
5.6%South Carolina:
5.3%
Marital status for residents in Bluffton Marital status - White (Caucasian) population 15 years and over
Males 23.8% Never married65.4% Now married1.1% Separated3.6% Widowed6.1% DivorcedFemales 19.0% Never married65.4% Now married1.2% Separated4.6% Widowed9.7% DivorcedWomen who gave birth in the past 12 months Now married:
81.7% (200)Unmarried:
18.3% (45)
Women who did not give birth in the past 12 months Now married:
56.8% (2,428)Unmarried:
43.2% (1,843)
Marital status - Black or African American population 15 years and over
Males 43.5% Never married52.5% Now married0.0% Separated0.6% Widowed3.4% DivorcedFemales 43.5% Never married35.2% Now married0.0% Separated9.4% Widowed12.0% DivorcedWomen who gave birth in the past 12 months Now married:
100.0% (58)Unmarried:
0.0% (0)
Women who did not give birth in the past 12 months Now married:
23.2% (172)Unmarried:
76.8% (569)
Marital status - American Indian / Alaska Native population 15 years and over
Males 22.2% Never married77.8% Now married0.0% Separated0.0% Widowed0.0% DivorcedFemales 0.0% Never married100.0% Now married0.0% Separated0.0% Widowed0.0% DivorcedWomen who did not give birth in the past 12 months Now married:
100.0% (5)Unmarried:
0.0% (0)
Marital status - Asian population 15 years and over
Males 0.0% Never married100.0% Now married0.0% Separated0.0% Widowed0.0% DivorcedFemales 60.1% Never married23.4% Now married0.0% Separated1.9% Widowed14.6% DivorcedWomen who did not give birth in the past 12 months Now married:
22.8% (31)Unmarried:
77.2% (105)
Marital status - Other race population 15 years and over
Males 10.7% Never married89.0% Now married0.0% Separated0.0% Widowed0.3% DivorcedFemales 32.8% Never married57.0% Now married0.0% Separated0.0% Widowed10.2% DivorcedWomen who gave birth in the past 12 months Now married:
100.0% (61)Unmarried:
0.0% (0)
Women who did not give birth in the past 12 months Now married:
52.0% (425)Unmarried:
48.0% (392)
Marital status - Two or more races population 15 years and over
Males 49.9% Never married49.2% Now married0.0% Separated0.0% Widowed0.9% DivorcedFemales 33.5% Never married66.5% Now married0.0% Separated0.0% Widowed0.0% DivorcedWomen who did not give birth in the past 12 months Now married:
66.3% (281)Unmarried:
33.7% (142)
Marital status - White alone, not Hispanic / Latino population 15 years and over
Males 22.4% Never married66.3% Now married1.1% Separated3.8% Widowed6.4% DivorcedFemales 18.2% Never married66.3% Now married1.3% Separated4.8% Widowed9.5% DivorcedWomen who gave birth in the past 12 months Now married:
81.7% (201)Unmarried:
18.3% (45)
Women who did not give birth in the past 12 months Now married:
58.4% (2,347)Unmarried:
41.6% (1,674)
Marital status - Hispanic or Latino population 15 years and over
Males 45.4% Never married54.5% Now married0.0% Separated0.0% Widowed0.1% DivorcedFemales 38.9% Never married49.4% Now married0.0% Separated0.0% Widowed11.7% DivorcedWomen who gave birth in the past 12 months Now married:
100.0% (50)Unmarried:
0.0% (0)
Women who did not give birth in the past 12 months Now married:
47.9% (518)Unmarried:
52.1% (564)
Ancestries in Bluffton
1,830 13.7% American1,227 9.2% Italian1,098 8.2% Irish1,062 8.0% English1,054 7.9% German566 4.2% European364 2.7% Polish273 2.0% Russian225 1.7% Scottish197 1.5% Slovak169 1.3% Ukrainian139 1.0% French Canadian124 0.9% Swedish119 0.9% Finnish118 0.9% Scotch-Irish87 0.7% Dutch64 0.5% Norwegian61 0.5% Guyanese55 0.4% Turkish43 0.3% Scandinavian34 0.3% Hungarian33 0.2% British29 0.2% French29 0.2% Ethiopian29 0.2% South African26 0.2% Portuguese24 0.2% Northern European22 0.2% Welsh21 0.2% Czech18 0.1% Canadian16 0.1% Lebanese15 0.1% Haitian13 0.10% Greek10 0.08% Eastern European10 0.08% Pennsylvania German4 0.03% Lithuanian3 0.02% Swiss1 0.01% Czechoslovakian
Geographical mobility in Bluffton Same house 1 year ago 18,527 80.2% White (Caucasian)2,143 85.1% Black or African American116 100.0% American Indian / Alaska Native241 99.7% Asian2,195 93.4% Other race2,170 92.5% Two or more races17,722 79.4% White alone, not Hispanic / Latino3,524 89.5% Hispanic or LatinoMoved within same county 855 3.7% White / Caucasian167 6.6% Black or African American24 1.0% Two or more races841 3.8% White alone, not Hispanic / Latino62 1.6% Hispanic or LatinoMoved within same state 1,184 5.1% White / Caucasian67 2.7% Black or African American6 100.0% Native Hawaiian / Pacific Islander92 3.9% Other race1,184 5.3% White alone, not Hispanic / Latino6 0.1% Hispanic or LatinoMoved from different state 2,807 12.2% White / Caucasian141 5.6% Black or African American10 0.4% Other race2,898 13.0% White alone, not Hispanic / Latino63 1.6% Hispanic or LatinoMoved from abroad 74 0.3% White51 0.2% White alone, not Hispanic / Latino
Children Nativity (place of birth) in Bluffton
Children under 6 years - Living with two parents Both parents native 1,046 100.0% NativeBoth parents foreign-born 24 100.0% NativeOne native, one foreign-born parent 98 100.0% NativeChildren under 6 years - Living with one parent Native parent 292 100.0% NativeForeign-born parent 91 100.0% NativeChildren 6 to 17 years - Living with two parents Both parents native 3,783 99.8% Native8 0.2% Foreign-bornBoth parents foreign-born 421 72.2% Native163 27.8% Foreign-bornOne native, one foreign-born parent 364 100.0% NativeChildren 6 to 17 years - Living with one parent Native parent 829 100.0% NativeForeign-born parent 204 49.6% Native208 50.4% Foreign-born
Grandparents responsible for own grandchildren in Bluffton
Grandparents (30 to 59 years) White / Caucasian 38 70.4% Responsible for grandchildren16 29.6% Not responsible for grandchildrenBlack or African American 24 100.0% Not responsible for grandchildrenWhite alone, not Hispanic / Latino 39 70.8% Responsible for grandchildren16 29.2% Not responsible for grandchildren
Grandparents (60 years and over) White / Caucasian 54 100.0% Not responsible for grandchildrenBlack or African American 13 100.0% Not responsible for grandchildrenWhite alone, not Hispanic / Latino 55 100.0% Not responsible for grandchildren