Races in Bloomingdale, Illinois (IL) Detailed Stats
Data:
Races - White alone (%)
Races - White alone (% change since 2000)
Races - Black alone (%)
Races - Black alone (% change since 2000)
Races - American Indian alone (%)
Races - American Indian alone (% change since 2000)
Races - Asian alone (%)
Races - Asian alone (% change since 2000)
Races - Hispanic (%)
Races - Hispanic (% change since 2000)
Races - Native Hawaiian and Other Pacific Islander alone (%)
Races - Native Hawaiian and Other Pacific Islander alone (% change since 2000)
Races - Two or more races(%)
Races - Two or more races(% change since 2000)
Races - Other race alone (%)
Races - Other race alone (% change since 2000)
Racial diversity
Place of birth - Born in state of residence (%)
Place of birth - Born in state of residence (%) - White
Place of birth - Born in state of residence (%) - Black or African American
Place of birth - Born in state of residence (%) - Asian
Place of birth - Born in state of residence (%) - Hispanic or Latino
Place of birth - Born in state of residence (%) - American Indian and Alaska Native
Place of birth - Born in state of residence (%) - Multirace
Place of birth - Born in state of residence (%) - Other Race
Place of birth - Born in other state (%)
Place of birth - Born in other state (%) - White
Place of birth - Born in other state (%) - Black or African American
Place of birth - Born in other state (%) - Asian
Place of birth - Born in other state (%) - Hispanic or Latino
Place of birth - Born in other state (%) - American Indian and Alaska Native
Place of birth - Born in other state (%) - Multirace
Place of birth - Born in other state (%) - Other Race
Place of birth - Native, outside of US (%)
Place of birth - Native, outside of US (%) - White
Place of birth - Native, outside of US (%) - Black or African American
Place of birth - Native, outside of US (%) - Asian
Place of birth - Native, outside of US (%) - Hispanic or Latino
Place of birth - Native, outside of US (%) - American Indian and Alaska Native
Place of birth - Native, outside of US (%) - Multirace
Place of birth - Native, outside of US (%) - Other Race
Place of birth - Foreign born (%)
Place of birth - Foreign born (%) - White
Place of birth - Foreign born (%) - Black or African American
Place of birth - Foreign born (%) - Asian
Place of birth - Foreign born (%) - Hispanic or Latino
Place of birth - Foreign born (%) - American Indian and Alaska Native
Place of birth - Foreign born (%) - Multirace
Place of birth - Foreign born (%) - Other Race
Residents speaking English at home (%)
Residents speaking English at home - Born in the United States (%)
Residents speaking English at home - Native, born elsewhere (%)
Residents speaking English at home - Foreign born (%)
Residents speaking Spanish at home (%)
Residents speaking Spanish at home - Born in the United States (%)
Residents speaking Spanish at home - Native, born elsewhere (%)
Residents speaking Spanish at home - Foreign born (%)
Residents speaking other language at home (%)
Residents speaking other language at home - Born in the United States (%)
Residents speaking other language at home - Native, born elsewhere (%)
Residents speaking other language at home - Foreign born (%)
Marital status - Never married (%)
Marital status - Now married (%)
Marital status - Separated (%)
Marital status - Widowed (%)
Marital status - Divorced (%)
Ancestries Reported - Arab (%)
Ancestries Reported - Czech (%)
Ancestries Reported - Danish (%)
Ancestries Reported - Dutch (%)
Ancestries Reported - English (%)
Ancestries Reported - French (%)
Ancestries Reported - French Canadian (%)
Ancestries Reported - German (%)
Ancestries Reported - Greek (%)
Ancestries Reported - Hungarian (%)
Ancestries Reported - Irish (%)
Ancestries Reported - Italian (%)
Ancestries Reported - Lithuanian (%)
Ancestries Reported - Norwegian (%)
Ancestries Reported - Polish (%)
Ancestries Reported - Portuguese (%)
Ancestries Reported - Russian (%)
Ancestries Reported - Scotch-Irish (%)
Ancestries Reported - Scottish (%)
Ancestries Reported - Slovak (%)
Ancestries Reported - Subsaharan African (%)
Ancestries Reported - Swedish (%)
Ancestries Reported - Swiss (%)
Ancestries Reported - Ukrainian (%)
Ancestries Reported - United States (%)
Ancestries Reported - Welsh (%)
Ancestries Reported - West Indian (%)
Ancestries Reported - Other (%)
Geographical mobility - Same house 1 year ago (%)
Geographical mobility - Same house 1 year ago (%) - White
Geographical mobility - Same house 1 year ago (%) - Black or African American
Geographical mobility - Same house 1 year ago (%) - Asian
Geographical mobility - Same house 1 year ago (%) - Hispanic or Latino
Geographical mobility - Same house 1 year ago (%) - American Indian and Alaska Native
Geographical mobility - Same house 1 year ago (%) - Multirace
Geographical mobility - Same house 1 year ago (%) - Other Race
Geographical mobility - Moved within same county (%)
Geographical mobility - Moved within same county (%) - White
Geographical mobility - Moved within same county (%) - Black or African American
Geographical mobility - Moved within same county (%) - Asian
Geographical mobility - Moved within same county (%) - Hispanic or Latino
Geographical mobility - Moved within same county (%) - American Indian and Alaska Native
Geographical mobility - Moved within same county (%) - Multirace
Geographical mobility - Moved within same county (%) - Other Race
Geographical mobility - Moved from different county within same state (%)
Geographical mobility - Moved from different county within same state (%) - White
Geographical mobility - Moved from different county within same state (%) - Black or African American
Geographical mobility - Moved from different county within same state (%) - Asian
Geographical mobility - Moved from different county within same state (%) - Hispanic or Latino
Geographical mobility - Moved from different county within same state (%) - American Indian and Alaska Native
Geographical mobility - Moved from different county within same state (%) - Multirace
Geographical mobility - Moved from different county within same state (%) - Other Race
Geographical mobility - Moved from different state (%)
Geographical mobility - Moved from different state (%) - White
Geographical mobility - Moved from different state (%) - Black or African American
Geographical mobility - Moved from different state (%) - Asian
Geographical mobility - Moved from different state (%) - Hispanic or Latino
Geographical mobility - Moved from different state (%) - American Indian and Alaska Native
Geographical mobility - Moved from different state (%) - Multirace
Geographical mobility - Moved from different state (%) - Other Race
Geographical mobility - Moved from abroad (%)
Geographical mobility - Moved from abroad (%) - White
Geographical mobility - Moved from abroad (%) - Black or African American
Geographical mobility - Moved from abroad (%) - Asian
Geographical mobility - Moved from abroad (%) - Hispanic or Latino
Geographical mobility - Moved from abroad (%) - American Indian and Alaska Native
Geographical mobility - Moved from abroad (%) - Multirace
Geographical mobility - Moved from abroad (%) - Other Race
Place of birth for the foreign-born population - Ireland (%)
Place of birth for the foreign-born population - Denmark (%)
Place of birth for the foreign-born population - Norway (%)
Place of birth for the foreign-born population - Sweden (%)
Place of birth for the foreign-born population - United Kingdom (%)
Place of birth for the foreign-born population - England (%)
Place of birth for the foreign-born population - Scotland (%)
Place of birth for the foreign-born population - Other Northern Europe (%)
Place of birth for the foreign-born population - Austria (%)
Place of birth for the foreign-born population - Belgium (%)
Place of birth for the foreign-born population - France (%)
Place of birth for the foreign-born population - Germany (%)
Place of birth for the foreign-born population - Netherlands (%)
Place of birth for the foreign-born population - Switzerland (%)
Place of birth for the foreign-born population - Other Western Europe (%)
Place of birth for the foreign-born population - Greece (%)
Place of birth for the foreign-born population - Italy (%)
Place of birth for the foreign-born population - Portugal (%)
Place of birth for the foreign-born population - Spain (%)
Place of birth for the foreign-born population - Other Southern Europe (%)
Place of birth for the foreign-born population - Albania (%)
Place of birth for the foreign-born population - Belarus (%)
Place of birth for the foreign-born population - Bosnia and Herzegovina (%)
Place of birth for the foreign-born population - Bulgaria (%)
Place of birth for the foreign-born population - Croatia (%)
Place of birth for the foreign-born population - Czechoslovakia (%)
Place of birth for the foreign-born population - Hungary (%)
Place of birth for the foreign-born population - Latvia (%)
Place of birth for the foreign-born population - Lithuania (%)
Place of birth for the foreign-born population - North Macedonia (Macedonia) (%)
Place of birth for the foreign-born population - Moldova (%)
Place of birth for the foreign-born population - Poland (%)
Place of birth for the foreign-born population - Romania (%)
Place of birth for the foreign-born population - Russia (%)
Place of birth for the foreign-born population - Serbia (%)
Place of birth for the foreign-born population - Ukraine (%)
Place of birth for the foreign-born population - Other Eastern Europe (%)
Place of birth for the foreign-born population - China (%)
Place of birth for the foreign-born population - Hong Kong (%)
Place of birth for the foreign-born population - Taiwan (%)
Place of birth for the foreign-born population - Japan (%)
Place of birth for the foreign-born population - Korea (%)
Place of birth for the foreign-born population - Other Eastern Asia (%)
Place of birth for the foreign-born population - Afghanistan (%)
Place of birth for the foreign-born population - Bangladesh (%)
Place of birth for the foreign-born population - India (%)
Place of birth for the foreign-born population - Iran (%)
Place of birth for the foreign-born population - Kazakhstan (%)
Place of birth for the foreign-born population - Nepal (%)
Place of birth for the foreign-born population - Pakistan (%)
Place of birth for the foreign-born population - Sri Lanka (%)
Place of birth for the foreign-born population - Uzbekistan (%)
Place of birth for the foreign-born population - Other South Central Asia (%)
Place of birth for the foreign-born population - Burma (%)
Place of birth for the foreign-born population - Cambodia (%)
Place of birth for the foreign-born population - Indonesia (%)
Place of birth for the foreign-born population - Laos (%)
Place of birth for the foreign-born population - Malaysia (%)
Place of birth for the foreign-born population - Philippines (%)
Place of birth for the foreign-born population - Singapore (%)
Place of birth for the foreign-born population - Thailand (%)
Place of birth for the foreign-born population - Vietnam (%)
Place of birth for the foreign-born population - Other South Eastern Asia (%)
Place of birth for the foreign-born population - Armenia (%)
Place of birth for the foreign-born population - Iraq (%)
Place of birth for the foreign-born population - Israel (%)
Place of birth for the foreign-born population - Jordan (%)
Place of birth for the foreign-born population - Kuwait (%)
Place of birth for the foreign-born population - Lebanon (%)
Place of birth for the foreign-born population - Saudi Arabia (%)
Place of birth for the foreign-born population - Syria (%)
Place of birth for the foreign-born population - Turkey (%)
Place of birth for the foreign-born population - Yemen (%)
Place of birth for the foreign-born population - Other Western Asia (%)
Place of birth for the foreign-born population - Eritrea (%)
Place of birth for the foreign-born population - Ethiopia (%)
Place of birth for the foreign-born population - Kenya (%)
Place of birth for the foreign-born population - Somalia (%)
Place of birth for the foreign-born population - Uganda (%)
Place of birth for the foreign-born population - Zimbabwe (%)
Place of birth for the foreign-born population - Other Eastern Africa (%)
Place of birth for the foreign-born population - Cameroon (%)
Place of birth for the foreign-born population - Congo (%)
Place of birth for the foreign-born population - Democratic Republic of Congo (Zaire) (%)
Place of birth for the foreign-born population - Other Middle Africa (%)
Place of birth for the foreign-born population - Egypt (%)
Place of birth for the foreign-born population - Morocco (%)
Place of birth for the foreign-born population - Sudan (%)
Place of birth for the foreign-born population - Other Northern Africa (%)
Place of birth for the foreign-born population - South Africa (%)
Place of birth for the foreign-born population - Other Southern Africa (%)
Place of birth for the foreign-born population - Cabo Verde (%)
Place of birth for the foreign-born population - Ghana (%)
Place of birth for the foreign-born population - Liberia (%)
Place of birth for the foreign-born population - Nigeria (%)
Place of birth for the foreign-born population - Senegal (%)
Place of birth for the foreign-born population - Sierra Leone (%)
Place of birth for the foreign-born population - Other Western Africa (%)
Place of birth for the foreign-born population - Australia (%)
Place of birth for the foreign-born population - New Zealand (%)
Place of birth for the foreign-born population - Fiji (%)
Place of birth for the foreign-born population - Micronesia (%)
Place of birth for the foreign-born population - Bahamas (%)
Place of birth for the foreign-born population - Barbados (%)
Place of birth for the foreign-born population - Cuba (%)
Place of birth for the foreign-born population - Dominica (%)
Place of birth for the foreign-born population - Dominican Republic (%)
Place of birth for the foreign-born population - Grenada (%)
Place of birth for the foreign-born population - Haiti (%)
Place of birth for the foreign-born population - Jamaica (%)
Place of birth for the foreign-born population - St. Vincent and the Grenadines (%)
Place of birth for the foreign-born population - Trinidad and Tobago (%)
Place of birth for the foreign-born population - West Indies (%)
Place of birth for the foreign-born population - Other Caribbean (%)
Place of birth for the foreign-born population - Belize (%)
Place of birth for the foreign-born population - Costa Rica (%)
Place of birth for the foreign-born population - El Salvador (%)
Place of birth for the foreign-born population - Guatemala (%)
Place of birth for the foreign-born population - Honduras (%)
Place of birth for the foreign-born population - Mexico (%)
Place of birth for the foreign-born population - Nicaragua (%)
Place of birth for the foreign-born population - Panama (%)
Place of birth for the foreign-born population - Other Central America (%)
Place of birth for the foreign-born population - Argentina (%)
Place of birth for the foreign-born population - Bolivia (%)
Place of birth for the foreign-born population - Brazil (%)
Place of birth for the foreign-born population - Chile (%)
Place of birth for the foreign-born population - Colombia (%)
Place of birth for the foreign-born population - Ecuador (%)
Place of birth for the foreign-born population - Guyana (%)
Place of birth for the foreign-born population - Peru (%)
Place of birth for the foreign-born population - Uruguay (%)
Place of birth for the foreign-born population - Venezuela (%)
Place of birth for the foreign-born population - Other South America (%)
Place of birth for the foreign-born population - Canada (%)
Place of birth for the foreign-born population - Other Northern America (%)
Place of birth for the foreign-born population - Other (%)
Latest news about races in Bloomingdale, IL collected exclusively by city-data.com from local newspapers, TV, and radio stations
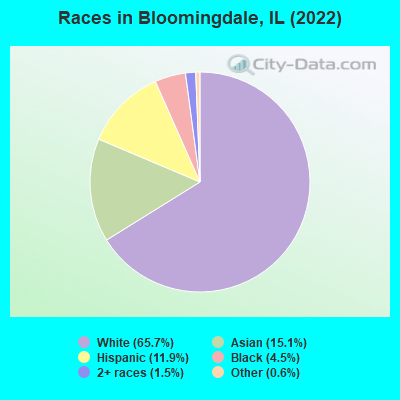
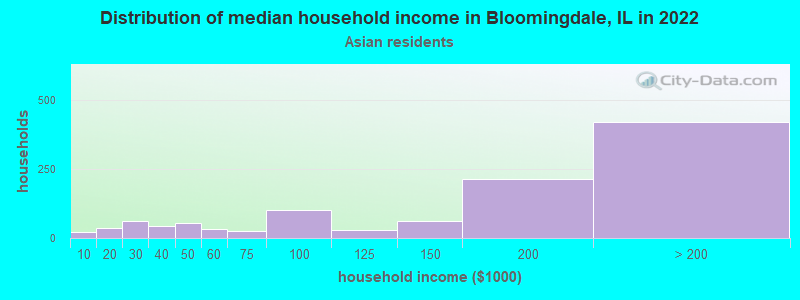
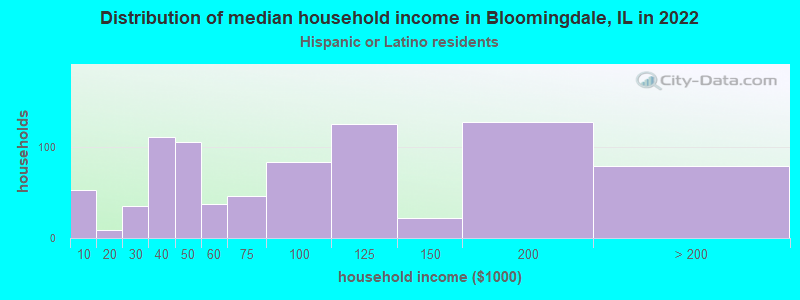
According to 2022 data, the most numerous races in Bloomingdale, IL are White alone (14,589 residents), Hispanic (2,647 residents), and Black alone (1,002 residents). 74.2% of Bloomingdale residents speak English at home. 19.5% of Bloomingdale, IL residents are foreign-born (9.3% born in Asia, 6.8% born in Europe, 2.6% born in Latin America), which is 28.1% greater than the foreign-born rate of 14.0% across the entire state of Illinois.
Race distribution in Bloomingdale
2000 2022
8,424,140 67.8% White alone 1,856,152 14.9% Black alone 1,530,262 12.3% Hispanic 419,916 3.4% Asian alone 153,996 1.2% Two or more races 13,479 0.1% Other race alone 18,232 0.1% American Indian alone 3,116 0.03% Native Hawaiian and Other
7,356,301 58.5% White alone 2,299,726 18.3% Hispanic 1,660,423 13.2% Black alone 747,296 5.9% Asian alone 458,599 3.6% Two or more races 45,386 0.4% Other race alone 10,405 0.08% American Indian alone 3,896 0.03% Native Hawaiian and Other
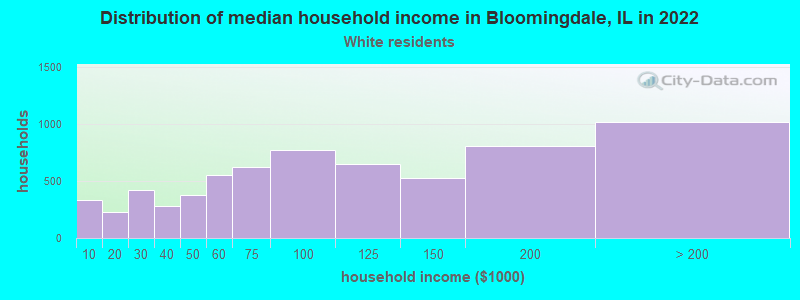
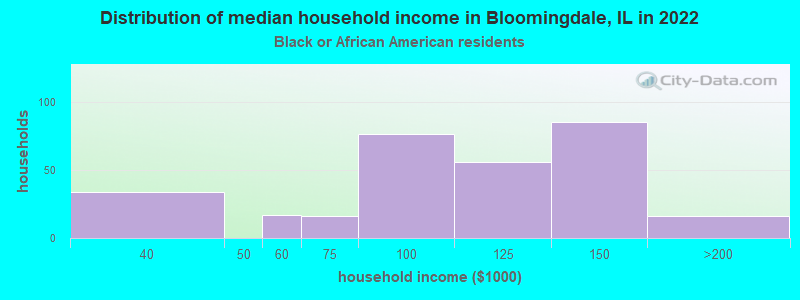
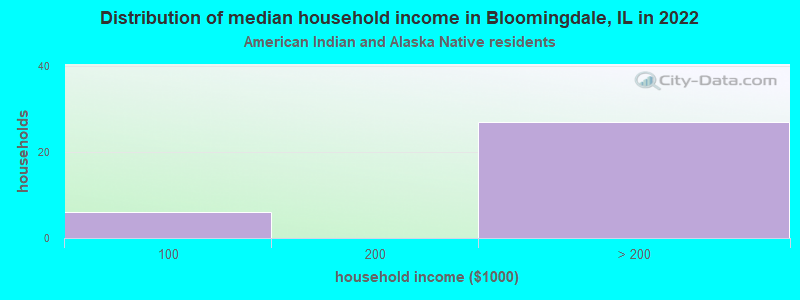
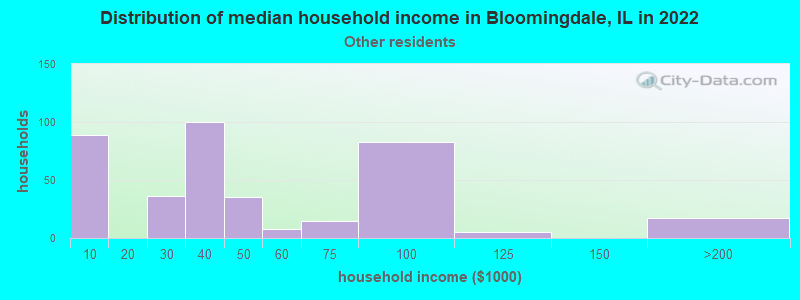
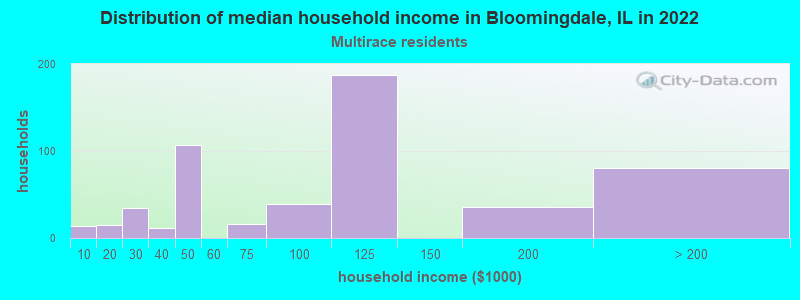
Income and house value in Bloomingdale Median household income in 2022 $88,678 White non-Hispanic householders$100,764 Black householders$154,937 Asian householders$43,441 Some other race householders$108,653 Two or more races householders$84,615 Hispanic or Latino race householdersMedian 2022 house value $362,866 White Non-Hispanic householders$399,521 Black or African American householders $419,515 Asian householders$353,396 Some other race householders$460,379 Two or more races householders$375,318 Hispanic or Latino householders
Median age by race in Bloomingdale
50.3 Median age for White residents44.7 53.2 28.7 Median age for Black or African American residents29.1 39.2 16.3 Median age for American Indian / Alaska Native residents17.1 12.7 40.7 Median age for Asian residents42.0 40.2 -593,236,714.4 Median age for Native Hawaiian / Pacific Islander residents-658,536,584.7 -576,015,108.0 44.8 Median age for Other race residents43.7 52.9 24.0 Median age for Two or more races residents27.0 21.9 50.1 Median age for White alone residents44.9 54.4 28.6 Median age for Hispanic or Latino residents31.4 25.4
Owner/renter occupied households by race in Bloomingdale
House owners and renters - White residents 5,260 80.1% Owner occupied1,304 19.9% Renter occupiedHouse owners and renters - Black or African American residents 35 10.1% Owner occupied309 89.9% Renter occupiedHouse owners and renters - American Indian / Alaska Native residents 27 100.0% Owner occupiedHouse owners and renters - Asian residents 861 76.7% Owner occupied261 23.3% Renter occupiedHouse owners and renters - Other race residents 139 44.1% Owner occupied176 55.9% Renter occupiedHouse owners and renters - Two or more races residents 419 72.8% Owner occupied156 27.2% Renter occupiedHouse owners and renters - White alone residents 5,258 80.6% Owner occupied1,269 19.4% Renter occupiedHouse owners and renters - Hispanic or Latino residents 492 59.9% Owner occupied330 40.1% Renter occupied
Language usage in Bloomingdale
English speakers - Total 74.2% of residents of Bloomingdale speak English at home.
5.2% of residents speak Spanish at home 739 66.8% Speak English very well367 33.2% Speak English less than very well20.1% of residents speak other language at home 2,623 61.7% Speak English very well1,625 38.3% Speak English less than very well
English speakers - Born in the United States 95.6% of residents of Bloomingdale speak English at home.
0.8% of residents speak Spanish at home 22 100.0% Speak English very well4.0% of residents speak other language at home 90 85.7% Speak English very well15 14.3% Speak English less than very well
English speakers - Native, born elsewhere 26.8% of residents of Bloomingdale speak English at home.
19.6% of residents speak Spanish at home 69 85.2% Speak English very well12 14.8% Speak English less than very well30.9% of residents speak other language at home 62 48.4% Speak English very well66 51.6% Speak English less than very well
English speakers - Foreign-born 15.5% of residents of Bloomingdale speak English at home.
11.4% of residents speak Spanish at home 181 36.7% Speak English very well312 63.3% Speak English less than very well71.8% of residents speak other language at home 1,746 56.4% Speak English very well1,348 43.6% Speak English less than very well
White (Caucasian) - Speak only English Native:
95.3% (11,942)Foreign-born:
22.3% (324)
White (Caucasian) - Speak another language Native:
5.0% (625)Foreign-born:
78.3% (1,135)
Black or African American - Speak another language Native:
7.9% (85)Foreign-born:
100.0% (21)
Asian - Speak only English Native:
58.4% (642)Foreign-born:
12.3% (248)
Asian - Speak another language Native:
41.3% (454)Foreign-born:
87.2% (1,763)
Other race - Speak only English Native:
62.8% (254)Foreign-born:
17.4% (85)
Other race - Speak another language Native:
44.2% (179)Foreign-born:
80.1% (392)
Two or more races - Speak only English Native:
86.4% (1,182)Foreign-born:
13.9% (32)
Two or more races - Speak another language Native:
9.8% (134)Foreign-born:
85.5% (197)
White alone - Speak only English Native:
95.3% (11,685)Foreign-born:
21.6% (354)
White alone - Speak another language Native:
4.7% (574)Foreign-born:
78.5% (1,289)
Hispanic or Latino - Speak only English Native:
68.0% (1,303)Foreign-born:
14.4% (86)
Hispanic or Latino - Speak another language Native:
30.7% (587)Foreign-born:
84.6% (507)
Foreign-born residents in Bloomingdale 4,326 residents are foreign born (9.3% Asia , 6.8% Europe , 2.6% Latin America ).
This city:
19.5%Illinois:
14.1%
Marital status for residents in Bloomingdale Marital status - White (Caucasian) population 15 years and over
Males 23.3% Never married61.7% Now married0.8% Separated5.1% Widowed9.1% DivorcedFemales 21.7% Never married50.8% Now married1.2% Separated15.8% Widowed10.5% DivorcedWomen who gave birth in the past 12 months Now married:
95.3% (126)Unmarried:
4.7% (6)
Women who did not give birth in the past 12 months Now married:
52.4% (1,387)Unmarried:
47.6% (1,262)
Marital status - Black or African American population 15 years and over
Males 60.6% Never married29.1% Now married3.2% Separated0.0% Widowed7.0% DivorcedFemales 43.7% Never married29.5% Now married3.0% Separated3.6% Widowed20.2% DivorcedWomen who gave birth in the past 12 months Now married:
0.0% (0)Unmarried:
100.0% (3)
Women who did not give birth in the past 12 months Now married:
27.3% (54)Unmarried:
72.7% (144)
Marital status - American Indian / Alaska Native population 15 years and over
Males 10.3% Never married89.7% Now married0.0% Separated0.0% Widowed0.0% DivorcedFemales 50.0% Never married50.0% Now married0.0% Separated0.0% Widowed0.0% DivorcedWomen who did not give birth in the past 12 months Now married:
50.0% (48)Unmarried:
50.0% (48)
Marital status - Asian population 15 years and over
Males 12.5% Never married77.8% Now married1.9% Separated1.6% Widowed6.2% DivorcedFemales 22.7% Never married64.9% Now married0.0% Separated5.5% Widowed7.0% DivorcedWomen who gave birth in the past 12 months Now married:
100.0% (22)Unmarried:
0.0% (0)
Women who did not give birth in the past 12 months Now married:
56.9% (475)Unmarried:
43.1% (361)
Marital status - Other race population 15 years and over
Males 50.6% Never married33.1% Now married12.3% Separated0.0% Widowed3.9% DivorcedFemales 23.6% Never married37.0% Now married0.0% Separated29.6% Widowed9.9% DivorcedWomen who gave birth in the past 12 months Now married:
0.0% (0)Unmarried:
100.0% (38)
Women who did not give birth in the past 12 months Now married:
46.1% (74)Unmarried:
53.9% (86)
Marital status - Two or more races population 15 years and over
Males 42.9% Never married51.4% Now married0.0% Separated1.1% Widowed4.6% DivorcedFemales 29.4% Never married63.3% Now married0.0% Separated2.4% Widowed4.9% DivorcedWomen who gave birth in the past 12 months Now married:
50.0% (13)Unmarried:
50.0% (13)
Women who did not give birth in the past 12 months Now married:
60.7% (255)Unmarried:
39.3% (165)
Marital status - White alone, not Hispanic / Latino population 15 years and over
Males 22.8% Never married62.7% Now married0.7% Separated5.2% Widowed8.5% DivorcedFemales 20.5% Never married50.9% Now married1.2% Separated16.4% Widowed11.0% DivorcedWomen who gave birth in the past 12 months Now married:
95.1% (128)Unmarried:
4.9% (7)
Women who did not give birth in the past 12 months Now married:
53.1% (1,363)Unmarried:
46.9% (1,204)
Marital status - Hispanic or Latino population 15 years and over
Males 37.6% Never married45.5% Now married5.9% Separated2.2% Widowed8.8% DivorcedFemales 33.4% Never married51.2% Now married0.0% Separated11.6% Widowed3.8% DivorcedWomen who gave birth in the past 12 months Now married:
32.1% (18)Unmarried:
67.9% (37)
Women who did not give birth in the past 12 months Now married:
55.0% (387)Unmarried:
45.0% (316)
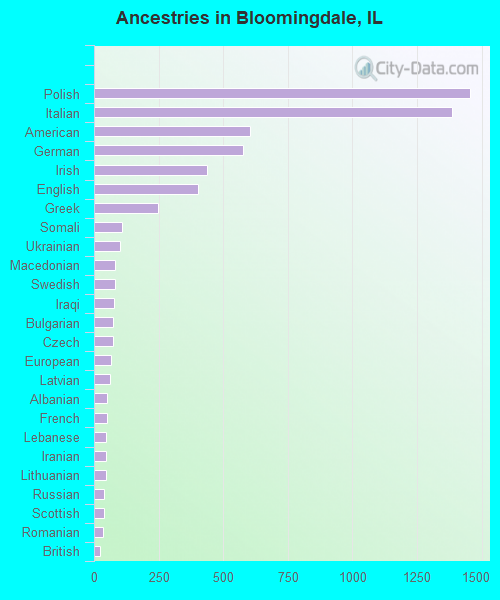
Ancestries in Bloomingdale
1,456 13.4% Polish1,385 12.8% Italian602 5.5% American578 5.3% German438 4.0% Irish401 3.7% English247 2.3% Greek108 1.0% Somali102 0.9% Ukrainian80 0.7% Macedonian80 0.7% Swedish78 0.7% Iraqi74 0.7% Bulgarian72 0.7% Czech65 0.6% European62 0.6% Latvian52 0.5% Albanian51 0.5% French47 0.4% Lebanese45 0.4% Iranian45 0.4% Lithuanian39 0.4% Russian38 0.3% Scottish35 0.3% Romanian23 0.2% British23 0.2% Croatian22 0.2% French Canadian22 0.2% Serbian21 0.2% Dutch17 0.2% Hungarian17 0.2% Norwegian16 0.1% Portuguese15 0.1% Assyrian12 0.1% Yugoslavian11 0.1% Eastern European11 0.1% Brazilian10 0.09% Austrian8 0.07% Slovene8 0.07% Swiss7 0.06% Finnish7 0.06% Slovak7 0.06% Welsh5 0.05% Pennsylvania German5 0.05% Armenian4 0.04% Canadian4 0.04% Cajun3 0.03% Northern European
Geographical mobility in Bloomingdale Same house 1 year ago 13,260 91.2% White (Caucasian)825 78.8% Black or African American219 94.3% American Indian / Alaska Native2,944 87.6% Asian641 72.0% Other race1,548 95.3% Two or more races13,219 91.6% White alone, not Hispanic / Latino2,217 85.9% Hispanic or LatinoMoved within same county 535 3.7% White / Caucasian64 6.1% Black or African American13 5.5% American Indian / Alaska Native81 2.4% Asian35 3.9% Other race25 1.5% Two or more races461 3.2% White alone, not Hispanic / Latino134 5.2% Hispanic or LatinoMoved within same state 536 3.7% White / Caucasian134 12.8% Black or African American149 4.4% Asian103 11.6% Other race49 3.0% Two or more races551 3.8% White alone, not Hispanic / Latino124 4.8% Hispanic or LatinoMoved from different state 128 0.9% White / Caucasian15 1.5% Black or African American120 3.6% Asian133 0.9% White alone, not Hispanic / LatinoMoved from abroad 104 0.7% White32 0.9% Asian141 15.8% Other race111 0.8% White alone, not Hispanic / Latino123 4.8% Hispanic or Latino
Children Nativity (place of birth) in Bloomingdale
Children under 6 years - Living with two parents Both parents native 749 100.0% NativeBoth parents foreign-born 191 100.0% NativeOne native, one foreign-born parent 211 100.0% NativeChildren under 6 years - Living with one parent Native parent 156 100.0% NativeForeign-born parent 5 100.0% NativeChildren 6 to 17 years - Living with two parents Both parents native 1,561 100.0% NativeBoth parents foreign-born 368 86.0% Native60 14.0% Foreign-bornOne native, one foreign-born parent 183 87.5% Native26 12.5% Foreign-bornChildren 6 to 17 years - Living with one parent Native parent 514 100.0% NativeForeign-born parent 139 48.1% Native150 51.9% Foreign-born
Grandparents responsible for own grandchildren in Bloomingdale
Grandparents (30 to 59 years) White / Caucasian 5 100.0% Not responsible for grandchildrenAsian 7 100.0% Not responsible for grandchildrenOther race 20 100.0% Not responsible for grandchildrenTwo or more races 33 100.0% Not responsible for grandchildrenWhite alone, not Hispanic / Latino 6 100.0% Not responsible for grandchildrenHispanic or Latino 54 100.0% Not responsible for grandchildrenGrandparents (60 years and over) White / Caucasian 5 6.5% Responsible for grandchildren77 93.5% Not responsible for grandchildrenAsian 12 9.6% Responsible for grandchildren114 90.4% Not responsible for grandchildrenOther race 5 100.0% Not responsible for grandchildrenWhite alone, not Hispanic / Latino 6 8.0% Responsible for grandchildren67 92.0% Not responsible for grandchildrenHispanic or Latino 32 100.0% Not responsible for grandchildren