Races in Billings, Montana (MT) Detailed Stats
Data:
Races - White alone (%)
Races - White alone (% change since 2000)
Races - Black alone (%)
Races - Black alone (% change since 2000)
Races - American Indian alone (%)
Races - American Indian alone (% change since 2000)
Races - Asian alone (%)
Races - Asian alone (% change since 2000)
Races - Hispanic (%)
Races - Hispanic (% change since 2000)
Races - Native Hawaiian and Other Pacific Islander alone (%)
Races - Native Hawaiian and Other Pacific Islander alone (% change since 2000)
Races - Two or more races(%)
Races - Two or more races(% change since 2000)
Races - Other race alone (%)
Races - Other race alone (% change since 2000)
Racial diversity
Place of birth - Born in state of residence (%)
Place of birth - Born in state of residence (%) - White
Place of birth - Born in state of residence (%) - Black or African American
Place of birth - Born in state of residence (%) - Asian
Place of birth - Born in state of residence (%) - Hispanic or Latino
Place of birth - Born in state of residence (%) - American Indian and Alaska Native
Place of birth - Born in state of residence (%) - Multirace
Place of birth - Born in state of residence (%) - Other Race
Place of birth - Born in other state (%)
Place of birth - Born in other state (%) - White
Place of birth - Born in other state (%) - Black or African American
Place of birth - Born in other state (%) - Asian
Place of birth - Born in other state (%) - Hispanic or Latino
Place of birth - Born in other state (%) - American Indian and Alaska Native
Place of birth - Born in other state (%) - Multirace
Place of birth - Born in other state (%) - Other Race
Place of birth - Native, outside of US (%)
Place of birth - Native, outside of US (%) - White
Place of birth - Native, outside of US (%) - Black or African American
Place of birth - Native, outside of US (%) - Asian
Place of birth - Native, outside of US (%) - Hispanic or Latino
Place of birth - Native, outside of US (%) - American Indian and Alaska Native
Place of birth - Native, outside of US (%) - Multirace
Place of birth - Native, outside of US (%) - Other Race
Place of birth - Foreign born (%)
Place of birth - Foreign born (%) - White
Place of birth - Foreign born (%) - Black or African American
Place of birth - Foreign born (%) - Asian
Place of birth - Foreign born (%) - Hispanic or Latino
Place of birth - Foreign born (%) - American Indian and Alaska Native
Place of birth - Foreign born (%) - Multirace
Place of birth - Foreign born (%) - Other Race
Residents speaking English at home (%)
Residents speaking English at home - Born in the United States (%)
Residents speaking English at home - Native, born elsewhere (%)
Residents speaking English at home - Foreign born (%)
Residents speaking Spanish at home (%)
Residents speaking Spanish at home - Born in the United States (%)
Residents speaking Spanish at home - Native, born elsewhere (%)
Residents speaking Spanish at home - Foreign born (%)
Residents speaking other language at home (%)
Residents speaking other language at home - Born in the United States (%)
Residents speaking other language at home - Native, born elsewhere (%)
Residents speaking other language at home - Foreign born (%)
Marital status - Never married (%)
Marital status - Now married (%)
Marital status - Separated (%)
Marital status - Widowed (%)
Marital status - Divorced (%)
Ancestries Reported - Arab (%)
Ancestries Reported - Czech (%)
Ancestries Reported - Danish (%)
Ancestries Reported - Dutch (%)
Ancestries Reported - English (%)
Ancestries Reported - French (%)
Ancestries Reported - French Canadian (%)
Ancestries Reported - German (%)
Ancestries Reported - Greek (%)
Ancestries Reported - Hungarian (%)
Ancestries Reported - Irish (%)
Ancestries Reported - Italian (%)
Ancestries Reported - Lithuanian (%)
Ancestries Reported - Norwegian (%)
Ancestries Reported - Polish (%)
Ancestries Reported - Portuguese (%)
Ancestries Reported - Russian (%)
Ancestries Reported - Scotch-Irish (%)
Ancestries Reported - Scottish (%)
Ancestries Reported - Slovak (%)
Ancestries Reported - Subsaharan African (%)
Ancestries Reported - Swedish (%)
Ancestries Reported - Swiss (%)
Ancestries Reported - Ukrainian (%)
Ancestries Reported - United States (%)
Ancestries Reported - Welsh (%)
Ancestries Reported - West Indian (%)
Ancestries Reported - Other (%)
Geographical mobility - Same house 1 year ago (%)
Geographical mobility - Same house 1 year ago (%) - White
Geographical mobility - Same house 1 year ago (%) - Black or African American
Geographical mobility - Same house 1 year ago (%) - Asian
Geographical mobility - Same house 1 year ago (%) - Hispanic or Latino
Geographical mobility - Same house 1 year ago (%) - American Indian and Alaska Native
Geographical mobility - Same house 1 year ago (%) - Multirace
Geographical mobility - Same house 1 year ago (%) - Other Race
Geographical mobility - Moved within same county (%)
Geographical mobility - Moved within same county (%) - White
Geographical mobility - Moved within same county (%) - Black or African American
Geographical mobility - Moved within same county (%) - Asian
Geographical mobility - Moved within same county (%) - Hispanic or Latino
Geographical mobility - Moved within same county (%) - American Indian and Alaska Native
Geographical mobility - Moved within same county (%) - Multirace
Geographical mobility - Moved within same county (%) - Other Race
Geographical mobility - Moved from different county within same state (%)
Geographical mobility - Moved from different county within same state (%) - White
Geographical mobility - Moved from different county within same state (%) - Black or African American
Geographical mobility - Moved from different county within same state (%) - Asian
Geographical mobility - Moved from different county within same state (%) - Hispanic or Latino
Geographical mobility - Moved from different county within same state (%) - American Indian and Alaska Native
Geographical mobility - Moved from different county within same state (%) - Multirace
Geographical mobility - Moved from different county within same state (%) - Other Race
Geographical mobility - Moved from different state (%)
Geographical mobility - Moved from different state (%) - White
Geographical mobility - Moved from different state (%) - Black or African American
Geographical mobility - Moved from different state (%) - Asian
Geographical mobility - Moved from different state (%) - Hispanic or Latino
Geographical mobility - Moved from different state (%) - American Indian and Alaska Native
Geographical mobility - Moved from different state (%) - Multirace
Geographical mobility - Moved from different state (%) - Other Race
Geographical mobility - Moved from abroad (%)
Geographical mobility - Moved from abroad (%) - White
Geographical mobility - Moved from abroad (%) - Black or African American
Geographical mobility - Moved from abroad (%) - Asian
Geographical mobility - Moved from abroad (%) - Hispanic or Latino
Geographical mobility - Moved from abroad (%) - American Indian and Alaska Native
Geographical mobility - Moved from abroad (%) - Multirace
Geographical mobility - Moved from abroad (%) - Other Race
Place of birth for the foreign-born population - Ireland (%)
Place of birth for the foreign-born population - Denmark (%)
Place of birth for the foreign-born population - Norway (%)
Place of birth for the foreign-born population - Sweden (%)
Place of birth for the foreign-born population - United Kingdom (%)
Place of birth for the foreign-born population - England (%)
Place of birth for the foreign-born population - Scotland (%)
Place of birth for the foreign-born population - Other Northern Europe (%)
Place of birth for the foreign-born population - Austria (%)
Place of birth for the foreign-born population - Belgium (%)
Place of birth for the foreign-born population - France (%)
Place of birth for the foreign-born population - Germany (%)
Place of birth for the foreign-born population - Netherlands (%)
Place of birth for the foreign-born population - Switzerland (%)
Place of birth for the foreign-born population - Other Western Europe (%)
Place of birth for the foreign-born population - Greece (%)
Place of birth for the foreign-born population - Italy (%)
Place of birth for the foreign-born population - Portugal (%)
Place of birth for the foreign-born population - Spain (%)
Place of birth for the foreign-born population - Other Southern Europe (%)
Place of birth for the foreign-born population - Albania (%)
Place of birth for the foreign-born population - Belarus (%)
Place of birth for the foreign-born population - Bosnia and Herzegovina (%)
Place of birth for the foreign-born population - Bulgaria (%)
Place of birth for the foreign-born population - Croatia (%)
Place of birth for the foreign-born population - Czechoslovakia (%)
Place of birth for the foreign-born population - Hungary (%)
Place of birth for the foreign-born population - Latvia (%)
Place of birth for the foreign-born population - Lithuania (%)
Place of birth for the foreign-born population - North Macedonia (Macedonia) (%)
Place of birth for the foreign-born population - Moldova (%)
Place of birth for the foreign-born population - Poland (%)
Place of birth for the foreign-born population - Romania (%)
Place of birth for the foreign-born population - Russia (%)
Place of birth for the foreign-born population - Serbia (%)
Place of birth for the foreign-born population - Ukraine (%)
Place of birth for the foreign-born population - Other Eastern Europe (%)
Place of birth for the foreign-born population - China (%)
Place of birth for the foreign-born population - Hong Kong (%)
Place of birth for the foreign-born population - Taiwan (%)
Place of birth for the foreign-born population - Japan (%)
Place of birth for the foreign-born population - Korea (%)
Place of birth for the foreign-born population - Other Eastern Asia (%)
Place of birth for the foreign-born population - Afghanistan (%)
Place of birth for the foreign-born population - Bangladesh (%)
Place of birth for the foreign-born population - India (%)
Place of birth for the foreign-born population - Iran (%)
Place of birth for the foreign-born population - Kazakhstan (%)
Place of birth for the foreign-born population - Nepal (%)
Place of birth for the foreign-born population - Pakistan (%)
Place of birth for the foreign-born population - Sri Lanka (%)
Place of birth for the foreign-born population - Uzbekistan (%)
Place of birth for the foreign-born population - Other South Central Asia (%)
Place of birth for the foreign-born population - Burma (%)
Place of birth for the foreign-born population - Cambodia (%)
Place of birth for the foreign-born population - Indonesia (%)
Place of birth for the foreign-born population - Laos (%)
Place of birth for the foreign-born population - Malaysia (%)
Place of birth for the foreign-born population - Philippines (%)
Place of birth for the foreign-born population - Singapore (%)
Place of birth for the foreign-born population - Thailand (%)
Place of birth for the foreign-born population - Vietnam (%)
Place of birth for the foreign-born population - Other South Eastern Asia (%)
Place of birth for the foreign-born population - Armenia (%)
Place of birth for the foreign-born population - Iraq (%)
Place of birth for the foreign-born population - Israel (%)
Place of birth for the foreign-born population - Jordan (%)
Place of birth for the foreign-born population - Kuwait (%)
Place of birth for the foreign-born population - Lebanon (%)
Place of birth for the foreign-born population - Saudi Arabia (%)
Place of birth for the foreign-born population - Syria (%)
Place of birth for the foreign-born population - Turkey (%)
Place of birth for the foreign-born population - Yemen (%)
Place of birth for the foreign-born population - Other Western Asia (%)
Place of birth for the foreign-born population - Eritrea (%)
Place of birth for the foreign-born population - Ethiopia (%)
Place of birth for the foreign-born population - Kenya (%)
Place of birth for the foreign-born population - Somalia (%)
Place of birth for the foreign-born population - Uganda (%)
Place of birth for the foreign-born population - Zimbabwe (%)
Place of birth for the foreign-born population - Other Eastern Africa (%)
Place of birth for the foreign-born population - Cameroon (%)
Place of birth for the foreign-born population - Congo (%)
Place of birth for the foreign-born population - Democratic Republic of Congo (Zaire) (%)
Place of birth for the foreign-born population - Other Middle Africa (%)
Place of birth for the foreign-born population - Egypt (%)
Place of birth for the foreign-born population - Morocco (%)
Place of birth for the foreign-born population - Sudan (%)
Place of birth for the foreign-born population - Other Northern Africa (%)
Place of birth for the foreign-born population - South Africa (%)
Place of birth for the foreign-born population - Other Southern Africa (%)
Place of birth for the foreign-born population - Cabo Verde (%)
Place of birth for the foreign-born population - Ghana (%)
Place of birth for the foreign-born population - Liberia (%)
Place of birth for the foreign-born population - Nigeria (%)
Place of birth for the foreign-born population - Senegal (%)
Place of birth for the foreign-born population - Sierra Leone (%)
Place of birth for the foreign-born population - Other Western Africa (%)
Place of birth for the foreign-born population - Australia (%)
Place of birth for the foreign-born population - New Zealand (%)
Place of birth for the foreign-born population - Fiji (%)
Place of birth for the foreign-born population - Micronesia (%)
Place of birth for the foreign-born population - Bahamas (%)
Place of birth for the foreign-born population - Barbados (%)
Place of birth for the foreign-born population - Cuba (%)
Place of birth for the foreign-born population - Dominica (%)
Place of birth for the foreign-born population - Dominican Republic (%)
Place of birth for the foreign-born population - Grenada (%)
Place of birth for the foreign-born population - Haiti (%)
Place of birth for the foreign-born population - Jamaica (%)
Place of birth for the foreign-born population - St. Vincent and the Grenadines (%)
Place of birth for the foreign-born population - Trinidad and Tobago (%)
Place of birth for the foreign-born population - West Indies (%)
Place of birth for the foreign-born population - Other Caribbean (%)
Place of birth for the foreign-born population - Belize (%)
Place of birth for the foreign-born population - Costa Rica (%)
Place of birth for the foreign-born population - El Salvador (%)
Place of birth for the foreign-born population - Guatemala (%)
Place of birth for the foreign-born population - Honduras (%)
Place of birth for the foreign-born population - Mexico (%)
Place of birth for the foreign-born population - Nicaragua (%)
Place of birth for the foreign-born population - Panama (%)
Place of birth for the foreign-born population - Other Central America (%)
Place of birth for the foreign-born population - Argentina (%)
Place of birth for the foreign-born population - Bolivia (%)
Place of birth for the foreign-born population - Brazil (%)
Place of birth for the foreign-born population - Chile (%)
Place of birth for the foreign-born population - Colombia (%)
Place of birth for the foreign-born population - Ecuador (%)
Place of birth for the foreign-born population - Guyana (%)
Place of birth for the foreign-born population - Peru (%)
Place of birth for the foreign-born population - Uruguay (%)
Place of birth for the foreign-born population - Venezuela (%)
Place of birth for the foreign-born population - Other South America (%)
Place of birth for the foreign-born population - Canada (%)
Place of birth for the foreign-born population - Other Northern America (%)
Place of birth for the foreign-born population - Other (%)
Latest news about races in Billings, MT collected exclusively by city-data.com from local newspapers, TV, and radio stations
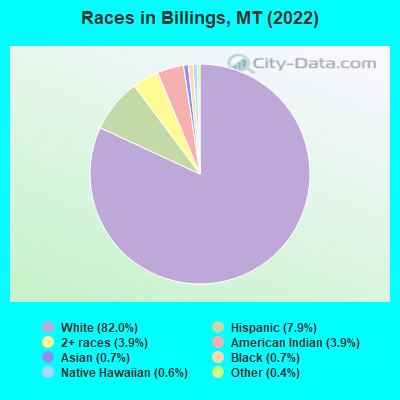
According to 2022 data, the most numerous races in Billings, MT are White alone (98,365 residents), American Indian alone (4,643 residents), and Two or more races (4,668 residents). 94.9% of Billings residents speak English at home. 2.0% of Billings, MT residents are foreign-born (0.7% born in Asia, 0.6% born in Europe, 0.4% born in Latin America, 0.2% born in North America), which is about the same as the foreign-born rate of 2.0% across the entire state of Montana.
Race distribution in Billings
2000 2022
807,823 89.5% White alone 54,426 6.0% American Indian alone 18,081 2.0% Hispanic 13,768 1.5% Two or more races 4,569 0.5% Asian alone 2,534 0.3% Black alone 569 0.06% Other race alone 425 0.05% Native Hawaiian and Other
937,365 83.5% White alone 58,748 5.2% American Indian alone 55,172 4.9% Two or more races 49,830 4.4% Hispanic 9,012 0.8% Other race alone 7,700 0.7% Asian alone 3,428 0.3% Black alone 1,612 0.1% Native Hawaiian and Other
Income and house value in Billings Median household income in 2022 $78,316 White non-Hispanic householders$70,230 American Indian and Alaska Native householders$61,901 Some other race householders$77,115 Two or more races householders$118,264 Hispanic or Latino race householdersMedian 2022 house value $336,628 White Non-Hispanic householders$265,618 Black or African American householders$267,292 American Indian or Alaska Native householders $352,036 Asian householders$376,822 Native Hawaiian and other Pacific Islander householders$243,846 Some other race householders$259,588 Two or more races householders$257,914 Hispanic or Latino householders
Median age by race in Billings
40.4 Median age for White residents38.3 42.7 41.8 Median age for Black or African American residents50.1 -666,666,666.0 26.2 Median age for American Indian / Alaska Native residents25.8 26.5 51.5 Median age for Asian residents51.4 51.6 16.6 Median age for Native Hawaiian / Pacific Islander residents16.1 38.1 35.6 Median age for Other race residents29.8 35.6 28.4 Median age for Two or more races residents27.6 28.7 42.0 Median age for White alone residents39.4 43.8 24.2 Median age for Hispanic or Latino residents25.0 19.3
Owner/renter occupied households by race in Billings
House owners and renters - White residents 31,035 69.2% Owner occupied13,812 30.8% Renter occupiedHouse owners and renters - Black or African American residents 66 24.0% Owner occupied210 76.0% Renter occupiedHouse owners and renters - American Indian / Alaska Native residents 433 21.6% Owner occupied1,570 78.4% Renter occupiedHouse owners and renters - Asian residents 288 56.7% Owner occupied220 43.3% Renter occupiedHouse owners and renters - Native Hawaiian / Pacific Islander residents 38 100.0% Renter occupiedHouse owners and renters - Other race residents 471 79.3% Owner occupied123 20.7% Renter occupiedHouse owners and renters - Two or more races residents 892 41.6% Owner occupied1,252 58.4% Renter occupiedHouse owners and renters - White alone residents 29,950 68.7% Owner occupied13,618 31.3% Renter occupiedHouse owners and renters - Hispanic or Latino residents 1,859 80.8% Owner occupied441 19.2% Renter occupied
Language usage in Billings
English speakers - Total 94.9% of residents of Billings speak English at home.
1.7% of residents speak Spanish at home 1,439 74.8% Speak English very well485 25.2% Speak English less than very well2.6% of residents speak other language at home 2,355 79.8% Speak English very well596 20.2% Speak English less than very well
English speakers - Born in the United States 96.5% of residents of Billings speak English at home.
1.4% of residents speak Spanish at home 524 84.1% Speak English very well99 15.9% Speak English less than very well0.8% of residents speak other language at home 342 91.0% Speak English very well34 9.0% Speak English less than very well
English speakers - Native, born elsewhere 93.6% of residents of Billings speak English at home.
2.9% of residents speak Spanish at home 36 94.7% Speak English very well2 5.3% Speak English less than very well0.7% of residents speak other language at home 9 100.0% Speak English very well
English speakers - Foreign-born 34.1% of residents of Billings speak English at home.
13.6% of residents speak Spanish at home 194 42.6% Speak English very well261 57.4% Speak English less than very well35.4% of residents speak other language at home 841 71.3% Speak English very well339 28.7% Speak English less than very well
White (Caucasian) - Speak only English Native:
98.4% (95,335)Foreign-born:
50.7% (853)
White (Caucasian) - Speak another language Native:
1.6% (1,568)Foreign-born:
49.3% (828)
Black or African American - Speak only English Native:
94.0% (1,035)Foreign-born:
62.6% (9)
Black or African American - Speak another language Native:
6.0% (66)Foreign-born:
36.4% (5)
American Indian / Alaska Native - Speak another language Native:
9.7% (435)Foreign-born:
100.0% (5)
Asian - Speak only English Native:
100.0% (315)Foreign-born:
22.6% (127)
Native Hawaiian / Pacific Islander - Speak only English Native:
3.8% (8)Foreign-born:
96.3% (2)
Other race - Speak another language Native:
16.4% (320)Foreign-born:
94.9% (219)
Two or more races - Speak only English Native:
91.9% (6,551)Foreign-born:
28.2% (117)
Two or more races - Speak another language Native:
8.2% (581)Foreign-born:
62.9% (261)
White alone - Speak only English Native:
98.6% (91,854)Foreign-born:
46.4% (687)
White alone - Speak another language Native:
1.4% (1,282)Foreign-born:
53.6% (795)
Hispanic or Latino - Speak only English Native:
87.4% (6,378)Foreign-born:
24.2% (144)
Hispanic or Latino - Speak another language Native:
12.5% (915)Foreign-born:
76.1% (454)
Foreign-born residents in Billings 2,421 residents are foreign born (0.7% Asia , 0.6% Europe , 0.4% Latin America , 0.2% North America ).
This city:
2.0%Montana:
2.3%
Marital status for residents in Billings Marital status - White (Caucasian) population 15 years and over
Males 34.2% Never married50.7% Now married1.8% Separated1.5% Widowed11.8% DivorcedFemales 25.4% Never married49.5% Now married0.8% Separated10.9% Widowed13.5% DivorcedWomen who gave birth in the past 12 months Now married:
73.7% (1,596)Unmarried:
26.3% (571)
Women who did not give birth in the past 12 months Now married:
44.5% (9,876)Unmarried:
55.5% (12,306)
Marital status - Black or African American population 15 years and over
Males 65.7% Never married19.6% Now married2.6% Separated0.5% Widowed11.6% DivorcedFemales 52.2% Never married34.3% Now married0.0% Separated8.5% Widowed5.0% DivorcedWomen who gave birth in the past 12 months Now married:
0.0% (0)Unmarried:
100.0% (23)
Women who did not give birth in the past 12 months Now married:
50.7% (42)Unmarried:
49.3% (41)
Marital status - American Indian / Alaska Native population 15 years and over
Males 60.4% Never married17.1% Now married2.0% Separated4.1% Widowed16.5% DivorcedFemales 64.3% Never married17.9% Now married1.3% Separated1.1% Widowed15.4% DivorcedWomen who gave birth in the past 12 months Now married:
0.0% (0)Unmarried:
100.0% (66)
Women who did not give birth in the past 12 months Now married:
20.2% (224)Unmarried:
79.8% (882)
Marital status - Asian population 15 years and over
Males 39.3% Never married36.3% Now married0.0% Separated0.0% Widowed24.4% DivorcedFemales 33.0% Never married55.6% Now married0.0% Separated7.8% Widowed3.5% DivorcedWomen who gave birth in the past 12 months Now married:
83.4% (144)Unmarried:
16.6% (29)
Women who did not give birth in the past 12 months Now married:
37.9% (93)Unmarried:
62.1% (152)
Marital status - Native Hawaiian / Pacific Islander population 15 years and over
Males 63.2% Never married35.3% Now married0.0% Separated1.5% Widowed0.0% DivorcedFemales 56.1% Never married43.9% Now married0.0% Separated0.0% Widowed0.0% DivorcedWomen who gave birth in the past 12 months Now married:
0.0% (0)Unmarried:
100.0% (26)
Women who did not give birth in the past 12 months Now married:
0.0% (0)Unmarried:
100.0% (13)
Marital status - Other race population 15 years and over
Males 64.7% Never married26.4% Now married0.0% Separated0.0% Widowed8.8% DivorcedFemales 21.8% Never married38.8% Now married0.0% Separated8.6% Widowed30.8% DivorcedWomen who gave birth in the past 12 months Now married:
100.0% (33)Unmarried:
0.0% (0)
Women who did not give birth in the past 12 months Now married:
27.1% (137)Unmarried:
72.9% (368)
Marital status - Two or more races population 15 years and over
Males 32.0% Never married45.3% Now married0.7% Separated0.0% Widowed21.9% DivorcedFemales 23.1% Never married62.7% Now married0.0% Separated0.0% Widowed14.2% DivorcedWomen who gave birth in the past 12 months Now married:
82.7% (126)Unmarried:
17.3% (26)
Women who did not give birth in the past 12 months Now married:
35.5% (709)Unmarried:
64.5% (1,288)
Marital status - White alone, not Hispanic / Latino population 15 years and over
Males 33.3% Never married51.2% Now married1.8% Separated1.5% Widowed12.1% DivorcedFemales 25.5% Never married49.0% Now married0.8% Separated11.3% Widowed13.5% DivorcedWomen who gave birth in the past 12 months Now married:
65.9% (1,102)Unmarried:
34.1% (571)
Women who did not give birth in the past 12 months Now married:
44.8% (9,634)Unmarried:
55.2% (11,865)
Marital status - Hispanic or Latino population 15 years and over
Males 46.9% Never married40.5% Now married0.5% Separated0.5% Widowed11.5% DivorcedFemales 21.7% Never married62.8% Now married0.0% Separated0.9% Widowed14.7% DivorcedWomen who gave birth in the past 12 months Now married:
100.0% (624)Unmarried:
0.0% (0)
Women who did not give birth in the past 12 months Now married:
48.4% (650)Unmarried:
51.6% (694)
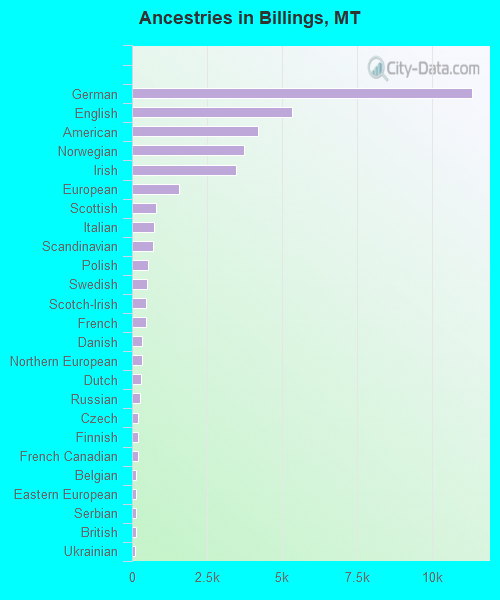
Ancestries in Billings
11,349 22.4% German5,339 10.5% English4,221 8.3% American3,735 7.4% Norwegian3,471 6.9% Irish1,572 3.1% European791 1.6% Scottish725 1.4% Italian697 1.4% Scandinavian549 1.1% Polish485 1.0% Swedish479 0.9% Scotch-Irish476 0.9% French344 0.7% Danish324 0.6% Northern European308 0.6% Dutch279 0.6% Russian207 0.4% Czech202 0.4% Finnish194 0.4% French Canadian143 0.3% Belgian137 0.3% Eastern European127 0.3% Serbian122 0.2% British106 0.2% Ukrainian104 0.2% Yugoslavian98 0.2% Welsh94 0.2% Canadian65 0.1% Slovak56 0.1% African54 0.1% Swiss52 0.1% Greek38 0.08% Portuguese35 0.07% Arab27 0.05% Iranian25 0.05% Lithuanian25 0.05% Austrian23 0.05% Romanian22 0.04% Czechoslovakian21 0.04% Jamaican19 0.04% Luxembourger19 0.04% Bulgarian19 0.04% Australian18 0.04% Brazilian17 0.03% Hungarian9 0.02% Ethiopian7 0.01% Basque5 0.01% Slavic4 0.01% Latvian3 0.01% Albanian
Geographical mobility in Billings Same house 1 year ago 85,294 83.6% White (Caucasian)985 85.3% Black or African American2,841 57.0% American Indian / Alaska Native895 84.0% Asian103 46.4% Native Hawaiian / Pacific Islander2,268 97.4% Other race6,331 80.2% Two or more races81,146 83.2% White alone, not Hispanic / Latino7,487 83.3% Hispanic or LatinoMoved within same county 8,267 8.1% White / Caucasian80 6.9% Black or African American448 9.0% American Indian / Alaska Native13 1.3% Asian10 4.5% Native Hawaiian / Pacific Islander51 2.2% Other race757 9.6% Two or more races8,136 8.3% White alone, not Hispanic / Latino743 8.3% Hispanic or LatinoMoved within same state 2,457 2.4% White / Caucasian49 4.2% Black or African American1,165 23.4% American Indian / Alaska Native93 8.8% Asian26 1.1% Other race265 3.4% Two or more races2,448 2.5% White alone, not Hispanic / Latino129 1.4% Hispanic or LatinoMoved from different state 5,706 5.6% White / Caucasian40 3.5% Black or African American481 9.7% American Indian / Alaska Native42 3.9% Asian20 0.9% Other race473 6.0% Two or more races5,568 5.7% White alone, not Hispanic / Latino602 6.7% Hispanic or LatinoMoved from abroad 248 0.2% White2 0.2% Black or African American47 0.9% American Indian / Alaska Native31 2.9% Asian77 34.8% Native Hawaiian / Pacific Islander17 0.7% Other race6 0.1% Two or more races248 0.3% White alone, not Hispanic / Latino32 0.4% Hispanic or Latino
Children Nativity (place of birth) in Billings
Children under 6 years - Living with two parents Both parents native 5,077 100.0% NativeOne native, one foreign-born parent 575 100.0% NativeChildren under 6 years - Living with one parent Native parent 2,152 100.0% NativeForeign-born parent 177 100.0% NativeChildren 6 to 17 years - Living with two parents Both parents native 10,966 99.7% Native28 0.3% Foreign-bornBoth parents foreign-born 162 76.3% Native51 23.7% Foreign-bornOne native, one foreign-born parent 704 99.3% Native5 0.7% Foreign-bornChildren 6 to 17 years - Living with one parent Native parent 5,419 100.0% NativeForeign-born parent 179 48.8% Native188 51.2% Foreign-born
Grandparents responsible for own grandchildren in Billings
Grandparents (30 to 59 years) White / Caucasian 186 28.6% Responsible for grandchildren464 71.4% Not responsible for grandchildrenAsian 25 100.0% Responsible for grandchildrenNative Hawaiian / Pacific Islander 61 100.0% Responsible for grandchildrenOther race 8 49.9% Responsible for grandchildren8 50.1% Not responsible for grandchildrenTwo or more races 20 100.0% Responsible for grandchildrenWhite alone, not Hispanic / Latino 174 27.0% Responsible for grandchildren470 73.0% Not responsible for grandchildrenHispanic or Latino 45 87.2% Responsible for grandchildren7 12.8% Not responsible for grandchildrenGrandparents (60 years and over) White / Caucasian 259 34.3% Responsible for grandchildren496 65.7% Not responsible for grandchildrenOther race 70 100.0% Responsible for grandchildrenTwo or more races 72 76.5% Responsible for grandchildren22 23.5% Not responsible for grandchildrenWhite alone, not Hispanic / Latino 263 34.7% Responsible for grandchildren493 65.3% Not responsible for grandchildrenHispanic or Latino 93 84.4% Responsible for grandchildren17 15.6% Not responsible for grandchildren