Races in Bethel Park, Pennsylvania (PA) Detailed Stats
Data:
Races - White alone (%)
Races - White alone (% change since 2000)
Races - Black alone (%)
Races - Black alone (% change since 2000)
Races - American Indian alone (%)
Races - American Indian alone (% change since 2000)
Races - Asian alone (%)
Races - Asian alone (% change since 2000)
Races - Hispanic (%)
Races - Hispanic (% change since 2000)
Races - Native Hawaiian and Other Pacific Islander alone (%)
Races - Native Hawaiian and Other Pacific Islander alone (% change since 2000)
Races - Two or more races(%)
Races - Two or more races(% change since 2000)
Races - Other race alone (%)
Races - Other race alone (% change since 2000)
Racial diversity
Place of birth - Born in state of residence (%)
Place of birth - Born in state of residence (%) - White
Place of birth - Born in state of residence (%) - Black or African American
Place of birth - Born in state of residence (%) - Asian
Place of birth - Born in state of residence (%) - Hispanic or Latino
Place of birth - Born in state of residence (%) - American Indian and Alaska Native
Place of birth - Born in state of residence (%) - Multirace
Place of birth - Born in state of residence (%) - Other Race
Place of birth - Born in other state (%)
Place of birth - Born in other state (%) - White
Place of birth - Born in other state (%) - Black or African American
Place of birth - Born in other state (%) - Asian
Place of birth - Born in other state (%) - Hispanic or Latino
Place of birth - Born in other state (%) - American Indian and Alaska Native
Place of birth - Born in other state (%) - Multirace
Place of birth - Born in other state (%) - Other Race
Place of birth - Native, outside of US (%)
Place of birth - Native, outside of US (%) - White
Place of birth - Native, outside of US (%) - Black or African American
Place of birth - Native, outside of US (%) - Asian
Place of birth - Native, outside of US (%) - Hispanic or Latino
Place of birth - Native, outside of US (%) - American Indian and Alaska Native
Place of birth - Native, outside of US (%) - Multirace
Place of birth - Native, outside of US (%) - Other Race
Place of birth - Foreign born (%)
Place of birth - Foreign born (%) - White
Place of birth - Foreign born (%) - Black or African American
Place of birth - Foreign born (%) - Asian
Place of birth - Foreign born (%) - Hispanic or Latino
Place of birth - Foreign born (%) - American Indian and Alaska Native
Place of birth - Foreign born (%) - Multirace
Place of birth - Foreign born (%) - Other Race
Residents speaking English at home (%)
Residents speaking English at home - Born in the United States (%)
Residents speaking English at home - Native, born elsewhere (%)
Residents speaking English at home - Foreign born (%)
Residents speaking Spanish at home (%)
Residents speaking Spanish at home - Born in the United States (%)
Residents speaking Spanish at home - Native, born elsewhere (%)
Residents speaking Spanish at home - Foreign born (%)
Residents speaking other language at home (%)
Residents speaking other language at home - Born in the United States (%)
Residents speaking other language at home - Native, born elsewhere (%)
Residents speaking other language at home - Foreign born (%)
Marital status - Never married (%)
Marital status - Now married (%)
Marital status - Separated (%)
Marital status - Widowed (%)
Marital status - Divorced (%)
Ancestries Reported - Arab (%)
Ancestries Reported - Czech (%)
Ancestries Reported - Danish (%)
Ancestries Reported - Dutch (%)
Ancestries Reported - English (%)
Ancestries Reported - French (%)
Ancestries Reported - French Canadian (%)
Ancestries Reported - German (%)
Ancestries Reported - Greek (%)
Ancestries Reported - Hungarian (%)
Ancestries Reported - Irish (%)
Ancestries Reported - Italian (%)
Ancestries Reported - Lithuanian (%)
Ancestries Reported - Norwegian (%)
Ancestries Reported - Polish (%)
Ancestries Reported - Portuguese (%)
Ancestries Reported - Russian (%)
Ancestries Reported - Scotch-Irish (%)
Ancestries Reported - Scottish (%)
Ancestries Reported - Slovak (%)
Ancestries Reported - Subsaharan African (%)
Ancestries Reported - Swedish (%)
Ancestries Reported - Swiss (%)
Ancestries Reported - Ukrainian (%)
Ancestries Reported - United States (%)
Ancestries Reported - Welsh (%)
Ancestries Reported - West Indian (%)
Ancestries Reported - Other (%)
Geographical mobility - Same house 1 year ago (%)
Geographical mobility - Same house 1 year ago (%) - White
Geographical mobility - Same house 1 year ago (%) - Black or African American
Geographical mobility - Same house 1 year ago (%) - Asian
Geographical mobility - Same house 1 year ago (%) - Hispanic or Latino
Geographical mobility - Same house 1 year ago (%) - American Indian and Alaska Native
Geographical mobility - Same house 1 year ago (%) - Multirace
Geographical mobility - Same house 1 year ago (%) - Other Race
Geographical mobility - Moved within same county (%)
Geographical mobility - Moved within same county (%) - White
Geographical mobility - Moved within same county (%) - Black or African American
Geographical mobility - Moved within same county (%) - Asian
Geographical mobility - Moved within same county (%) - Hispanic or Latino
Geographical mobility - Moved within same county (%) - American Indian and Alaska Native
Geographical mobility - Moved within same county (%) - Multirace
Geographical mobility - Moved within same county (%) - Other Race
Geographical mobility - Moved from different county within same state (%)
Geographical mobility - Moved from different county within same state (%) - White
Geographical mobility - Moved from different county within same state (%) - Black or African American
Geographical mobility - Moved from different county within same state (%) - Asian
Geographical mobility - Moved from different county within same state (%) - Hispanic or Latino
Geographical mobility - Moved from different county within same state (%) - American Indian and Alaska Native
Geographical mobility - Moved from different county within same state (%) - Multirace
Geographical mobility - Moved from different county within same state (%) - Other Race
Geographical mobility - Moved from different state (%)
Geographical mobility - Moved from different state (%) - White
Geographical mobility - Moved from different state (%) - Black or African American
Geographical mobility - Moved from different state (%) - Asian
Geographical mobility - Moved from different state (%) - Hispanic or Latino
Geographical mobility - Moved from different state (%) - American Indian and Alaska Native
Geographical mobility - Moved from different state (%) - Multirace
Geographical mobility - Moved from different state (%) - Other Race
Geographical mobility - Moved from abroad (%)
Geographical mobility - Moved from abroad (%) - White
Geographical mobility - Moved from abroad (%) - Black or African American
Geographical mobility - Moved from abroad (%) - Asian
Geographical mobility - Moved from abroad (%) - Hispanic or Latino
Geographical mobility - Moved from abroad (%) - American Indian and Alaska Native
Geographical mobility - Moved from abroad (%) - Multirace
Geographical mobility - Moved from abroad (%) - Other Race
Place of birth for the foreign-born population - Ireland (%)
Place of birth for the foreign-born population - Denmark (%)
Place of birth for the foreign-born population - Norway (%)
Place of birth for the foreign-born population - Sweden (%)
Place of birth for the foreign-born population - United Kingdom (%)
Place of birth for the foreign-born population - England (%)
Place of birth for the foreign-born population - Scotland (%)
Place of birth for the foreign-born population - Other Northern Europe (%)
Place of birth for the foreign-born population - Austria (%)
Place of birth for the foreign-born population - Belgium (%)
Place of birth for the foreign-born population - France (%)
Place of birth for the foreign-born population - Germany (%)
Place of birth for the foreign-born population - Netherlands (%)
Place of birth for the foreign-born population - Switzerland (%)
Place of birth for the foreign-born population - Other Western Europe (%)
Place of birth for the foreign-born population - Greece (%)
Place of birth for the foreign-born population - Italy (%)
Place of birth for the foreign-born population - Portugal (%)
Place of birth for the foreign-born population - Spain (%)
Place of birth for the foreign-born population - Other Southern Europe (%)
Place of birth for the foreign-born population - Albania (%)
Place of birth for the foreign-born population - Belarus (%)
Place of birth for the foreign-born population - Bosnia and Herzegovina (%)
Place of birth for the foreign-born population - Bulgaria (%)
Place of birth for the foreign-born population - Croatia (%)
Place of birth for the foreign-born population - Czechoslovakia (%)
Place of birth for the foreign-born population - Hungary (%)
Place of birth for the foreign-born population - Latvia (%)
Place of birth for the foreign-born population - Lithuania (%)
Place of birth for the foreign-born population - North Macedonia (Macedonia) (%)
Place of birth for the foreign-born population - Moldova (%)
Place of birth for the foreign-born population - Poland (%)
Place of birth for the foreign-born population - Romania (%)
Place of birth for the foreign-born population - Russia (%)
Place of birth for the foreign-born population - Serbia (%)
Place of birth for the foreign-born population - Ukraine (%)
Place of birth for the foreign-born population - Other Eastern Europe (%)
Place of birth for the foreign-born population - China (%)
Place of birth for the foreign-born population - Hong Kong (%)
Place of birth for the foreign-born population - Taiwan (%)
Place of birth for the foreign-born population - Japan (%)
Place of birth for the foreign-born population - Korea (%)
Place of birth for the foreign-born population - Other Eastern Asia (%)
Place of birth for the foreign-born population - Afghanistan (%)
Place of birth for the foreign-born population - Bangladesh (%)
Place of birth for the foreign-born population - India (%)
Place of birth for the foreign-born population - Iran (%)
Place of birth for the foreign-born population - Kazakhstan (%)
Place of birth for the foreign-born population - Nepal (%)
Place of birth for the foreign-born population - Pakistan (%)
Place of birth for the foreign-born population - Sri Lanka (%)
Place of birth for the foreign-born population - Uzbekistan (%)
Place of birth for the foreign-born population - Other South Central Asia (%)
Place of birth for the foreign-born population - Burma (%)
Place of birth for the foreign-born population - Cambodia (%)
Place of birth for the foreign-born population - Indonesia (%)
Place of birth for the foreign-born population - Laos (%)
Place of birth for the foreign-born population - Malaysia (%)
Place of birth for the foreign-born population - Philippines (%)
Place of birth for the foreign-born population - Singapore (%)
Place of birth for the foreign-born population - Thailand (%)
Place of birth for the foreign-born population - Vietnam (%)
Place of birth for the foreign-born population - Other South Eastern Asia (%)
Place of birth for the foreign-born population - Armenia (%)
Place of birth for the foreign-born population - Iraq (%)
Place of birth for the foreign-born population - Israel (%)
Place of birth for the foreign-born population - Jordan (%)
Place of birth for the foreign-born population - Kuwait (%)
Place of birth for the foreign-born population - Lebanon (%)
Place of birth for the foreign-born population - Saudi Arabia (%)
Place of birth for the foreign-born population - Syria (%)
Place of birth for the foreign-born population - Turkey (%)
Place of birth for the foreign-born population - Yemen (%)
Place of birth for the foreign-born population - Other Western Asia (%)
Place of birth for the foreign-born population - Eritrea (%)
Place of birth for the foreign-born population - Ethiopia (%)
Place of birth for the foreign-born population - Kenya (%)
Place of birth for the foreign-born population - Somalia (%)
Place of birth for the foreign-born population - Uganda (%)
Place of birth for the foreign-born population - Zimbabwe (%)
Place of birth for the foreign-born population - Other Eastern Africa (%)
Place of birth for the foreign-born population - Cameroon (%)
Place of birth for the foreign-born population - Congo (%)
Place of birth for the foreign-born population - Democratic Republic of Congo (Zaire) (%)
Place of birth for the foreign-born population - Other Middle Africa (%)
Place of birth for the foreign-born population - Egypt (%)
Place of birth for the foreign-born population - Morocco (%)
Place of birth for the foreign-born population - Sudan (%)
Place of birth for the foreign-born population - Other Northern Africa (%)
Place of birth for the foreign-born population - South Africa (%)
Place of birth for the foreign-born population - Other Southern Africa (%)
Place of birth for the foreign-born population - Cabo Verde (%)
Place of birth for the foreign-born population - Ghana (%)
Place of birth for the foreign-born population - Liberia (%)
Place of birth for the foreign-born population - Nigeria (%)
Place of birth for the foreign-born population - Senegal (%)
Place of birth for the foreign-born population - Sierra Leone (%)
Place of birth for the foreign-born population - Other Western Africa (%)
Place of birth for the foreign-born population - Australia (%)
Place of birth for the foreign-born population - New Zealand (%)
Place of birth for the foreign-born population - Fiji (%)
Place of birth for the foreign-born population - Micronesia (%)
Place of birth for the foreign-born population - Bahamas (%)
Place of birth for the foreign-born population - Barbados (%)
Place of birth for the foreign-born population - Cuba (%)
Place of birth for the foreign-born population - Dominica (%)
Place of birth for the foreign-born population - Dominican Republic (%)
Place of birth for the foreign-born population - Grenada (%)
Place of birth for the foreign-born population - Haiti (%)
Place of birth for the foreign-born population - Jamaica (%)
Place of birth for the foreign-born population - St. Vincent and the Grenadines (%)
Place of birth for the foreign-born population - Trinidad and Tobago (%)
Place of birth for the foreign-born population - West Indies (%)
Place of birth for the foreign-born population - Other Caribbean (%)
Place of birth for the foreign-born population - Belize (%)
Place of birth for the foreign-born population - Costa Rica (%)
Place of birth for the foreign-born population - El Salvador (%)
Place of birth for the foreign-born population - Guatemala (%)
Place of birth for the foreign-born population - Honduras (%)
Place of birth for the foreign-born population - Mexico (%)
Place of birth for the foreign-born population - Nicaragua (%)
Place of birth for the foreign-born population - Panama (%)
Place of birth for the foreign-born population - Other Central America (%)
Place of birth for the foreign-born population - Argentina (%)
Place of birth for the foreign-born population - Bolivia (%)
Place of birth for the foreign-born population - Brazil (%)
Place of birth for the foreign-born population - Chile (%)
Place of birth for the foreign-born population - Colombia (%)
Place of birth for the foreign-born population - Ecuador (%)
Place of birth for the foreign-born population - Guyana (%)
Place of birth for the foreign-born population - Peru (%)
Place of birth for the foreign-born population - Uruguay (%)
Place of birth for the foreign-born population - Venezuela (%)
Place of birth for the foreign-born population - Other South America (%)
Place of birth for the foreign-born population - Canada (%)
Place of birth for the foreign-born population - Other Northern America (%)
Place of birth for the foreign-born population - Other (%)
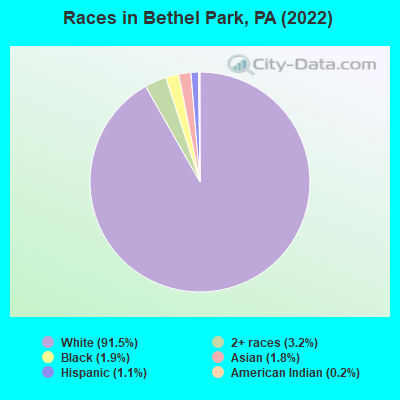
According to 2022 data, the most numerous races in Bethel Park, PA are White alone (30,152 residents), Black alone (632 residents), and Hispanic (365 residents). 93.9% of Bethel Park residents speak English at home. 4.1% of Bethel Park, PA residents are foreign-born (1.8% born in Asia, 1.4% born in Europe), which is 69.4% less than the foreign-born rate of 7.0% across the entire state of Pennsylvania.
Race distribution in Bethel Park
2000 2022
10,322,455 84.1% White alone 1,202,437 9.8% Black alone 394,088 3.2% Hispanic 218,296 1.8% Asian alone 113,097 0.9% Two or more races 13,086 0.1% Other race alone 14,904 0.1% American Indian alone 2,691 0.02% Native Hawaiian and Other
9,487,228 73.1% White alone 1,311,581 10.1% Black alone 1,115,997 8.6% Hispanic 493,942 3.8% Two or more races 487,124 3.8% Asian alone 63,582 0.5% Other race alone 10,130 0.08% American Indian alone 2,424 0.02% Native Hawaiian and Other
Income and house value in Bethel Park Median household income in 2022 $101,693 White non-Hispanic householders$78,302 Black householders$110,573 Asian householders$50,668 Two or more races householders$105,487 Hispanic or Latino race householdersMedian 2022 house value $271,864 White Non-Hispanic householders$112,906 Black or African American householders$262,981 American Indian or Alaska Native householders $354,616 Asian householders$267,890 Two or more races householders$266,254 Hispanic or Latino householders
Median age by race in Bethel Park
49.0 Median age for White residents49.0 49.1 30.9 Median age for Black or African American residents30.2 40.0 70.8 Median age for American Indian / Alaska Native residents-714,583,332.6 -577,519,379.3 38.1 Median age for Asian residents38.1 38.6 -656,534,953.8 Median age for Native Hawaiian / Pacific Islander residents-919,148,935.3 -747,474,746.7 49.1 Median age for Other race residents42.2 -681,623,930.9 16.3 Median age for Two or more races residents18.5 15.1 49.0 Median age for White alone residents49.0 48.9 51.0 Median age for Hispanic or Latino residents34.0 56.3
Owner/renter occupied households by race in Bethel Park
House owners and renters - White residents 11,035 80.1% Owner occupied2,749 19.9% Renter occupiedHouse owners and renters - Black or African American residents 79 30.4% Owner occupied180 69.6% Renter occupiedHouse owners and renters - American Indian / Alaska Native residents 64 100.0% Owner occupiedHouse owners and renters - Asian residents 98 45.6% Owner occupied116 54.4% Renter occupiedHouse owners and renters - Other race residents 20 50.0% Owner occupied20 50.0% Renter occupiedHouse owners and renters - Two or more races residents 109 56.9% Owner occupied82 43.1% Renter occupiedHouse owners and renters - White alone residents 10,964 80.3% Owner occupied2,685 19.7% Renter occupiedHouse owners and renters - Hispanic or Latino residents 115 49.4% Owner occupied118 50.6% Renter occupied
Language usage in Bethel Park
English speakers - Total 93.9% of residents of Bethel Park speak English at home.
0.9% of residents speak Spanish at home 252 87.8% Speak English very well35 12.2% Speak English less than very well5.1% of residents speak other language at home 1,145 72.1% Speak English very well443 27.9% Speak English less than very well
English speakers - Born in the United States 97.0% of residents of Bethel Park speak English at home.
0.2% of residents speak Spanish at home 10 100.0% Speak English very well1.8% of residents speak other language at home 95 100.0% Speak English very well
English speakers - Native, born elsewhere 64.1% of residents of Bethel Park speak English at home.
31.7% of residents speak Spanish at home 41 50.0% Speak English very well41 50.0% Speak English less than very well
English speakers - Foreign-born 21.7% of residents of Bethel Park speak English at home.
4.0% of residents speak Spanish at home 49 100.0% Speak English very well72.9% of residents speak other language at home 539 61.0% Speak English very well345 39.0% Speak English less than very well
White (Caucasian) - Speak only English Native:
97.6% (27,437)Foreign-born:
26.1% (161)
White (Caucasian) - Speak another language Native:
2.4% (665)Foreign-born:
73.1% (452)
Black or African American - Speak another language Native:
6.5% (34)Foreign-born:
80.0% (73)
Asian - Speak only English Native:
60.2% (111)Foreign-born:
21.6% (84)
Asian - Speak another language Native:
17.3% (32)Foreign-born:
78.3% (306)
Other race - Speak another language Native:
97.1% (63)Foreign-born:
100.0% (21)
Two or more races - Speak only English Native:
95.0% (960)Foreign-born:
68.2% (15)
White alone - Speak only English Native:
97.8% (27,422)Foreign-born:
21.1% (126)
White alone - Speak another language Native:
2.2% (631)Foreign-born:
79.1% (472)
Hispanic or Latino - Speak only English Native:
37.9% (94)Foreign-born:
33.0% (38)
Hispanic or Latino - Speak another language Native:
67.6% (168)Foreign-born:
58.2% (67)
Foreign-born residents in Bethel Park 1,362 residents are foreign born (1.8% Asia , 1.4% Europe ).
This city:
4.1%Pennsylvania:
7.3%
Marital status for residents in Bethel Park Marital status - White (Caucasian) population 15 years and over
Males 28.6% Never married59.3% Now married1.7% Separated3.9% Widowed6.4% DivorcedFemales 20.4% Never married56.6% Now married1.0% Separated11.7% Widowed10.3% DivorcedWomen who gave birth in the past 12 months Now married:
100.0% (243)Unmarried:
0.0% (0)
Women who did not give birth in the past 12 months Now married:
55.0% (3,072)Unmarried:
45.0% (2,511)
Marital status - Black or African American population 15 years and over
Males 37.9% Never married48.3% Now married0.0% Separated0.0% Widowed13.8% DivorcedFemales 43.9% Never married23.4% Now married13.4% Separated4.4% Widowed15.0% DivorcedWomen who did not give birth in the past 12 months Now married:
33.1% (76)Unmarried:
66.9% (155)
Marital status - American Indian / Alaska Native population 15 years and over
Males 0.0% Never married100.0% Now married0.0% Separated0.0% Widowed0.0% DivorcedFemales 75.0% Never married25.0% Now married0.0% Separated0.0% Widowed0.0% DivorcedWomen who did not give birth in the past 12 months Now married:
25.0% (2)Unmarried:
75.0% (5)
Marital status - Asian population 15 years and over
Males 36.7% Never married63.3% Now married0.0% Separated0.0% Widowed0.0% DivorcedFemales 37.5% Never married58.3% Now married4.2% Separated0.0% Widowed0.0% DivorcedWomen who did not give birth in the past 12 months Now married:
49.3% (110)Unmarried:
50.7% (113)
Marital status - Other race population 15 years and over
Males 40.0% Never married60.0% Now married0.0% Separated0.0% Widowed0.0% DivorcedFemales 0.0% Never married61.4% Now married0.0% Separated0.0% Widowed38.6% DivorcedWomen who did not give birth in the past 12 months Now married:
100.0% (34)Unmarried:
0.0% (0)
Marital status - Two or more races population 15 years and over
Males 52.8% Never married45.0% Now married0.0% Separated0.4% Widowed1.7% DivorcedFemales 21.0% Never married42.0% Now married19.1% Separated0.0% Widowed17.8% DivorcedWomen who did not give birth in the past 12 months Now married:
54.8% (101)Unmarried:
45.2% (83)
Marital status - White alone, not Hispanic / Latino population 15 years and over
Males 28.5% Never married59.5% Now married1.8% Separated3.9% Widowed6.3% DivorcedFemales 20.4% Never married56.8% Now married1.0% Separated11.7% Widowed10.1% DivorcedWomen who gave birth in the past 12 months Now married:
100.0% (244)Unmarried:
0.0% (0)
Women who did not give birth in the past 12 months Now married:
54.8% (3,056)Unmarried:
45.2% (2,519)
Marital status - Hispanic or Latino population 15 years and over
Males 41.5% Never married42.3% Now married0.0% Separated0.0% Widowed16.3% DivorcedFemales 11.7% Never married49.2% Now married0.0% Separated9.6% Widowed29.4% DivorcedWomen who did not give birth in the past 12 months Now married:
96.1% (79)Unmarried:
3.9% (3)
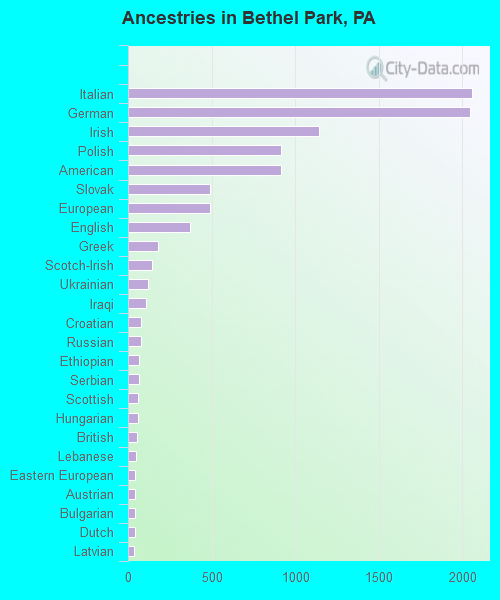
Ancestries in Bethel Park
2,057 18.3% Italian2,046 18.2% German1,144 10.2% Irish917 8.1% Polish914 8.1% American491 4.4% Slovak488 4.3% European368 3.3% English180 1.6% Greek141 1.3% Scotch-Irish122 1.1% Ukrainian107 0.9% Iraqi75 0.7% Croatian75 0.7% Russian65 0.6% Ethiopian63 0.6% Serbian61 0.5% Scottish59 0.5% Hungarian53 0.5% British46 0.4% Lebanese44 0.4% Eastern European43 0.4% Austrian42 0.4% Bulgarian39 0.3% Dutch37 0.3% Latvian37 0.3% Swedish30 0.3% Slovene30 0.3% French Canadian25 0.2% Romanian23 0.2% Czech20 0.2% Czechoslovakian20 0.2% Danish16 0.1% Carpatho Rusyn16 0.1% Turkish14 0.1% Canadian9 0.08% Finnish8 0.07% French5 0.04% Belgian5 0.04% Welsh3 0.03% Israeli3 0.03% Northern European
Children Nativity (place of birth) in Bethel Park
Children under 6 years - Living with two parents Both parents native 1,762 100.0% NativeBoth parents foreign-born 35 100.0% NativeOne native, one foreign-born parent 15 100.0% NativeChildren under 6 years - Living with one parent Native parent 109 100.0% NativeChildren 6 to 17 years - Living with two parents Both parents native 3,216 99.6% Native12 0.4% Foreign-bornBoth parents foreign-born 128 84.9% Native23 15.1% Foreign-bornOne native, one foreign-born parent 52 100.0% NativeChildren 6 to 17 years - Living with one parent Native parent 665 100.0% NativeForeign-born parent 28 58.3% Native20 41.7% Foreign-born
Grandparents responsible for own grandchildren in Bethel Park
Grandparents (30 to 59 years) White / Caucasian 9 100.0% Responsible for grandchildrenWhite alone, not Hispanic / Latino 9 100.0% Responsible for grandchildrenGrandparents (60 years and over) White / Caucasian 43 25.6% Responsible for grandchildren124 74.4% Not responsible for grandchildrenWhite alone, not Hispanic / Latino 43 25.5% Responsible for grandchildren126 74.5% Not responsible for grandchildren