Races in Bethel, Connecticut (CT) Detailed Stats
Data:
Races - White alone (%)
Races - White alone (% change since 2000)
Races - Black alone (%)
Races - Black alone (% change since 2000)
Races - American Indian alone (%)
Races - American Indian alone (% change since 2000)
Races - Asian alone (%)
Races - Asian alone (% change since 2000)
Races - Hispanic (%)
Races - Hispanic (% change since 2000)
Races - Native Hawaiian and Other Pacific Islander alone (%)
Races - Native Hawaiian and Other Pacific Islander alone (% change since 2000)
Races - Two or more races(%)
Races - Two or more races(% change since 2000)
Races - Other race alone (%)
Races - Other race alone (% change since 2000)
Racial diversity
Place of birth - Born in state of residence (%)
Place of birth - Born in state of residence (%) - White
Place of birth - Born in state of residence (%) - Black or African American
Place of birth - Born in state of residence (%) - Asian
Place of birth - Born in state of residence (%) - Hispanic or Latino
Place of birth - Born in state of residence (%) - American Indian and Alaska Native
Place of birth - Born in state of residence (%) - Multirace
Place of birth - Born in state of residence (%) - Other Race
Place of birth - Born in other state (%)
Place of birth - Born in other state (%) - White
Place of birth - Born in other state (%) - Black or African American
Place of birth - Born in other state (%) - Asian
Place of birth - Born in other state (%) - Hispanic or Latino
Place of birth - Born in other state (%) - American Indian and Alaska Native
Place of birth - Born in other state (%) - Multirace
Place of birth - Born in other state (%) - Other Race
Place of birth - Native, outside of US (%)
Place of birth - Native, outside of US (%) - White
Place of birth - Native, outside of US (%) - Black or African American
Place of birth - Native, outside of US (%) - Asian
Place of birth - Native, outside of US (%) - Hispanic or Latino
Place of birth - Native, outside of US (%) - American Indian and Alaska Native
Place of birth - Native, outside of US (%) - Multirace
Place of birth - Native, outside of US (%) - Other Race
Place of birth - Foreign born (%)
Place of birth - Foreign born (%) - White
Place of birth - Foreign born (%) - Black or African American
Place of birth - Foreign born (%) - Asian
Place of birth - Foreign born (%) - Hispanic or Latino
Place of birth - Foreign born (%) - American Indian and Alaska Native
Place of birth - Foreign born (%) - Multirace
Place of birth - Foreign born (%) - Other Race
Residents speaking English at home (%)
Residents speaking English at home - Born in the United States (%)
Residents speaking English at home - Native, born elsewhere (%)
Residents speaking English at home - Foreign born (%)
Residents speaking Spanish at home (%)
Residents speaking Spanish at home - Born in the United States (%)
Residents speaking Spanish at home - Native, born elsewhere (%)
Residents speaking Spanish at home - Foreign born (%)
Residents speaking other language at home (%)
Residents speaking other language at home - Born in the United States (%)
Residents speaking other language at home - Native, born elsewhere (%)
Residents speaking other language at home - Foreign born (%)
Marital status - Never married (%)
Marital status - Now married (%)
Marital status - Separated (%)
Marital status - Widowed (%)
Marital status - Divorced (%)
Ancestries Reported - Arab (%)
Ancestries Reported - Czech (%)
Ancestries Reported - Danish (%)
Ancestries Reported - Dutch (%)
Ancestries Reported - English (%)
Ancestries Reported - French (%)
Ancestries Reported - French Canadian (%)
Ancestries Reported - German (%)
Ancestries Reported - Greek (%)
Ancestries Reported - Hungarian (%)
Ancestries Reported - Irish (%)
Ancestries Reported - Italian (%)
Ancestries Reported - Lithuanian (%)
Ancestries Reported - Norwegian (%)
Ancestries Reported - Polish (%)
Ancestries Reported - Portuguese (%)
Ancestries Reported - Russian (%)
Ancestries Reported - Scotch-Irish (%)
Ancestries Reported - Scottish (%)
Ancestries Reported - Slovak (%)
Ancestries Reported - Subsaharan African (%)
Ancestries Reported - Swedish (%)
Ancestries Reported - Swiss (%)
Ancestries Reported - Ukrainian (%)
Ancestries Reported - United States (%)
Ancestries Reported - Welsh (%)
Ancestries Reported - West Indian (%)
Ancestries Reported - Other (%)
Geographical mobility - Same house 1 year ago (%)
Geographical mobility - Same house 1 year ago (%) - White
Geographical mobility - Same house 1 year ago (%) - Black or African American
Geographical mobility - Same house 1 year ago (%) - Asian
Geographical mobility - Same house 1 year ago (%) - Hispanic or Latino
Geographical mobility - Same house 1 year ago (%) - American Indian and Alaska Native
Geographical mobility - Same house 1 year ago (%) - Multirace
Geographical mobility - Same house 1 year ago (%) - Other Race
Geographical mobility - Moved within same county (%)
Geographical mobility - Moved within same county (%) - White
Geographical mobility - Moved within same county (%) - Black or African American
Geographical mobility - Moved within same county (%) - Asian
Geographical mobility - Moved within same county (%) - Hispanic or Latino
Geographical mobility - Moved within same county (%) - American Indian and Alaska Native
Geographical mobility - Moved within same county (%) - Multirace
Geographical mobility - Moved within same county (%) - Other Race
Geographical mobility - Moved from different county within same state (%)
Geographical mobility - Moved from different county within same state (%) - White
Geographical mobility - Moved from different county within same state (%) - Black or African American
Geographical mobility - Moved from different county within same state (%) - Asian
Geographical mobility - Moved from different county within same state (%) - Hispanic or Latino
Geographical mobility - Moved from different county within same state (%) - American Indian and Alaska Native
Geographical mobility - Moved from different county within same state (%) - Multirace
Geographical mobility - Moved from different county within same state (%) - Other Race
Geographical mobility - Moved from different state (%)
Geographical mobility - Moved from different state (%) - White
Geographical mobility - Moved from different state (%) - Black or African American
Geographical mobility - Moved from different state (%) - Asian
Geographical mobility - Moved from different state (%) - Hispanic or Latino
Geographical mobility - Moved from different state (%) - American Indian and Alaska Native
Geographical mobility - Moved from different state (%) - Multirace
Geographical mobility - Moved from different state (%) - Other Race
Geographical mobility - Moved from abroad (%)
Geographical mobility - Moved from abroad (%) - White
Geographical mobility - Moved from abroad (%) - Black or African American
Geographical mobility - Moved from abroad (%) - Asian
Geographical mobility - Moved from abroad (%) - Hispanic or Latino
Geographical mobility - Moved from abroad (%) - American Indian and Alaska Native
Geographical mobility - Moved from abroad (%) - Multirace
Geographical mobility - Moved from abroad (%) - Other Race
Place of birth for the foreign-born population - Ireland (%)
Place of birth for the foreign-born population - Denmark (%)
Place of birth for the foreign-born population - Norway (%)
Place of birth for the foreign-born population - Sweden (%)
Place of birth for the foreign-born population - United Kingdom (%)
Place of birth for the foreign-born population - England (%)
Place of birth for the foreign-born population - Scotland (%)
Place of birth for the foreign-born population - Other Northern Europe (%)
Place of birth for the foreign-born population - Austria (%)
Place of birth for the foreign-born population - Belgium (%)
Place of birth for the foreign-born population - France (%)
Place of birth for the foreign-born population - Germany (%)
Place of birth for the foreign-born population - Netherlands (%)
Place of birth for the foreign-born population - Switzerland (%)
Place of birth for the foreign-born population - Other Western Europe (%)
Place of birth for the foreign-born population - Greece (%)
Place of birth for the foreign-born population - Italy (%)
Place of birth for the foreign-born population - Portugal (%)
Place of birth for the foreign-born population - Spain (%)
Place of birth for the foreign-born population - Other Southern Europe (%)
Place of birth for the foreign-born population - Albania (%)
Place of birth for the foreign-born population - Belarus (%)
Place of birth for the foreign-born population - Bosnia and Herzegovina (%)
Place of birth for the foreign-born population - Bulgaria (%)
Place of birth for the foreign-born population - Croatia (%)
Place of birth for the foreign-born population - Czechoslovakia (%)
Place of birth for the foreign-born population - Hungary (%)
Place of birth for the foreign-born population - Latvia (%)
Place of birth for the foreign-born population - Lithuania (%)
Place of birth for the foreign-born population - North Macedonia (Macedonia) (%)
Place of birth for the foreign-born population - Moldova (%)
Place of birth for the foreign-born population - Poland (%)
Place of birth for the foreign-born population - Romania (%)
Place of birth for the foreign-born population - Russia (%)
Place of birth for the foreign-born population - Serbia (%)
Place of birth for the foreign-born population - Ukraine (%)
Place of birth for the foreign-born population - Other Eastern Europe (%)
Place of birth for the foreign-born population - China (%)
Place of birth for the foreign-born population - Hong Kong (%)
Place of birth for the foreign-born population - Taiwan (%)
Place of birth for the foreign-born population - Japan (%)
Place of birth for the foreign-born population - Korea (%)
Place of birth for the foreign-born population - Other Eastern Asia (%)
Place of birth for the foreign-born population - Afghanistan (%)
Place of birth for the foreign-born population - Bangladesh (%)
Place of birth for the foreign-born population - India (%)
Place of birth for the foreign-born population - Iran (%)
Place of birth for the foreign-born population - Kazakhstan (%)
Place of birth for the foreign-born population - Nepal (%)
Place of birth for the foreign-born population - Pakistan (%)
Place of birth for the foreign-born population - Sri Lanka (%)
Place of birth for the foreign-born population - Uzbekistan (%)
Place of birth for the foreign-born population - Other South Central Asia (%)
Place of birth for the foreign-born population - Burma (%)
Place of birth for the foreign-born population - Cambodia (%)
Place of birth for the foreign-born population - Indonesia (%)
Place of birth for the foreign-born population - Laos (%)
Place of birth for the foreign-born population - Malaysia (%)
Place of birth for the foreign-born population - Philippines (%)
Place of birth for the foreign-born population - Singapore (%)
Place of birth for the foreign-born population - Thailand (%)
Place of birth for the foreign-born population - Vietnam (%)
Place of birth for the foreign-born population - Other South Eastern Asia (%)
Place of birth for the foreign-born population - Armenia (%)
Place of birth for the foreign-born population - Iraq (%)
Place of birth for the foreign-born population - Israel (%)
Place of birth for the foreign-born population - Jordan (%)
Place of birth for the foreign-born population - Kuwait (%)
Place of birth for the foreign-born population - Lebanon (%)
Place of birth for the foreign-born population - Saudi Arabia (%)
Place of birth for the foreign-born population - Syria (%)
Place of birth for the foreign-born population - Turkey (%)
Place of birth for the foreign-born population - Yemen (%)
Place of birth for the foreign-born population - Other Western Asia (%)
Place of birth for the foreign-born population - Eritrea (%)
Place of birth for the foreign-born population - Ethiopia (%)
Place of birth for the foreign-born population - Kenya (%)
Place of birth for the foreign-born population - Somalia (%)
Place of birth for the foreign-born population - Uganda (%)
Place of birth for the foreign-born population - Zimbabwe (%)
Place of birth for the foreign-born population - Other Eastern Africa (%)
Place of birth for the foreign-born population - Cameroon (%)
Place of birth for the foreign-born population - Congo (%)
Place of birth for the foreign-born population - Democratic Republic of Congo (Zaire) (%)
Place of birth for the foreign-born population - Other Middle Africa (%)
Place of birth for the foreign-born population - Egypt (%)
Place of birth for the foreign-born population - Morocco (%)
Place of birth for the foreign-born population - Sudan (%)
Place of birth for the foreign-born population - Other Northern Africa (%)
Place of birth for the foreign-born population - South Africa (%)
Place of birth for the foreign-born population - Other Southern Africa (%)
Place of birth for the foreign-born population - Cabo Verde (%)
Place of birth for the foreign-born population - Ghana (%)
Place of birth for the foreign-born population - Liberia (%)
Place of birth for the foreign-born population - Nigeria (%)
Place of birth for the foreign-born population - Senegal (%)
Place of birth for the foreign-born population - Sierra Leone (%)
Place of birth for the foreign-born population - Other Western Africa (%)
Place of birth for the foreign-born population - Australia (%)
Place of birth for the foreign-born population - New Zealand (%)
Place of birth for the foreign-born population - Fiji (%)
Place of birth for the foreign-born population - Micronesia (%)
Place of birth for the foreign-born population - Bahamas (%)
Place of birth for the foreign-born population - Barbados (%)
Place of birth for the foreign-born population - Cuba (%)
Place of birth for the foreign-born population - Dominica (%)
Place of birth for the foreign-born population - Dominican Republic (%)
Place of birth for the foreign-born population - Grenada (%)
Place of birth for the foreign-born population - Haiti (%)
Place of birth for the foreign-born population - Jamaica (%)
Place of birth for the foreign-born population - St. Vincent and the Grenadines (%)
Place of birth for the foreign-born population - Trinidad and Tobago (%)
Place of birth for the foreign-born population - West Indies (%)
Place of birth for the foreign-born population - Other Caribbean (%)
Place of birth for the foreign-born population - Belize (%)
Place of birth for the foreign-born population - Costa Rica (%)
Place of birth for the foreign-born population - El Salvador (%)
Place of birth for the foreign-born population - Guatemala (%)
Place of birth for the foreign-born population - Honduras (%)
Place of birth for the foreign-born population - Mexico (%)
Place of birth for the foreign-born population - Nicaragua (%)
Place of birth for the foreign-born population - Panama (%)
Place of birth for the foreign-born population - Other Central America (%)
Place of birth for the foreign-born population - Argentina (%)
Place of birth for the foreign-born population - Bolivia (%)
Place of birth for the foreign-born population - Brazil (%)
Place of birth for the foreign-born population - Chile (%)
Place of birth for the foreign-born population - Colombia (%)
Place of birth for the foreign-born population - Ecuador (%)
Place of birth for the foreign-born population - Guyana (%)
Place of birth for the foreign-born population - Peru (%)
Place of birth for the foreign-born population - Uruguay (%)
Place of birth for the foreign-born population - Venezuela (%)
Place of birth for the foreign-born population - Other South America (%)
Place of birth for the foreign-born population - Canada (%)
Place of birth for the foreign-born population - Other Northern America (%)
Place of birth for the foreign-born population - Other (%)
Latest news about races in Bethel, CT collected exclusively by city-data.com from local newspapers, TV, and radio stations
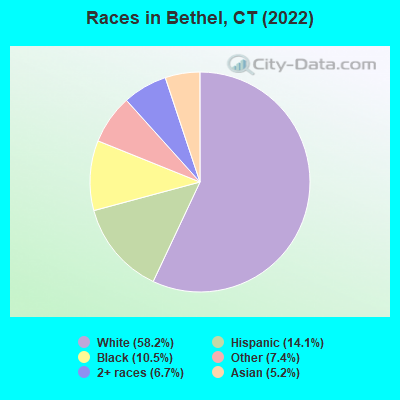
According to 2022 data, the most numerous races in Bethel, CT are White alone (6,749 residents), Hispanic (1,630 residents), and Black alone (1,222 residents). 70.9% of Bethel residents speak English at home. 25.0% of Bethel, CT residents are foreign-born (12.9% born in Latin America, 4.8% born in Europe, 3.3% born in Asia, 2.7% born in Africa), which is 40.1% greater than the foreign-born rate of 15.0% across the entire state of Connecticut.
Race distribution in Bethel
2000 2022
2,638,845 77.5% White alone 320,323 9.4% Hispanic 295,571 8.7% Black alone 81,564 2.4% Asian alone 52,896 1.6% Two or more races 8,141 0.2% Other race alone 7,267 0.2% American Indian alone 958 0.03% Native Hawaiian and Other
2,246,913 62.0% White alone 658,978 18.2% Hispanic 353,973 9.8% Black alone 172,929 4.8% Asian alone 159,631 4.4% Two or more races 29,761 0.8% Other race alone 3,428 0.09% American Indian alone 592 0.02% Native Hawaiian and Other
Income and house value in Bethel Median household income in 2022 $77,128 White non-Hispanic householders$101,731 Asian householders$112,552 Some other race householders$75,484 Two or more races householders$90,912 Hispanic or Latino race householdersMedian 2022 house value $397,344 White Non-Hispanic householders$346,884 Black or African American householders $363,547 Asian householders$381,385 Some other race householders$645,420 Two or more races householders$343,598 Hispanic or Latino householders
Median age by race in Bethel
49.1 Median age for White residents45.9 51.1 32.0 Median age for Black or African American residents46.7 12.7 -742,173,111.6 Median age for American Indian / Alaska Native residents-701,030,927.1 -704,477,611.2 42.1 Median age for Asian residents41.2 43.3 -641,269,840.6 Median age for Native Hawaiian / Pacific Islander residents-414,239,481.8 -691,588,784.4 34.2 Median age for Other race residents29.8 43.4 28.2 Median age for Two or more races residents21.8 36.8 49.8 Median age for White alone residents45.8 51.5 32.6 Median age for Hispanic or Latino residents25.1 43.0
Owner/renter occupied households by race in Bethel
House owners and renters - White residents 2,346 74.4% Owner occupied809 25.6% Renter occupiedHouse owners and renters - Black or African American residents 332 90.2% Owner occupied36 9.8% Renter occupiedHouse owners and renters - Asian residents 242 100.0% Owner occupiedHouse owners and renters - Other race residents 149 30.1% Owner occupied346 69.9% Renter occupiedHouse owners and renters - Two or more races residents 190 32.8% Owner occupied388 67.2% Renter occupiedHouse owners and renters - White alone residents 2,314 73.3% Owner occupied843 26.7% Renter occupiedHouse owners and renters - Hispanic or Latino residents 250 43.5% Owner occupied325 56.5% Renter occupied
Language usage in Bethel
English speakers - Total 70.9% of residents of Bethel speak English at home.
8.0% of residents speak Spanish at home 739 84.5% Speak English very well136 15.5% Speak English less than very well21.0% of residents speak other language at home 1,300 56.4% Speak English very well1,006 43.6% Speak English less than very well
English speakers - Born in the United States 87.0% of residents of Bethel speak English at home.
8.4% of residents speak Spanish at home 302 100.0% Speak English very well4.7% of residents speak other language at home 163 95.9% Speak English very well7 4.1% Speak English less than very well
English speakers - Native, born elsewhere 40.3% of residents of Bethel speak English at home.
60.4% of residents speak Spanish at home 135 81.8% Speak English very well30 18.2% Speak English less than very well
English speakers - Foreign-born 24.3% of residents of Bethel speak English at home.
9.0% of residents speak Spanish at home 171 65.5% Speak English very well90 34.5% Speak English less than very well65.1% of residents speak other language at home 917 48.5% Speak English very well972 51.5% Speak English less than very well
White (Caucasian) - Speak only English Native:
98.7% (5,638)Foreign-born:
42.4% (296)
White (Caucasian) - Speak another language Native:
2.4% (137)Foreign-born:
59.6% (416)
Black or African American - Speak only English Native:
96.6% (676)Foreign-born:
46.0% (213)
Black or African American - Speak another language Native:
2.7% (19)Foreign-born:
49.0% (226)
Asian - Speak only English Native:
64.0% (113)Foreign-born:
22.2% (90)
Asian - Speak another language Native:
36.6% (65)Foreign-born:
77.4% (314)
Other race - Speak only English Native:
36.0% (276)Foreign-born:
9.4% (63)
Other race - Speak another language Native:
64.1% (491)Foreign-born:
90.1% (609)
Two or more races - Speak only English Native:
46.4% (411)Foreign-born:
2.0% (17)
Two or more races - Speak another language Native:
56.5% (500)Foreign-born:
100.0% (864)
White alone - Speak only English Native:
97.0% (5,501)Foreign-born:
39.2% (287)
White alone - Speak another language Native:
3.0% (168)Foreign-born:
61.0% (447)
Hispanic or Latino - Speak only English Native:
52.1% (627)Foreign-born:
11.6% (33)
Hispanic or Latino - Speak another language Native:
48.7% (586)Foreign-born:
87.2% (249)
Foreign-born residents in Bethel 2,903 residents are foreign born (12.9% Latin America , 4.8% Europe , 3.3% Asia , 2.7% Africa ).
This city:
25.0%Connecticut:
15.0%
Marital status for residents in Bethel Marital status - White (Caucasian) population 15 years and over
Males 37.4% Never married37.7% Now married1.8% Separated5.4% Widowed17.7% DivorcedFemales 33.0% Never married31.3% Now married1.7% Separated10.3% Widowed23.7% DivorcedWomen who gave birth in the past 12 months Now married:
33.3% (28)Unmarried:
66.7% (55)
Women who did not give birth in the past 12 months Now married:
31.0% (390)Unmarried:
69.0% (870)
Marital status - Black or African American population 15 years and over
Males 46.4% Never married24.2% Now married0.0% Separated0.0% Widowed29.4% DivorcedFemales 78.3% Never married21.7% Now married0.0% Separated0.0% Widowed0.0% DivorcedWomen who gave birth in the past 12 months Now married:
0.0% (0)Unmarried:
100.0% (109)
Women who did not give birth in the past 12 months Now married:
50.4% (60)Unmarried:
49.6% (59)
Marital status - Asian population 15 years and over
Males 24.8% Never married75.2% Now married0.0% Separated0.0% Widowed0.0% DivorcedFemales 25.7% Never married74.3% Now married0.0% Separated0.0% Widowed0.0% DivorcedWomen who did not give birth in the past 12 months Now married:
66.2% (134)Unmarried:
33.8% (69)
Marital status - Other race population 15 years and over
Males 65.2% Never married27.1% Now married0.0% Separated0.0% Widowed7.8% DivorcedFemales 23.8% Never married40.1% Now married0.0% Separated0.0% Widowed36.2% DivorcedWomen who did not give birth in the past 12 months Now married:
45.1% (158)Unmarried:
54.9% (192)
Marital status - Two or more races population 15 years and over
Males 16.2% Never married75.6% Now married0.0% Separated0.0% Widowed8.2% DivorcedFemales 46.5% Never married49.9% Now married0.0% Separated0.0% Widowed3.6% DivorcedWomen who gave birth in the past 12 months Now married:
73.8% (47)Unmarried:
26.2% (17)
Women who did not give birth in the past 12 months Now married:
46.5% (272)Unmarried:
53.5% (313)
Marital status - White alone, not Hispanic / Latino population 15 years and over
Males 36.1% Never married37.8% Now married1.9% Separated5.7% Widowed18.6% DivorcedFemales 33.1% Never married30.0% Now married1.8% Separated10.6% Widowed24.5% DivorcedWomen who gave birth in the past 12 months Now married:
7.7% (5)Unmarried:
92.3% (58)
Women who did not give birth in the past 12 months Now married:
30.2% (384)Unmarried:
69.8% (886)
Marital status - Hispanic or Latino population 15 years and over
Males 54.6% Never married42.2% Now married0.0% Separated0.0% Widowed3.2% DivorcedFemales 38.0% Never married36.0% Now married0.0% Separated0.0% Widowed26.0% DivorcedWomen who gave birth in the past 12 months Now married:
100.0% (59)Unmarried:
0.0% (0)
Women who did not give birth in the past 12 months Now married:
32.2% (141)Unmarried:
67.8% (296)
Ancestries in Bethel
1,072 17.5% Brazilian627 10.3% Italian352 5.8% Irish308 5.0% Jamaican284 4.6% English245 4.0% American184 3.0% German122 2.0% Portuguese115 1.9% Moroccan89 1.5% European76 1.2% Ukrainian67 1.1% Greek59 1.0% Swedish39 0.6% Russian37 0.6% Egyptian21 0.3% Dutch21 0.3% Romanian18 0.3% Polish16 0.3% British15 0.2% Carpatho Rusyn14 0.2% French14 0.2% Scotch-Irish11 0.2% Slavic9 0.1% French Canadian8 0.1% Slovak6 0.10% Turkish5 0.08% Scottish
Geographical mobility in Bethel Same house 1 year ago 6,218 92.4% White (Caucasian)1,044 92.2% Black or African American546 89.4% Asian1,422 95.2% Other race1,625 95.2% Two or more races6,171 92.3% White alone, not Hispanic / Latino1,418 89.6% Hispanic or LatinoMoved within same county 128 1.9% White / Caucasian43 7.1% Asian10 0.7% Other race73 4.3% Two or more races112 1.7% White alone, not Hispanic / Latino73 4.6% Hispanic or LatinoMoved within same state 111 1.7% White / Caucasian11 1.0% Black or African American117 1.7% White alone, not Hispanic / LatinoMoved from different state 319 4.7% White / Caucasian105 9.3% Black or African American7 1.1% Asian166 11.1% Other race8 0.5% Two or more races326 4.9% White alone, not Hispanic / Latino137 8.6% Hispanic or LatinoMoved from abroad 10 0.1% White10 0.2% White alone, not Hispanic / Latino
Children Nativity (place of birth) in Bethel
Children under 6 years - Living with two parents Both parents native 223 100.0% NativeBoth parents foreign-born 82 100.0% NativeOne native, one foreign-born parent 77 100.0% NativeChildren under 6 years - Living with one parent Native parent 90 100.0% NativeForeign-born parent 199 100.0% NativeChildren 6 to 17 years - Living with two parents Both parents native 407 100.0% NativeBoth parents foreign-born 275 66.6% Native138 33.4% Foreign-bornOne native, one foreign-born parent 149 100.0% NativeChildren 6 to 17 years - Living with one parent Native parent 340 100.0% NativeForeign-born parent 673 51.2% Native641 48.8% Foreign-born
Grandparents responsible for own grandchildren in Bethel
Grandparents (30 to 59 years) Other race 22 100.0% Responsible for grandchildren
Grandparents (60 years and over) Other race 53 100.0% Responsible for grandchildren