Races in Berkeley Heights, New Jersey (NJ) Detailed Stats
Ancestries, Foreign-born residents, place of birth

Recent posts about races in Berkeley Heights, New Jersey on our local forum with over 2,400,000 registered users:

13.8% of Berkeley Heights, NJ residents are foreign-born (5.6% born in Asia, 5.2% born in Europe, 2.6% born in Latin America), which is 66.2% less than the foreign-born rate of 23.0% across the entire state of New Jersey.
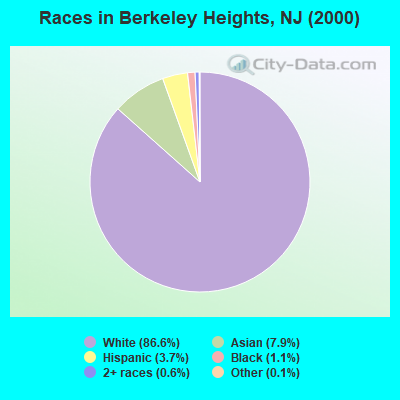
Race distribution in Berkeley Heights

- 11,61186.6%White alone
- 1,0557.9%Asian alone
- 4943.7%Hispanic
- 1431.1%Black alone
- 760.6%Two or more races
- 180.1%Other race alone
- 100.07%American Indian alone
2000
2022
-
- 5,557,20966.0%White alone
- 1,117,19113.3%Hispanic
- 1,096,17113.0%Black alone
- 477,0125.7%Asian alone
- 133,6891.6%Two or more races
- 19,5650.2%Other race alone
- 11,3380.1%American Indian alone
- 2,1750.03%Native Hawaiian and Other
Pacific Islander alone

-
- 4,766,47651.5%White alone
- 2,028,47021.9%Hispanic
- 1,111,63212.0%Black alone
- 923,54610.0%Asian alone
- 332,2373.6%Two or more races
- 89,8471.0%Other race alone
- 8,5570.09%American Indian alone
- 9340.01%Native Hawaiian and Other
Pacific Islander alone

Income and house value in Berkeley Heights
- Median household income in 2022
- over $200,000White non-Hispanic householders
- over $200,000Black householders
- over $200,000Asian householders
- $132,256Some other race householders
- over $200,000Two or more races householders
- $175,718Hispanic or Latino race householders
- Median 2022 house value
- $874,475White Non-Hispanic householders
- $494,573Black or African American householders
- $979,163Asian householders
- $944,357Some other race householders
- over $1,000,000Two or more races householders
- $906,852Hispanic or Latino householders
Household income for White non-Hispanic householders

Household income for Black householders

Household income for Asian householders

Household income for Two or more races householders

Household income for Hispanic or Latino race householders

Foreign-born residents in Berkeley Heights
1,855 residents are foreign born (5.6% Asia, 5.2% Europe, 2.6% Latin America).
| This city: | 13.8% |
| New Jersey: | 17.5% |
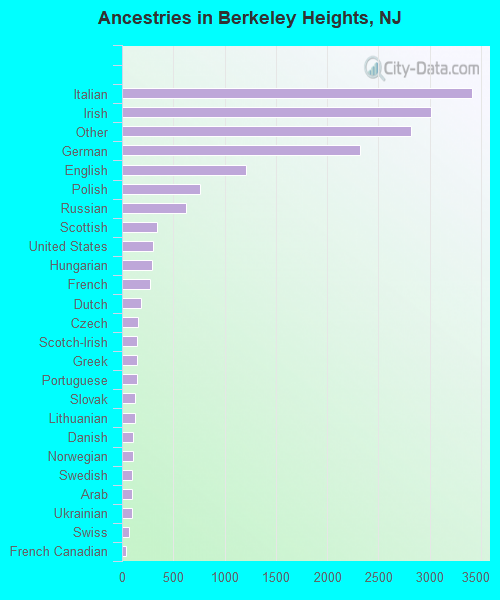
Ancestries in Berkeley Heights

- 3,40719.9%Italian
- 3,01617.6%Irish
- 2,81916.5%Other
- 2,31913.5%German
- 1,2067.0%English
- 7584.4%Polish
- 6273.7%Russian
- 3462.0%Scottish
- 3071.8%United States
- 2951.7%Hungarian
- 2761.6%French
- 1891.1%Dutch
- 1590.9%Czech
- 1510.9%Scotch-Irish
- 1490.9%Greek
- 1420.8%Portuguese
- 1240.7%Slovak
- 1230.7%Lithuanian
- 1110.6%Danish
- 1100.6%Norwegian
- 990.6%Swedish
- 950.6%Arab
- 940.5%Ukrainian
- 710.4%Swiss
- 410.2%French Canadian
- 340.2%West Indian
- 330.2%Welsh
- 230.1%Subsaharan African
Zip codes: 07922.