Races in Bellview, Florida (FL) Detailed Stats
Data:
Races - White alone (%)
Races - White alone (% change since 2000)
Races - Black alone (%)
Races - Black alone (% change since 2000)
Races - American Indian alone (%)
Races - American Indian alone (% change since 2000)
Races - Asian alone (%)
Races - Asian alone (% change since 2000)
Races - Hispanic (%)
Races - Hispanic (% change since 2000)
Races - Native Hawaiian and Other Pacific Islander alone (%)
Races - Native Hawaiian and Other Pacific Islander alone (% change since 2000)
Races - Two or more races(%)
Races - Two or more races(% change since 2000)
Races - Other race alone (%)
Races - Other race alone (% change since 2000)
Racial diversity
Place of birth - Born in state of residence (%)
Place of birth - Born in state of residence (%) - White
Place of birth - Born in state of residence (%) - Black or African American
Place of birth - Born in state of residence (%) - Asian
Place of birth - Born in state of residence (%) - Hispanic or Latino
Place of birth - Born in state of residence (%) - American Indian and Alaska Native
Place of birth - Born in state of residence (%) - Multirace
Place of birth - Born in state of residence (%) - Other Race
Place of birth - Born in other state (%)
Place of birth - Born in other state (%) - White
Place of birth - Born in other state (%) - Black or African American
Place of birth - Born in other state (%) - Asian
Place of birth - Born in other state (%) - Hispanic or Latino
Place of birth - Born in other state (%) - American Indian and Alaska Native
Place of birth - Born in other state (%) - Multirace
Place of birth - Born in other state (%) - Other Race
Place of birth - Native, outside of US (%)
Place of birth - Native, outside of US (%) - White
Place of birth - Native, outside of US (%) - Black or African American
Place of birth - Native, outside of US (%) - Asian
Place of birth - Native, outside of US (%) - Hispanic or Latino
Place of birth - Native, outside of US (%) - American Indian and Alaska Native
Place of birth - Native, outside of US (%) - Multirace
Place of birth - Native, outside of US (%) - Other Race
Place of birth - Foreign born (%)
Place of birth - Foreign born (%) - White
Place of birth - Foreign born (%) - Black or African American
Place of birth - Foreign born (%) - Asian
Place of birth - Foreign born (%) - Hispanic or Latino
Place of birth - Foreign born (%) - American Indian and Alaska Native
Place of birth - Foreign born (%) - Multirace
Place of birth - Foreign born (%) - Other Race
Residents speaking English at home (%)
Residents speaking English at home - Born in the United States (%)
Residents speaking English at home - Native, born elsewhere (%)
Residents speaking English at home - Foreign born (%)
Residents speaking Spanish at home (%)
Residents speaking Spanish at home - Born in the United States (%)
Residents speaking Spanish at home - Native, born elsewhere (%)
Residents speaking Spanish at home - Foreign born (%)
Residents speaking other language at home (%)
Residents speaking other language at home - Born in the United States (%)
Residents speaking other language at home - Native, born elsewhere (%)
Residents speaking other language at home - Foreign born (%)
Marital status - Never married (%)
Marital status - Now married (%)
Marital status - Separated (%)
Marital status - Widowed (%)
Marital status - Divorced (%)
Ancestries Reported - Arab (%)
Ancestries Reported - Czech (%)
Ancestries Reported - Danish (%)
Ancestries Reported - Dutch (%)
Ancestries Reported - English (%)
Ancestries Reported - French (%)
Ancestries Reported - French Canadian (%)
Ancestries Reported - German (%)
Ancestries Reported - Greek (%)
Ancestries Reported - Hungarian (%)
Ancestries Reported - Irish (%)
Ancestries Reported - Italian (%)
Ancestries Reported - Lithuanian (%)
Ancestries Reported - Norwegian (%)
Ancestries Reported - Polish (%)
Ancestries Reported - Portuguese (%)
Ancestries Reported - Russian (%)
Ancestries Reported - Scotch-Irish (%)
Ancestries Reported - Scottish (%)
Ancestries Reported - Slovak (%)
Ancestries Reported - Subsaharan African (%)
Ancestries Reported - Swedish (%)
Ancestries Reported - Swiss (%)
Ancestries Reported - Ukrainian (%)
Ancestries Reported - United States (%)
Ancestries Reported - Welsh (%)
Ancestries Reported - West Indian (%)
Ancestries Reported - Other (%)
Geographical mobility - Same house 1 year ago (%)
Geographical mobility - Same house 1 year ago (%) - White
Geographical mobility - Same house 1 year ago (%) - Black or African American
Geographical mobility - Same house 1 year ago (%) - Asian
Geographical mobility - Same house 1 year ago (%) - Hispanic or Latino
Geographical mobility - Same house 1 year ago (%) - American Indian and Alaska Native
Geographical mobility - Same house 1 year ago (%) - Multirace
Geographical mobility - Same house 1 year ago (%) - Other Race
Geographical mobility - Moved within same county (%)
Geographical mobility - Moved within same county (%) - White
Geographical mobility - Moved within same county (%) - Black or African American
Geographical mobility - Moved within same county (%) - Asian
Geographical mobility - Moved within same county (%) - Hispanic or Latino
Geographical mobility - Moved within same county (%) - American Indian and Alaska Native
Geographical mobility - Moved within same county (%) - Multirace
Geographical mobility - Moved within same county (%) - Other Race
Geographical mobility - Moved from different county within same state (%)
Geographical mobility - Moved from different county within same state (%) - White
Geographical mobility - Moved from different county within same state (%) - Black or African American
Geographical mobility - Moved from different county within same state (%) - Asian
Geographical mobility - Moved from different county within same state (%) - Hispanic or Latino
Geographical mobility - Moved from different county within same state (%) - American Indian and Alaska Native
Geographical mobility - Moved from different county within same state (%) - Multirace
Geographical mobility - Moved from different county within same state (%) - Other Race
Geographical mobility - Moved from different state (%)
Geographical mobility - Moved from different state (%) - White
Geographical mobility - Moved from different state (%) - Black or African American
Geographical mobility - Moved from different state (%) - Asian
Geographical mobility - Moved from different state (%) - Hispanic or Latino
Geographical mobility - Moved from different state (%) - American Indian and Alaska Native
Geographical mobility - Moved from different state (%) - Multirace
Geographical mobility - Moved from different state (%) - Other Race
Geographical mobility - Moved from abroad (%)
Geographical mobility - Moved from abroad (%) - White
Geographical mobility - Moved from abroad (%) - Black or African American
Geographical mobility - Moved from abroad (%) - Asian
Geographical mobility - Moved from abroad (%) - Hispanic or Latino
Geographical mobility - Moved from abroad (%) - American Indian and Alaska Native
Geographical mobility - Moved from abroad (%) - Multirace
Geographical mobility - Moved from abroad (%) - Other Race
Place of birth for the foreign-born population - Ireland (%)
Place of birth for the foreign-born population - Denmark (%)
Place of birth for the foreign-born population - Norway (%)
Place of birth for the foreign-born population - Sweden (%)
Place of birth for the foreign-born population - United Kingdom (%)
Place of birth for the foreign-born population - England (%)
Place of birth for the foreign-born population - Scotland (%)
Place of birth for the foreign-born population - Other Northern Europe (%)
Place of birth for the foreign-born population - Austria (%)
Place of birth for the foreign-born population - Belgium (%)
Place of birth for the foreign-born population - France (%)
Place of birth for the foreign-born population - Germany (%)
Place of birth for the foreign-born population - Netherlands (%)
Place of birth for the foreign-born population - Switzerland (%)
Place of birth for the foreign-born population - Other Western Europe (%)
Place of birth for the foreign-born population - Greece (%)
Place of birth for the foreign-born population - Italy (%)
Place of birth for the foreign-born population - Portugal (%)
Place of birth for the foreign-born population - Spain (%)
Place of birth for the foreign-born population - Other Southern Europe (%)
Place of birth for the foreign-born population - Albania (%)
Place of birth for the foreign-born population - Belarus (%)
Place of birth for the foreign-born population - Bosnia and Herzegovina (%)
Place of birth for the foreign-born population - Bulgaria (%)
Place of birth for the foreign-born population - Croatia (%)
Place of birth for the foreign-born population - Czechoslovakia (%)
Place of birth for the foreign-born population - Hungary (%)
Place of birth for the foreign-born population - Latvia (%)
Place of birth for the foreign-born population - Lithuania (%)
Place of birth for the foreign-born population - North Macedonia (Macedonia) (%)
Place of birth for the foreign-born population - Moldova (%)
Place of birth for the foreign-born population - Poland (%)
Place of birth for the foreign-born population - Romania (%)
Place of birth for the foreign-born population - Russia (%)
Place of birth for the foreign-born population - Serbia (%)
Place of birth for the foreign-born population - Ukraine (%)
Place of birth for the foreign-born population - Other Eastern Europe (%)
Place of birth for the foreign-born population - China (%)
Place of birth for the foreign-born population - Hong Kong (%)
Place of birth for the foreign-born population - Taiwan (%)
Place of birth for the foreign-born population - Japan (%)
Place of birth for the foreign-born population - Korea (%)
Place of birth for the foreign-born population - Other Eastern Asia (%)
Place of birth for the foreign-born population - Afghanistan (%)
Place of birth for the foreign-born population - Bangladesh (%)
Place of birth for the foreign-born population - India (%)
Place of birth for the foreign-born population - Iran (%)
Place of birth for the foreign-born population - Kazakhstan (%)
Place of birth for the foreign-born population - Nepal (%)
Place of birth for the foreign-born population - Pakistan (%)
Place of birth for the foreign-born population - Sri Lanka (%)
Place of birth for the foreign-born population - Uzbekistan (%)
Place of birth for the foreign-born population - Other South Central Asia (%)
Place of birth for the foreign-born population - Burma (%)
Place of birth for the foreign-born population - Cambodia (%)
Place of birth for the foreign-born population - Indonesia (%)
Place of birth for the foreign-born population - Laos (%)
Place of birth for the foreign-born population - Malaysia (%)
Place of birth for the foreign-born population - Philippines (%)
Place of birth for the foreign-born population - Singapore (%)
Place of birth for the foreign-born population - Thailand (%)
Place of birth for the foreign-born population - Vietnam (%)
Place of birth for the foreign-born population - Other South Eastern Asia (%)
Place of birth for the foreign-born population - Armenia (%)
Place of birth for the foreign-born population - Iraq (%)
Place of birth for the foreign-born population - Israel (%)
Place of birth for the foreign-born population - Jordan (%)
Place of birth for the foreign-born population - Kuwait (%)
Place of birth for the foreign-born population - Lebanon (%)
Place of birth for the foreign-born population - Saudi Arabia (%)
Place of birth for the foreign-born population - Syria (%)
Place of birth for the foreign-born population - Turkey (%)
Place of birth for the foreign-born population - Yemen (%)
Place of birth for the foreign-born population - Other Western Asia (%)
Place of birth for the foreign-born population - Eritrea (%)
Place of birth for the foreign-born population - Ethiopia (%)
Place of birth for the foreign-born population - Kenya (%)
Place of birth for the foreign-born population - Somalia (%)
Place of birth for the foreign-born population - Uganda (%)
Place of birth for the foreign-born population - Zimbabwe (%)
Place of birth for the foreign-born population - Other Eastern Africa (%)
Place of birth for the foreign-born population - Cameroon (%)
Place of birth for the foreign-born population - Congo (%)
Place of birth for the foreign-born population - Democratic Republic of Congo (Zaire) (%)
Place of birth for the foreign-born population - Other Middle Africa (%)
Place of birth for the foreign-born population - Egypt (%)
Place of birth for the foreign-born population - Morocco (%)
Place of birth for the foreign-born population - Sudan (%)
Place of birth for the foreign-born population - Other Northern Africa (%)
Place of birth for the foreign-born population - South Africa (%)
Place of birth for the foreign-born population - Other Southern Africa (%)
Place of birth for the foreign-born population - Cabo Verde (%)
Place of birth for the foreign-born population - Ghana (%)
Place of birth for the foreign-born population - Liberia (%)
Place of birth for the foreign-born population - Nigeria (%)
Place of birth for the foreign-born population - Senegal (%)
Place of birth for the foreign-born population - Sierra Leone (%)
Place of birth for the foreign-born population - Other Western Africa (%)
Place of birth for the foreign-born population - Australia (%)
Place of birth for the foreign-born population - New Zealand (%)
Place of birth for the foreign-born population - Fiji (%)
Place of birth for the foreign-born population - Micronesia (%)
Place of birth for the foreign-born population - Bahamas (%)
Place of birth for the foreign-born population - Barbados (%)
Place of birth for the foreign-born population - Cuba (%)
Place of birth for the foreign-born population - Dominica (%)
Place of birth for the foreign-born population - Dominican Republic (%)
Place of birth for the foreign-born population - Grenada (%)
Place of birth for the foreign-born population - Haiti (%)
Place of birth for the foreign-born population - Jamaica (%)
Place of birth for the foreign-born population - St. Vincent and the Grenadines (%)
Place of birth for the foreign-born population - Trinidad and Tobago (%)
Place of birth for the foreign-born population - West Indies (%)
Place of birth for the foreign-born population - Other Caribbean (%)
Place of birth for the foreign-born population - Belize (%)
Place of birth for the foreign-born population - Costa Rica (%)
Place of birth for the foreign-born population - El Salvador (%)
Place of birth for the foreign-born population - Guatemala (%)
Place of birth for the foreign-born population - Honduras (%)
Place of birth for the foreign-born population - Mexico (%)
Place of birth for the foreign-born population - Nicaragua (%)
Place of birth for the foreign-born population - Panama (%)
Place of birth for the foreign-born population - Other Central America (%)
Place of birth for the foreign-born population - Argentina (%)
Place of birth for the foreign-born population - Bolivia (%)
Place of birth for the foreign-born population - Brazil (%)
Place of birth for the foreign-born population - Chile (%)
Place of birth for the foreign-born population - Colombia (%)
Place of birth for the foreign-born population - Ecuador (%)
Place of birth for the foreign-born population - Guyana (%)
Place of birth for the foreign-born population - Peru (%)
Place of birth for the foreign-born population - Uruguay (%)
Place of birth for the foreign-born population - Venezuela (%)
Place of birth for the foreign-born population - Other South America (%)
Place of birth for the foreign-born population - Canada (%)
Place of birth for the foreign-born population - Other Northern America (%)
Place of birth for the foreign-born population - Other (%)
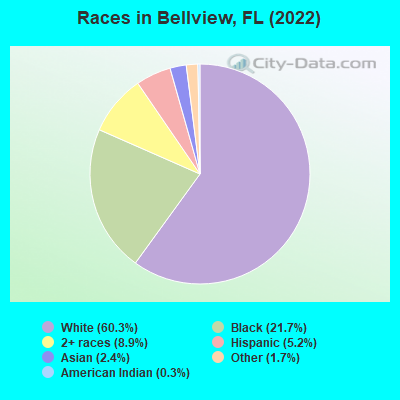
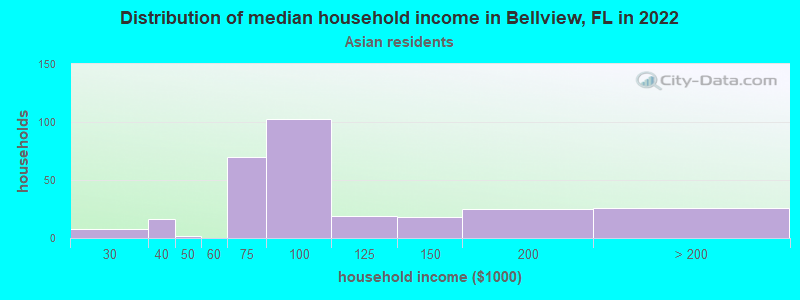
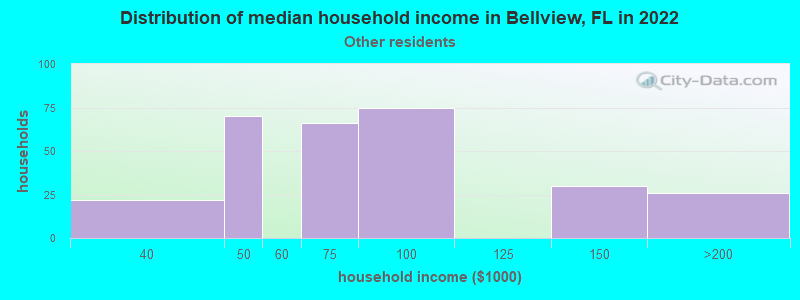
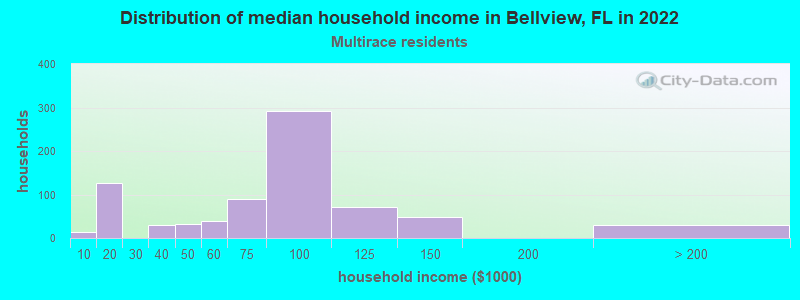
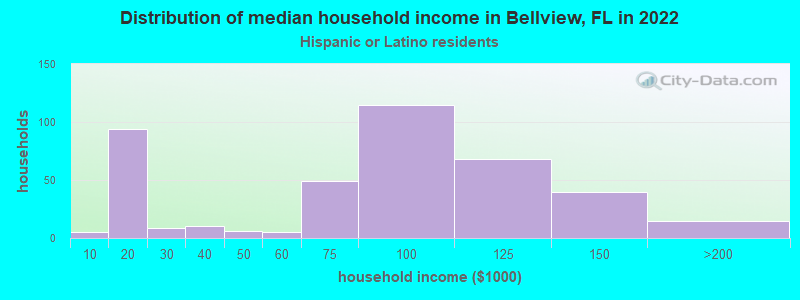
According to 2022 data, the most numerous races in Bellview, FL are White alone (14,652 residents), Hispanic (1,272 residents), and Black alone (5,268 residents). 93.5% of Bellview residents speak English at home. 5.7% of Bellview, FL residents are foreign-born (2.3% born in Asia, 1.9% born in Latin America, 1.0% born in Europe), which is 267.4% less than the foreign-born rate of 21.0% across the entire state of Florida.
Race distribution in Bellview
2000 2022
10,458,509 65.4% White alone 2,682,715 16.8% Hispanic 2,264,268 14.2% Black alone 261,693 1.6% Asian alone 236,954 1.5% Two or more races 42,358 0.3% American Indian alone 28,994 0.2% Other race alone 6,887 0.04% Native Hawaiian and Other
11,309,403 50.8% White alone 6,025,039 27.1% Hispanic 3,241,015 14.6% Black alone 861,630 3.9% Two or more races 623,692 2.8% Asian alone 152,054 0.7% Other race alone 22,504 0.1% American Indian alone 9,486 0.04% Native Hawaiian and Other
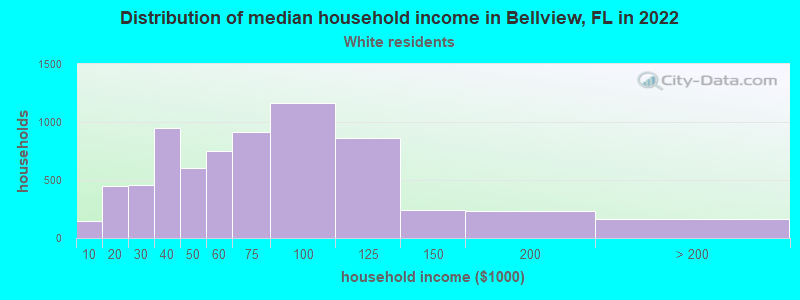
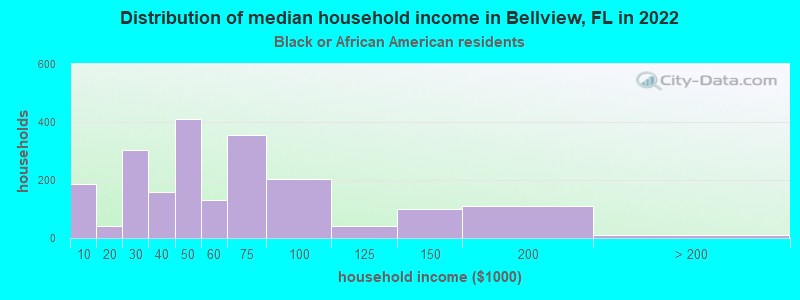
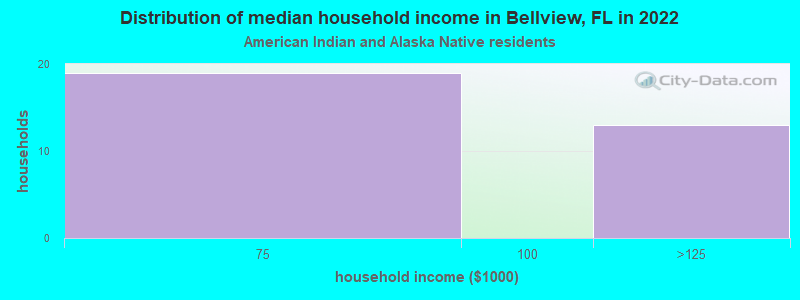
Income and house value in Bellview Median household income in 2022 $63,637 White non-Hispanic householders$53,613 Black householders$92,299 Asian householders$93,777 Some other race householders$75,276 Two or more races householders$89,482 Hispanic or Latino race householdersMedian 2022 house value $197,003 White Non-Hispanic householders$210,120 Black or African American householders$160,869 American Indian or Alaska Native householders $201,953 Asian householders$340,300 Native Hawaiian and other Pacific Islander householders$208,635 Some other race householders$202,448 Two or more races householders$211,110 Hispanic or Latino householders
Median age by race in Bellview
46.3 Median age for White residents46.0 46.3 28.3 Median age for Black or African American residents26.5 32.9 34.3 Median age for American Indian / Alaska Native residents42.1 13.0 56.6 Median age for Asian residents46.7 63.1 -679,849,340.2 Median age for Native Hawaiian / Pacific Islander residents-858,307,848.3 -443,298,968.6 34.2 Median age for Other race residents37.1 27.2 27.0 Median age for Two or more races residents13.2 27.4 46.3 Median age for White alone residents46.3 46.5 29.0 Median age for Hispanic or Latino residents29.0 27.7
Owner/renter occupied households by race in Bellview
House owners and renters - White residents 5,422 78.6% Owner occupied1,476 21.4% Renter occupiedHouse owners and renters - Black or African American residents 944 46.7% Owner occupied1,080 53.3% Renter occupiedHouse owners and renters - American Indian / Alaska Native residents 19 100.0% Owner occupiedHouse owners and renters - Asian residents 251 95.5% Owner occupied12 4.5% Renter occupiedHouse owners and renters - Native Hawaiian / Pacific Islander residents 8 100.0% Owner occupiedHouse owners and renters - Other race residents 149 49.4% Owner occupied153 50.6% Renter occupiedHouse owners and renters - Two or more races residents 382 52.3% Owner occupied347 47.7% Renter occupiedHouse owners and renters - White alone residents 5,353 78.1% Owner occupied1,497 21.9% Renter occupiedHouse owners and renters - Hispanic or Latino residents 230 63.1% Owner occupied134 36.9% Renter occupied
Language usage in Bellview
English speakers - Total 93.5% of residents of Bellview speak English at home.
2.3% of residents speak Spanish at home 366 69.6% Speak English very well160 30.4% Speak English less than very well3.6% of residents speak other language at home 454 55.6% Speak English very well362 44.4% Speak English less than very well
English speakers - Born in the United States 97.6% of residents of Bellview speak English at home.
0.8% of residents speak Spanish at home 86 94.5% Speak English very well5 5.5% Speak English less than very well1.4% of residents speak other language at home 25 16.0% Speak English very well131 84.0% Speak English less than very well
English speakers - Native, born elsewhere 87.5% of residents of Bellview speak English at home.
4.1% of residents speak Spanish at home 21 100.0% Speak English very well8.5% of residents speak other language at home 37 84.1% Speak English very well7 15.9% Speak English less than very well
English speakers - Foreign-born 35.8% of residents of Bellview speak English at home.
14.5% of residents speak Spanish at home 48 24.7% Speak English very well146 75.3% Speak English less than very well44.0% of residents speak other language at home 297 50.5% Speak English very well291 49.5% Speak English less than very well
White (Caucasian) - Speak only English Native:
98.9% (13,510)Foreign-born:
53.4% (179)
White (Caucasian) - Speak another language Native:
1.0% (133)Foreign-born:
47.4% (159)
Black or African American - Speak only English Native:
97.6% (4,562)Foreign-born:
67.4% (101)
Black or African American - Speak another language Native:
3.9% (181)Foreign-born:
27.5% (41)
Asian - Speak only English Native:
50.2% (84)Foreign-born:
25.9% (98)
Asian - Speak another language Native:
50.3% (84)Foreign-born:
74.0% (280)
Other race - Speak only English Native:
72.6% (323)Foreign-born:
7.5% (32)
Other race - Speak another language Native:
33.2% (147)Foreign-born:
91.6% (385)
Two or more races - Speak only English Native:
96.7% (2,061)Foreign-born:
63.2% (86)
Two or more races - Speak another language Native:
3.6% (77)Foreign-born:
52.3% (72)
White alone - Speak only English Native:
99.0% (13,277)Foreign-born:
53.4% (172)
White alone - Speak another language Native:
0.8% (101)Foreign-born:
44.7% (144)
Hispanic or Latino - Speak only English Native:
86.6% (690)Foreign-born:
20.0% (58)
Hispanic or Latino - Speak another language Native:
15.4% (123)Foreign-born:
79.0% (230)
Foreign-born residents in Bellview 1,389 residents are foreign born (2.3% Asia , 1.9% Latin America , 1.0% Europe ).
This city:
5.7%Florida:
21.1%
Marital status for residents in Bellview Marital status - White (Caucasian) population 15 years and over
Males 28.2% Never married50.2% Now married2.0% Separated5.7% Widowed13.9% DivorcedFemales 29.5% Never married37.9% Now married1.2% Separated13.6% Widowed17.8% DivorcedWomen who gave birth in the past 12 months Now married:
54.0% (169)Unmarried:
46.0% (144)
Women who did not give birth in the past 12 months Now married:
27.7% (873)Unmarried:
72.3% (2,278)
Marital status - Black or African American population 15 years and over
Males 46.9% Never married38.2% Now married1.8% Separated1.1% Widowed12.0% DivorcedFemales 46.1% Never married33.8% Now married0.8% Separated4.1% Widowed15.3% DivorcedWomen who gave birth in the past 12 months Now married:
35.3% (6)Unmarried:
64.7% (11)
Women who did not give birth in the past 12 months Now married:
25.8% (384)Unmarried:
74.2% (1,102)
Marital status - American Indian / Alaska Native population 15 years and over
Males 20.6% Never married79.4% Now married0.0% Separated0.0% Widowed0.0% DivorcedFemales 0.0% Never married0.0% Now married0.0% Separated57.1% Widowed42.9% DivorcedMarital status - Asian population 15 years and over
Males 29.3% Never married66.7% Now married0.0% Separated4.0% Widowed0.0% DivorcedFemales 15.6% Never married76.0% Now married0.0% Separated3.6% Widowed4.9% DivorcedWomen who gave birth in the past 12 months Now married:
100.0% (16)Unmarried:
0.0% (0)
Women who did not give birth in the past 12 months Now married:
59.1% (54)Unmarried:
40.9% (37)
Marital status - Other race population 15 years and over
Males 80.7% Never married19.3% Now married0.0% Separated0.0% Widowed0.0% DivorcedFemales 35.7% Never married12.4% Now married0.0% Separated28.1% Widowed23.8% DivorcedWomen who did not give birth in the past 12 months Now married:
7.1% (14)Unmarried:
92.9% (190)
Marital status - Two or more races population 15 years and over
Males 24.6% Never married55.3% Now married0.0% Separated0.0% Widowed20.1% DivorcedFemales 13.1% Never married60.5% Now married1.0% Separated3.0% Widowed22.5% DivorcedWomen who did not give birth in the past 12 months Now married:
70.3% (518)Unmarried:
29.7% (219)
Marital status - White alone, not Hispanic / Latino population 15 years and over
Males 28.1% Never married50.2% Now married2.0% Separated5.9% Widowed13.8% DivorcedFemales 29.3% Never married37.8% Now married1.2% Separated13.5% Widowed18.2% DivorcedWomen who gave birth in the past 12 months Now married:
51.8% (159)Unmarried:
48.2% (148)
Women who did not give birth in the past 12 months Now married:
27.2% (844)Unmarried:
72.8% (2,261)
Marital status - Hispanic or Latino population 15 years and over
Males 44.1% Never married49.6% Now married0.0% Separated0.0% Widowed6.3% DivorcedFemales 34.2% Never married39.3% Now married0.0% Separated11.8% Widowed14.7% DivorcedWomen who gave birth in the past 12 months Now married:
100.0% (15)Unmarried:
0.0% (0)
Women who did not give birth in the past 12 months Now married:
43.7% (116)Unmarried:
56.3% (149)
Ancestries in Bellview
1,377 12.1% American1,124 9.9% English582 5.1% Irish498 4.4% German402 3.5% Italian165 1.4% Jamaican133 1.2% Scottish120 1.1% Polish105 0.9% French88 0.8% European60 0.5% British57 0.5% Dutch51 0.4% French Canadian51 0.4% African49 0.4% Ukrainian45 0.4% Hungarian41 0.4% Russian37 0.3% Cajun33 0.3% Canadian31 0.3% Scotch-Irish28 0.2% Australian27 0.2% Norwegian20 0.2% Finnish19 0.2% Syrian19 0.2% Czech18 0.2% Portuguese11 0.10% West Indian10 0.09% Eastern European10 0.09% Swedish10 0.09% Swiss10 0.09% Welsh8 0.07% Belgian5 0.04% Moroccan4 0.04% Pennsylvania German4 0.04% Slovene2 0.02% Danish
Geographical mobility in Bellview Same house 1 year ago 12,995 88.5% White (Caucasian)3,906 74.4% Black or African American87 67.6% American Indian / Alaska Native365 65.5% Asian7 100.0% Native Hawaiian / Pacific Islander840 92.9% Other race2,194 87.0% Two or more races12,762 89.0% White alone, not Hispanic / Latino945 74.8% Hispanic or LatinoMoved within same county 1,132 7.7% White / Caucasian942 17.9% Black or African American34 26.7% American Indian / Alaska Native108 19.4% Asian31 3.5% Other race90 3.6% Two or more races1,012 7.1% White alone, not Hispanic / Latino164 13.0% Hispanic or LatinoMoved within same state 251 1.7% White / Caucasian67 1.3% Black or African American181 7.2% Two or more races272 1.9% White alone, not Hispanic / Latino168 13.3% Hispanic or LatinoMoved from different state 334 2.3% White / Caucasian20 0.4% Black or African American94 16.8% Asian47 5.2% Other race90 3.6% Two or more races322 2.2% White alone, not Hispanic / Latino25 2.0% Hispanic or LatinoMoved from abroad 338 6.4% Black or African American4 0.7% Asian21 0.8% Two or more races17 1.4% Hispanic or Latino
Children Nativity (place of birth) in Bellview
Children under 6 years - Living with two parents Both parents native 1,143 100.0% NativeBoth parents foreign-born 32 100.0% NativeOne native, one foreign-born parent 107 100.0% NativeChildren under 6 years - Living with one parent Native parent 761 100.0% NativeChildren 6 to 17 years - Living with two parents Both parents native 947 100.0% Native0 0.0% Foreign-bornBoth parents foreign-born 52 80.9% Native12 19.1% Foreign-bornOne native, one foreign-born parent 104 79.3% Native27 20.7% Foreign-bornChildren 6 to 17 years - Living with one parent Native parent 1,557 100.0% NativeForeign-born parent 197 50.6% Native193 49.4% Foreign-born
Grandparents responsible for own grandchildren in Bellview
Grandparents (30 to 59 years) White / Caucasian 149 75.8% Responsible for grandchildren47 24.2% Not responsible for grandchildrenBlack or African American 173 100.0% Responsible for grandchildrenAsian 12 100.0% Not responsible for grandchildrenOther race 25 100.0% Not responsible for grandchildrenTwo or more races 8 5.8% Responsible for grandchildren123 94.2% Not responsible for grandchildrenWhite alone, not Hispanic / Latino 151 76.1% Responsible for grandchildren47 23.9% Not responsible for grandchildrenGrandparents (60 years and over) White / Caucasian 128 56.4% Responsible for grandchildren99 43.6% Not responsible for grandchildrenBlack or African American 74 100.0% Not responsible for grandchildrenAsian 9 100.0% Not responsible for grandchildrenTwo or more races 9 100.0% Responsible for grandchildrenWhite alone, not Hispanic / Latino 132 57.1% Responsible for grandchildren99 42.9% Not responsible for grandchildren