Races in Belleville, New Jersey (NJ) Detailed Stats
Ancestries, Foreign-born residents, place of birth

Recent posts about races in Belleville, New Jersey on our local forum with over 2,400,000 registered users:
 | What is Belleville like? (44 replies) |
| Hostility towards Asian Indians in NJ Contd (42 replies) |
| Seeking a New Town to Move to in North Jersey (6 replies) |
| Express buses to Manhattan from - Wayne, Oakland, Montville, Parsipanny, Denville, .... (18 replies) |
| Which are your favorite/least favorite NYC Close-in suburbs? (91 replies) |
| Why no entry level Single Family Homes in NJ? (55 replies) |
26.8% of Belleville, NJ residents are foreign-born (10.5% born in Latin America, 9.9% born in Asia, 5.8% born in Europe), which is 14.3% greater than the foreign-born rate of 23.0% across the entire state of New Jersey.
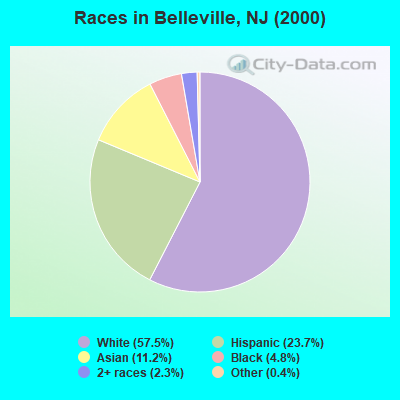
Race distribution in Belleville

- 20,66957.5%White alone
- 8,50723.7%Hispanic
- 4,02411.2%Asian alone
- 1,7084.8%Black alone
- 8352.3%Two or more races
- 1400.4%Other race alone
- 280.08%American Indian alone
- 170.05%Native Hawaiian and Other
Pacific Islander alone
2000
2022
-
- 5,557,20966.0%White alone
- 1,117,19113.3%Hispanic
- 1,096,17113.0%Black alone
- 477,0125.7%Asian alone
- 133,6891.6%Two or more races
- 19,5650.2%Other race alone
- 11,3380.1%American Indian alone
- 2,1750.03%Native Hawaiian and Other
Pacific Islander alone

-
- 4,766,47651.5%White alone
- 2,028,47021.9%Hispanic
- 1,111,63212.0%Black alone
- 923,54610.0%Asian alone
- 332,2373.6%Two or more races
- 89,8471.0%Other race alone
- 8,5570.09%American Indian alone
- 9340.01%Native Hawaiian and Other
Pacific Islander alone

Income and house value in Belleville
- Median household income in 2022
- $88,047White non-Hispanic householders
- $68,771Black householders
- $27,885American Indian and Alaska Native householders
- $127,806Asian householders
- $84,022Some other race householders
- $91,219Two or more races householders
- $89,003Hispanic or Latino race householders
- Median 2022 house value
- $383,688White Non-Hispanic householders
- $396,014Black or African American householders
- $415,683Asian householders
- $371,624Some other race householders
- $349,069Two or more races householders
- $389,457Hispanic or Latino householders
Household income for White non-Hispanic householders

Household income for Black householders

Household income for American Indian and Alaska Native householders

Household income for Asian householders

Household income for Native Hawaiian and other Pacific Islander householders

Household income for Two or more races householders

Household income for Hispanic or Latino race householders

Foreign-born residents in Belleville
9,638 residents are foreign born (10.5% Latin America, 9.9% Asia, 5.8% Europe).
| This city: | 26.8% |
| New Jersey: | 17.5% |
Ancestries in Belleville

- 14,62737.8%Other
- 11,11528.7%Italian
- 3,3718.7%Irish
- 2,4636.4%German
- 1,6114.2%Polish
- 9182.4%United States
- 7842.0%English
- 6101.6%Portuguese
- 3921.0%Arab
- 3851.0%West Indian
- 2940.8%French
- 2530.7%Russian
- 2290.6%Hungarian
- 2280.6%Scottish
- 1990.5%Subsaharan African
- 1820.5%Dutch
- 1640.4%Greek
- 1510.4%Scotch-Irish
- 1390.4%Czech
- 1220.3%Ukrainian
- 1180.3%Lithuanian
- 1030.3%French Canadian
- 960.2%Welsh
- 470.1%Slovak
- 410.1%Norwegian
- 370.10%Swedish
- 310.08%Swiss
- 140.04%Danish

Zip codes: 07109.