Races in Belleville, Illinois (IL) Detailed Stats
Data:
Races - White alone (%)
Races - White alone (% change since 2000)
Races - Black alone (%)
Races - Black alone (% change since 2000)
Races - American Indian alone (%)
Races - American Indian alone (% change since 2000)
Races - Asian alone (%)
Races - Asian alone (% change since 2000)
Races - Hispanic (%)
Races - Hispanic (% change since 2000)
Races - Native Hawaiian and Other Pacific Islander alone (%)
Races - Native Hawaiian and Other Pacific Islander alone (% change since 2000)
Races - Two or more races(%)
Races - Two or more races(% change since 2000)
Races - Other race alone (%)
Races - Other race alone (% change since 2000)
Racial diversity
Place of birth - Born in state of residence (%)
Place of birth - Born in state of residence (%) - White
Place of birth - Born in state of residence (%) - Black or African American
Place of birth - Born in state of residence (%) - Asian
Place of birth - Born in state of residence (%) - Hispanic or Latino
Place of birth - Born in state of residence (%) - American Indian and Alaska Native
Place of birth - Born in state of residence (%) - Multirace
Place of birth - Born in state of residence (%) - Other Race
Place of birth - Born in other state (%)
Place of birth - Born in other state (%) - White
Place of birth - Born in other state (%) - Black or African American
Place of birth - Born in other state (%) - Asian
Place of birth - Born in other state (%) - Hispanic or Latino
Place of birth - Born in other state (%) - American Indian and Alaska Native
Place of birth - Born in other state (%) - Multirace
Place of birth - Born in other state (%) - Other Race
Place of birth - Native, outside of US (%)
Place of birth - Native, outside of US (%) - White
Place of birth - Native, outside of US (%) - Black or African American
Place of birth - Native, outside of US (%) - Asian
Place of birth - Native, outside of US (%) - Hispanic or Latino
Place of birth - Native, outside of US (%) - American Indian and Alaska Native
Place of birth - Native, outside of US (%) - Multirace
Place of birth - Native, outside of US (%) - Other Race
Place of birth - Foreign born (%)
Place of birth - Foreign born (%) - White
Place of birth - Foreign born (%) - Black or African American
Place of birth - Foreign born (%) - Asian
Place of birth - Foreign born (%) - Hispanic or Latino
Place of birth - Foreign born (%) - American Indian and Alaska Native
Place of birth - Foreign born (%) - Multirace
Place of birth - Foreign born (%) - Other Race
Residents speaking English at home (%)
Residents speaking English at home - Born in the United States (%)
Residents speaking English at home - Native, born elsewhere (%)
Residents speaking English at home - Foreign born (%)
Residents speaking Spanish at home (%)
Residents speaking Spanish at home - Born in the United States (%)
Residents speaking Spanish at home - Native, born elsewhere (%)
Residents speaking Spanish at home - Foreign born (%)
Residents speaking other language at home (%)
Residents speaking other language at home - Born in the United States (%)
Residents speaking other language at home - Native, born elsewhere (%)
Residents speaking other language at home - Foreign born (%)
Marital status - Never married (%)
Marital status - Now married (%)
Marital status - Separated (%)
Marital status - Widowed (%)
Marital status - Divorced (%)
Ancestries Reported - Arab (%)
Ancestries Reported - Czech (%)
Ancestries Reported - Danish (%)
Ancestries Reported - Dutch (%)
Ancestries Reported - English (%)
Ancestries Reported - French (%)
Ancestries Reported - French Canadian (%)
Ancestries Reported - German (%)
Ancestries Reported - Greek (%)
Ancestries Reported - Hungarian (%)
Ancestries Reported - Irish (%)
Ancestries Reported - Italian (%)
Ancestries Reported - Lithuanian (%)
Ancestries Reported - Norwegian (%)
Ancestries Reported - Polish (%)
Ancestries Reported - Portuguese (%)
Ancestries Reported - Russian (%)
Ancestries Reported - Scotch-Irish (%)
Ancestries Reported - Scottish (%)
Ancestries Reported - Slovak (%)
Ancestries Reported - Subsaharan African (%)
Ancestries Reported - Swedish (%)
Ancestries Reported - Swiss (%)
Ancestries Reported - Ukrainian (%)
Ancestries Reported - United States (%)
Ancestries Reported - Welsh (%)
Ancestries Reported - West Indian (%)
Ancestries Reported - Other (%)
Geographical mobility - Same house 1 year ago (%)
Geographical mobility - Same house 1 year ago (%) - White
Geographical mobility - Same house 1 year ago (%) - Black or African American
Geographical mobility - Same house 1 year ago (%) - Asian
Geographical mobility - Same house 1 year ago (%) - Hispanic or Latino
Geographical mobility - Same house 1 year ago (%) - American Indian and Alaska Native
Geographical mobility - Same house 1 year ago (%) - Multirace
Geographical mobility - Same house 1 year ago (%) - Other Race
Geographical mobility - Moved within same county (%)
Geographical mobility - Moved within same county (%) - White
Geographical mobility - Moved within same county (%) - Black or African American
Geographical mobility - Moved within same county (%) - Asian
Geographical mobility - Moved within same county (%) - Hispanic or Latino
Geographical mobility - Moved within same county (%) - American Indian and Alaska Native
Geographical mobility - Moved within same county (%) - Multirace
Geographical mobility - Moved within same county (%) - Other Race
Geographical mobility - Moved from different county within same state (%)
Geographical mobility - Moved from different county within same state (%) - White
Geographical mobility - Moved from different county within same state (%) - Black or African American
Geographical mobility - Moved from different county within same state (%) - Asian
Geographical mobility - Moved from different county within same state (%) - Hispanic or Latino
Geographical mobility - Moved from different county within same state (%) - American Indian and Alaska Native
Geographical mobility - Moved from different county within same state (%) - Multirace
Geographical mobility - Moved from different county within same state (%) - Other Race
Geographical mobility - Moved from different state (%)
Geographical mobility - Moved from different state (%) - White
Geographical mobility - Moved from different state (%) - Black or African American
Geographical mobility - Moved from different state (%) - Asian
Geographical mobility - Moved from different state (%) - Hispanic or Latino
Geographical mobility - Moved from different state (%) - American Indian and Alaska Native
Geographical mobility - Moved from different state (%) - Multirace
Geographical mobility - Moved from different state (%) - Other Race
Geographical mobility - Moved from abroad (%)
Geographical mobility - Moved from abroad (%) - White
Geographical mobility - Moved from abroad (%) - Black or African American
Geographical mobility - Moved from abroad (%) - Asian
Geographical mobility - Moved from abroad (%) - Hispanic or Latino
Geographical mobility - Moved from abroad (%) - American Indian and Alaska Native
Geographical mobility - Moved from abroad (%) - Multirace
Geographical mobility - Moved from abroad (%) - Other Race
Place of birth for the foreign-born population - Ireland (%)
Place of birth for the foreign-born population - Denmark (%)
Place of birth for the foreign-born population - Norway (%)
Place of birth for the foreign-born population - Sweden (%)
Place of birth for the foreign-born population - United Kingdom (%)
Place of birth for the foreign-born population - England (%)
Place of birth for the foreign-born population - Scotland (%)
Place of birth for the foreign-born population - Other Northern Europe (%)
Place of birth for the foreign-born population - Austria (%)
Place of birth for the foreign-born population - Belgium (%)
Place of birth for the foreign-born population - France (%)
Place of birth for the foreign-born population - Germany (%)
Place of birth for the foreign-born population - Netherlands (%)
Place of birth for the foreign-born population - Switzerland (%)
Place of birth for the foreign-born population - Other Western Europe (%)
Place of birth for the foreign-born population - Greece (%)
Place of birth for the foreign-born population - Italy (%)
Place of birth for the foreign-born population - Portugal (%)
Place of birth for the foreign-born population - Spain (%)
Place of birth for the foreign-born population - Other Southern Europe (%)
Place of birth for the foreign-born population - Albania (%)
Place of birth for the foreign-born population - Belarus (%)
Place of birth for the foreign-born population - Bosnia and Herzegovina (%)
Place of birth for the foreign-born population - Bulgaria (%)
Place of birth for the foreign-born population - Croatia (%)
Place of birth for the foreign-born population - Czechoslovakia (%)
Place of birth for the foreign-born population - Hungary (%)
Place of birth for the foreign-born population - Latvia (%)
Place of birth for the foreign-born population - Lithuania (%)
Place of birth for the foreign-born population - North Macedonia (Macedonia) (%)
Place of birth for the foreign-born population - Moldova (%)
Place of birth for the foreign-born population - Poland (%)
Place of birth for the foreign-born population - Romania (%)
Place of birth for the foreign-born population - Russia (%)
Place of birth for the foreign-born population - Serbia (%)
Place of birth for the foreign-born population - Ukraine (%)
Place of birth for the foreign-born population - Other Eastern Europe (%)
Place of birth for the foreign-born population - China (%)
Place of birth for the foreign-born population - Hong Kong (%)
Place of birth for the foreign-born population - Taiwan (%)
Place of birth for the foreign-born population - Japan (%)
Place of birth for the foreign-born population - Korea (%)
Place of birth for the foreign-born population - Other Eastern Asia (%)
Place of birth for the foreign-born population - Afghanistan (%)
Place of birth for the foreign-born population - Bangladesh (%)
Place of birth for the foreign-born population - India (%)
Place of birth for the foreign-born population - Iran (%)
Place of birth for the foreign-born population - Kazakhstan (%)
Place of birth for the foreign-born population - Nepal (%)
Place of birth for the foreign-born population - Pakistan (%)
Place of birth for the foreign-born population - Sri Lanka (%)
Place of birth for the foreign-born population - Uzbekistan (%)
Place of birth for the foreign-born population - Other South Central Asia (%)
Place of birth for the foreign-born population - Burma (%)
Place of birth for the foreign-born population - Cambodia (%)
Place of birth for the foreign-born population - Indonesia (%)
Place of birth for the foreign-born population - Laos (%)
Place of birth for the foreign-born population - Malaysia (%)
Place of birth for the foreign-born population - Philippines (%)
Place of birth for the foreign-born population - Singapore (%)
Place of birth for the foreign-born population - Thailand (%)
Place of birth for the foreign-born population - Vietnam (%)
Place of birth for the foreign-born population - Other South Eastern Asia (%)
Place of birth for the foreign-born population - Armenia (%)
Place of birth for the foreign-born population - Iraq (%)
Place of birth for the foreign-born population - Israel (%)
Place of birth for the foreign-born population - Jordan (%)
Place of birth for the foreign-born population - Kuwait (%)
Place of birth for the foreign-born population - Lebanon (%)
Place of birth for the foreign-born population - Saudi Arabia (%)
Place of birth for the foreign-born population - Syria (%)
Place of birth for the foreign-born population - Turkey (%)
Place of birth for the foreign-born population - Yemen (%)
Place of birth for the foreign-born population - Other Western Asia (%)
Place of birth for the foreign-born population - Eritrea (%)
Place of birth for the foreign-born population - Ethiopia (%)
Place of birth for the foreign-born population - Kenya (%)
Place of birth for the foreign-born population - Somalia (%)
Place of birth for the foreign-born population - Uganda (%)
Place of birth for the foreign-born population - Zimbabwe (%)
Place of birth for the foreign-born population - Other Eastern Africa (%)
Place of birth for the foreign-born population - Cameroon (%)
Place of birth for the foreign-born population - Congo (%)
Place of birth for the foreign-born population - Democratic Republic of Congo (Zaire) (%)
Place of birth for the foreign-born population - Other Middle Africa (%)
Place of birth for the foreign-born population - Egypt (%)
Place of birth for the foreign-born population - Morocco (%)
Place of birth for the foreign-born population - Sudan (%)
Place of birth for the foreign-born population - Other Northern Africa (%)
Place of birth for the foreign-born population - South Africa (%)
Place of birth for the foreign-born population - Other Southern Africa (%)
Place of birth for the foreign-born population - Cabo Verde (%)
Place of birth for the foreign-born population - Ghana (%)
Place of birth for the foreign-born population - Liberia (%)
Place of birth for the foreign-born population - Nigeria (%)
Place of birth for the foreign-born population - Senegal (%)
Place of birth for the foreign-born population - Sierra Leone (%)
Place of birth for the foreign-born population - Other Western Africa (%)
Place of birth for the foreign-born population - Australia (%)
Place of birth for the foreign-born population - New Zealand (%)
Place of birth for the foreign-born population - Fiji (%)
Place of birth for the foreign-born population - Micronesia (%)
Place of birth for the foreign-born population - Bahamas (%)
Place of birth for the foreign-born population - Barbados (%)
Place of birth for the foreign-born population - Cuba (%)
Place of birth for the foreign-born population - Dominica (%)
Place of birth for the foreign-born population - Dominican Republic (%)
Place of birth for the foreign-born population - Grenada (%)
Place of birth for the foreign-born population - Haiti (%)
Place of birth for the foreign-born population - Jamaica (%)
Place of birth for the foreign-born population - St. Vincent and the Grenadines (%)
Place of birth for the foreign-born population - Trinidad and Tobago (%)
Place of birth for the foreign-born population - West Indies (%)
Place of birth for the foreign-born population - Other Caribbean (%)
Place of birth for the foreign-born population - Belize (%)
Place of birth for the foreign-born population - Costa Rica (%)
Place of birth for the foreign-born population - El Salvador (%)
Place of birth for the foreign-born population - Guatemala (%)
Place of birth for the foreign-born population - Honduras (%)
Place of birth for the foreign-born population - Mexico (%)
Place of birth for the foreign-born population - Nicaragua (%)
Place of birth for the foreign-born population - Panama (%)
Place of birth for the foreign-born population - Other Central America (%)
Place of birth for the foreign-born population - Argentina (%)
Place of birth for the foreign-born population - Bolivia (%)
Place of birth for the foreign-born population - Brazil (%)
Place of birth for the foreign-born population - Chile (%)
Place of birth for the foreign-born population - Colombia (%)
Place of birth for the foreign-born population - Ecuador (%)
Place of birth for the foreign-born population - Guyana (%)
Place of birth for the foreign-born population - Peru (%)
Place of birth for the foreign-born population - Uruguay (%)
Place of birth for the foreign-born population - Venezuela (%)
Place of birth for the foreign-born population - Other South America (%)
Place of birth for the foreign-born population - Canada (%)
Place of birth for the foreign-born population - Other Northern America (%)
Place of birth for the foreign-born population - Other (%)
Latest news about races in Belleville, IL collected exclusively by city-data.com from local newspapers, TV, and radio stations
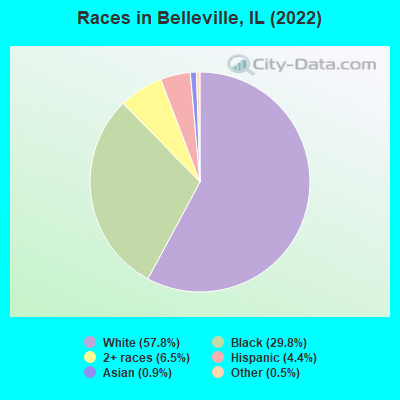
According to 2022 data, the most numerous races in Belleville, IL are White alone (23,983 residents), Hispanic (1,810 residents), and Black alone (12,358 residents). 95.4% of Belleville residents speak English at home. 3.1% of Belleville, IL residents are foreign-born (1.5% born in Asia, 1.2% born in Latin America), which is 358.3% less than the foreign-born rate of 14.0% across the entire state of Illinois.
Race distribution in Belleville
2000 2022
8,424,140 67.8% White alone 1,856,152 14.9% Black alone 1,530,262 12.3% Hispanic 419,916 3.4% Asian alone 153,996 1.2% Two or more races 13,479 0.1% Other race alone 18,232 0.1% American Indian alone 3,116 0.03% Native Hawaiian and Other
7,356,301 58.5% White alone 2,299,726 18.3% Hispanic 1,660,423 13.2% Black alone 747,296 5.9% Asian alone 458,599 3.6% Two or more races 45,386 0.4% Other race alone 10,405 0.08% American Indian alone 3,896 0.03% Native Hawaiian and Other
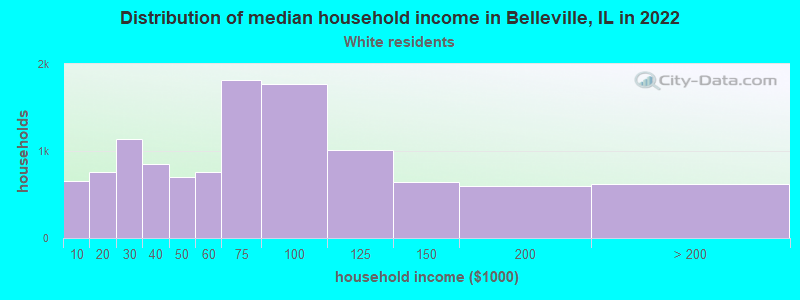
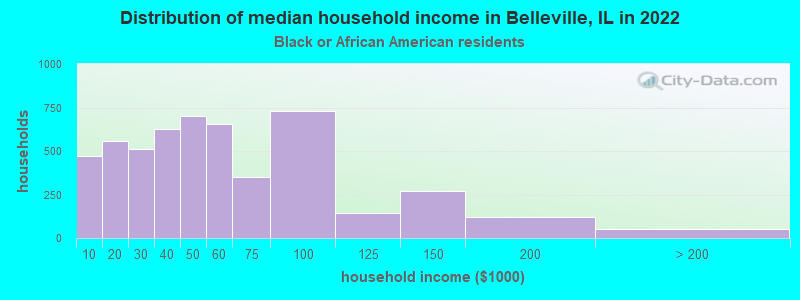
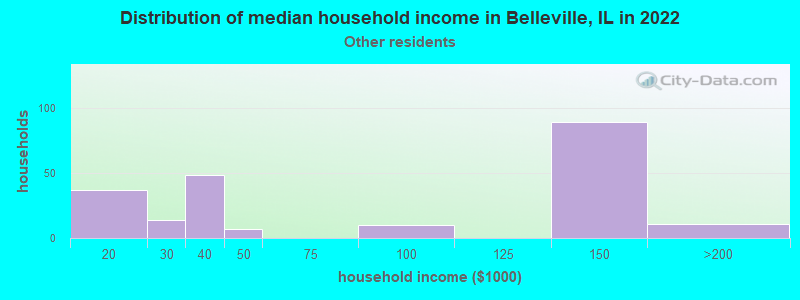
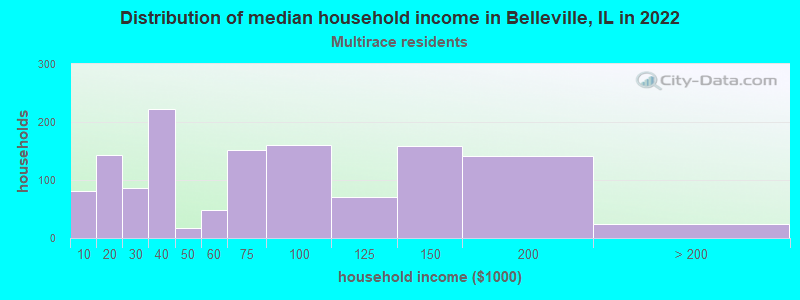
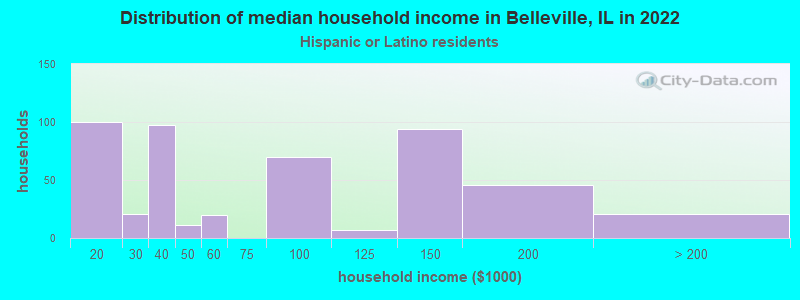
Income and house value in Belleville Median household income in 2022 $64,840 White non-Hispanic householders$48,661 Black householders$53,218 Asian householders$60,840 Two or more races householdersMedian 2022 house value $132,057 White Non-Hispanic householders$145,471 Black or African American householders$141,692 American Indian or Alaska Native householders $224,441 Asian householders$155,862 Some other race householders$115,999 Two or more races householders$134,702 Hispanic or Latino householders
Median age by race in Belleville
44.7 Median age for White residents43.5 45.3 32.6 Median age for Black or African American residents31.9 31.9 96.5 Median age for American Indian / Alaska Native residents89.1 -688,956,432.9 42.9 Median age for Asian residents58.9 36.8 -593,236,714.4 Median age for Native Hawaiian / Pacific Islander residents-666,666,666.0 -576,015,108.0 23.5 Median age for Other race residents43.5 11.2 31.4 Median age for Two or more races residents28.6 39.2 44.4 Median age for White alone residents43.2 45.2 22.8 Median age for Hispanic or Latino residents27.6 14.7
Owner/renter occupied households by race in Belleville
House owners and renters - White residents 8,648 76.8% Owner occupied2,615 23.2% Renter occupiedHouse owners and renters - Black or African American residents 1,752 37.3% Owner occupied2,944 62.7% Renter occupiedHouse owners and renters - American Indian / Alaska Native residents 34 100.0% Owner occupiedHouse owners and renters - Asian residents 129 52.9% Owner occupied115 47.1% Renter occupiedHouse owners and renters - Other race residents 125 49.5% Owner occupied127 50.5% Renter occupiedHouse owners and renters - Two or more races residents 595 50.8% Owner occupied576 49.2% Renter occupiedHouse owners and renters - White alone residents 8,691 76.7% Owner occupied2,647 23.3% Renter occupiedHouse owners and renters - Hispanic or Latino residents 220 44.4% Owner occupied275 55.6% Renter occupied
Language usage in Belleville
English speakers - Total 95.4% of residents of Belleville speak English at home.
1.9% of residents speak Spanish at home 418 55.5% Speak English very well335 44.5% Speak English less than very well2.5% of residents speak other language at home 602 62.5% Speak English very well361 37.5% Speak English less than very well
English speakers - Born in the United States 97.5% of residents of Belleville speak English at home.
0.6% of residents speak Spanish at home 76 100.0% Speak English very well0.8% of residents speak other language at home 79 85.9% Speak English very well13 14.1% Speak English less than very well
English speakers - Native, born elsewhere 90.1% of residents of Belleville speak English at home.
11.3% of residents speak Spanish at home 46 100.0% Speak English less than very well3.2% of residents speak other language at home 13 100.0% Speak English very well
English speakers - Foreign-born 20.1% of residents of Belleville speak English at home.
21.3% of residents speak Spanish at home 104 40.8% Speak English very well151 59.2% Speak English less than very well59.0% of residents speak other language at home 409 57.9% Speak English very well298 42.1% Speak English less than very well
White (Caucasian) - Speak only English Native:
99.3% (22,522)Foreign-born:
35.7% (153)
White (Caucasian) - Speak another language Native:
0.9% (203)Foreign-born:
56.3% (242)
Black or African American - Speak only English Native:
97.6% (11,049)Foreign-born:
65.3% (108)
Black or African American - Speak another language Native:
2.4% (267)Foreign-born:
39.4% (65)
Asian - Speak only English Native:
40.1% (14)Foreign-born:
13.4% (47)
Asian - Speak another language Native:
61.9% (21)Foreign-born:
100.0% (351)
Other race - Speak only English Native:
78.0% (617)Foreign-born:
0.7% (1)
Other race - Speak another language Native:
21.9% (173)Foreign-born:
100.0% (153)
Two or more races - Speak only English Native:
94.7% (3,000)Foreign-born:
32.0% (44)
Two or more races - Speak another language Native:
3.5% (112)Foreign-born:
42.5% (59)
White alone - Speak only English Native:
99.0% (22,432)Foreign-born:
26.5% (132)
White alone - Speak another language Native:
1.0% (232)Foreign-born:
67.0% (332)
Hispanic or Latino - Speak only English Native:
78.2% (991)Foreign-born:
32.6% (93)
Hispanic or Latino - Speak another language Native:
21.5% (272)Foreign-born:
86.4% (246)
Foreign-born residents in Belleville 1,267 residents are foreign born (1.5% Asia , 1.2% Latin America ).
This city:
3.1%Illinois:
14.1%
Marital status for residents in Belleville Marital status - White (Caucasian) population 15 years and over
Males 38.5% Never married49.0% Now married0.6% Separated2.3% Widowed9.5% DivorcedFemales 28.1% Never married45.1% Now married0.9% Separated11.5% Widowed14.5% DivorcedWomen who gave birth in the past 12 months Now married:
89.6% (128)Unmarried:
10.4% (15)
Women who did not give birth in the past 12 months Now married:
44.4% (2,267)Unmarried:
55.6% (2,844)
Marital status - Black or African American population 15 years and over
Males 48.5% Never married31.2% Now married6.0% Separated1.6% Widowed12.6% DivorcedFemales 54.3% Never married22.9% Now married4.1% Separated5.1% Widowed13.6% DivorcedWomen who gave birth in the past 12 months Now married:
32.1% (72)Unmarried:
67.9% (152)
Women who did not give birth in the past 12 months Now married:
24.1% (845)Unmarried:
75.9% (2,666)
Marital status - American Indian / Alaska Native population 15 years and over
Males 0.0% Never married97.5% Now married0.0% Separated0.0% Widowed2.5% DivorcedFemales 0.0% Never married100.0% Now married0.0% Separated0.0% Widowed0.0% DivorcedWomen who did not give birth in the past 12 months Now married:
100.0% (25)Unmarried:
0.0% (0)
Marital status - Asian population 15 years and over
Males 30.8% Never married59.4% Now married0.0% Separated0.0% Widowed9.8% DivorcedFemales 8.3% Never married71.0% Now married0.0% Separated10.1% Widowed10.7% DivorcedWomen who gave birth in the past 12 months Now married:
100.0% (30)Unmarried:
0.0% (0)
Women who did not give birth in the past 12 months Now married:
59.2% (45)Unmarried:
40.8% (31)
Marital status - Other race population 15 years and over
Males 8.8% Never married53.0% Now married15.5% Separated1.0% Widowed21.6% DivorcedFemales 41.7% Never married58.3% Now married0.0% Separated0.0% Widowed0.0% DivorcedWomen who did not give birth in the past 12 months Now married:
52.8% (88)Unmarried:
47.2% (79)
Marital status - Two or more races population 15 years and over
Males 58.1% Never married27.0% Now married2.2% Separated0.0% Widowed12.7% DivorcedFemales 38.7% Never married35.4% Now married0.9% Separated6.6% Widowed18.3% DivorcedWomen who gave birth in the past 12 months Now married:
0.0% (0)Unmarried:
100.0% (21)
Women who did not give birth in the past 12 months Now married:
40.5% (287)Unmarried:
59.5% (421)
Marital status - White alone, not Hispanic / Latino population 15 years and over
Males 38.1% Never married49.3% Now married0.6% Separated2.4% Widowed9.6% DivorcedFemales 28.3% Never married44.6% Now married0.9% Separated11.6% Widowed14.6% DivorcedWomen who gave birth in the past 12 months Now married:
89.6% (134)Unmarried:
10.4% (15)
Women who did not give birth in the past 12 months Now married:
43.5% (2,261)Unmarried:
56.5% (2,935)
Marital status - Hispanic or Latino population 15 years and over
Males 22.8% Never married57.3% Now married9.3% Separated0.0% Widowed10.6% DivorcedFemales 13.2% Never married65.6% Now married0.0% Separated5.7% Widowed15.5% DivorcedWomen who did not give birth in the past 12 months Now married:
68.2% (245)Unmarried:
31.8% (115)
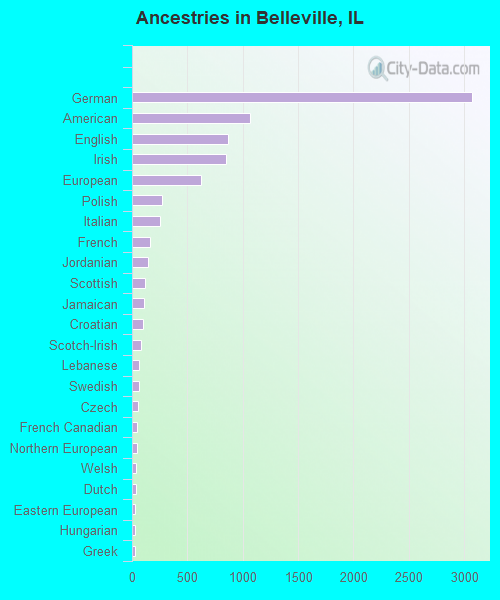
Ancestries in Belleville
3,070 15.9% German1,064 5.5% American871 4.5% English851 4.4% Irish626 3.2% European269 1.4% Polish254 1.3% Italian162 0.8% French140 0.7% Jordanian114 0.6% Scottish104 0.5% Jamaican98 0.5% Croatian78 0.4% Scotch-Irish63 0.3% Lebanese62 0.3% Swedish51 0.3% Czech44 0.2% French Canadian42 0.2% Northern European39 0.2% Welsh35 0.2% Dutch31 0.2% Eastern European30 0.2% Hungarian28 0.1% Greek25 0.1% Guyanese24 0.1% British22 0.1% African19 0.10% Slavic16 0.08% Norwegian15 0.08% Scandinavian13 0.07% Luxembourger13 0.07% Portuguese6 0.03% Russian6 0.03% Turkish3 0.02% Lithuanian
Geographical mobility in Belleville Same house 1 year ago 22,235 92.7% White (Caucasian)9,816 80.9% Black or African American60 61.7% American Indian / Alaska Native327 84.2% Asian922 100.0% Other race3,318 85.7% Two or more races22,233 92.8% White alone, not Hispanic / Latino1,498 86.7% Hispanic or LatinoMoved within same county 754 3.1% White / Caucasian2,224 18.3% Black or African American5 1.3% Asian63 94.6% Native Hawaiian / Pacific Islander379 9.8% Two or more races756 3.2% White alone, not Hispanic / Latino130 7.5% Hispanic or LatinoMoved within same state 517 2.2% White / Caucasian118 1.0% Black or African American41 41.8% American Indian / Alaska Native65 1.7% Two or more races518 2.2% White alone, not Hispanic / Latino36 2.1% Hispanic or LatinoMoved from different state 504 2.1% White / Caucasian253 2.1% Black or African American33 8.5% Asian1 0.1% Other race105 2.7% Two or more races456 1.9% White alone, not Hispanic / Latino68 3.9% Hispanic or LatinoMoved from abroad 33 0.1% White22 5.6% Asian36 0.2% White alone, not Hispanic / Latino
Children Nativity (place of birth) in Belleville
Children under 6 years - Living with two parents Both parents native 1,106 99.4% Native7 0.6% Foreign-bornBoth parents foreign-born 75 89.3% Native9 10.7% Foreign-bornOne native, one foreign-born parent 41 100.0% NativeChildren under 6 years - Living with one parent Native parent 1,205 100.0% NativeForeign-born parent 15 100.0% NativeChildren 6 to 17 years - Living with two parents Both parents native 2,523 100.0% NativeBoth parents foreign-born 98 33.4% Native195 66.6% Foreign-bornOne native, one foreign-born parent 362 90.4% Native38 9.6% Foreign-bornChildren 6 to 17 years - Living with one parent Native parent 2,829 100.0% NativeForeign-born parent 183 50.8% Native178 49.2% Foreign-born
Grandparents responsible for own grandchildren in Belleville
Grandparents (30 to 59 years) White / Caucasian 171 75.9% Responsible for grandchildren54 24.1% Not responsible for grandchildrenBlack or African American 62 28.2% Responsible for grandchildren157 71.8% Not responsible for grandchildrenAsian 14 100.0% Not responsible for grandchildrenWhite alone, not Hispanic / Latino 171 78.3% Responsible for grandchildren47 21.7% Not responsible for grandchildrenHispanic or Latino 20 100.0% Not responsible for grandchildrenGrandparents (60 years and over) White / Caucasian 38 42.9% Responsible for grandchildren50 57.1% Not responsible for grandchildrenBlack or African American 108 94.5% Responsible for grandchildren6 5.5% Not responsible for grandchildrenWhite alone, not Hispanic / Latino 40 44.3% Responsible for grandchildren51 55.7% Not responsible for grandchildren