Races in Belfair, Washington (WA) Detailed Stats
Ancestries, Foreign-born residents, place of birth

Data:
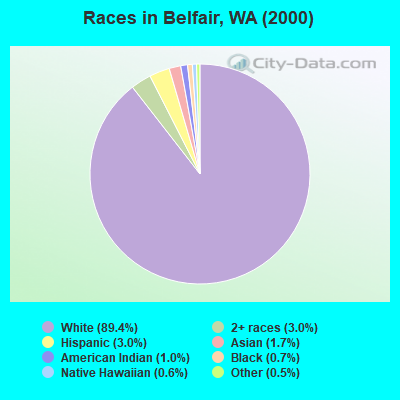
Race distribution in Belfair

- 4,85389.4%White alone
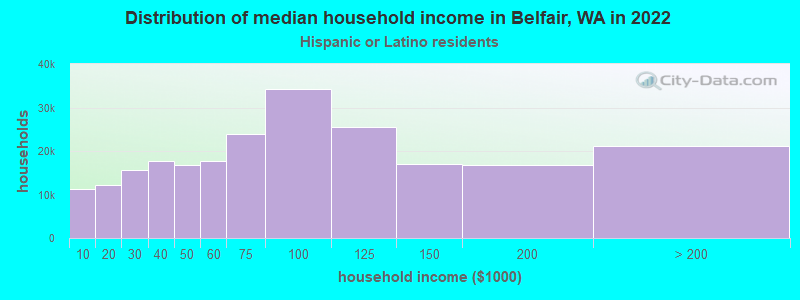
- 1613.0%Hispanic
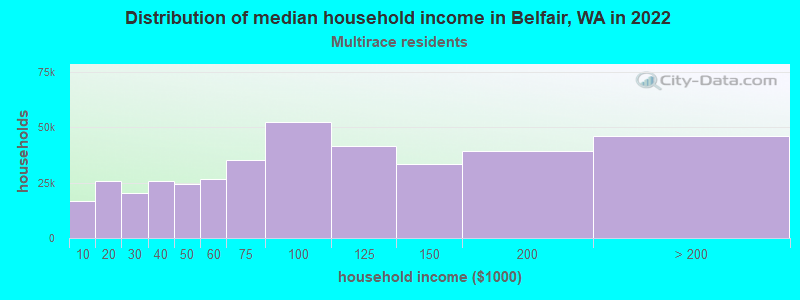
- 1623.0%Two or more races
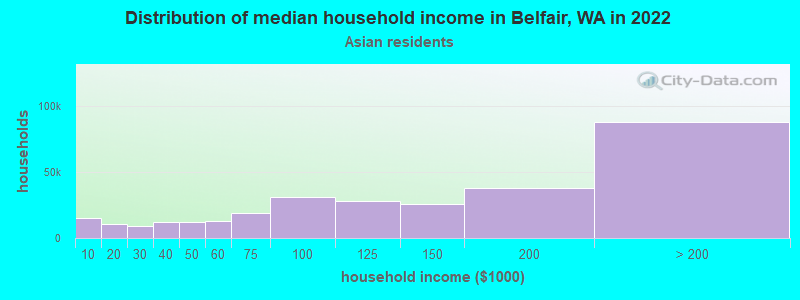
- 931.7%Asian alone
- 541.0%American Indian alone
- 390.7%Black alone
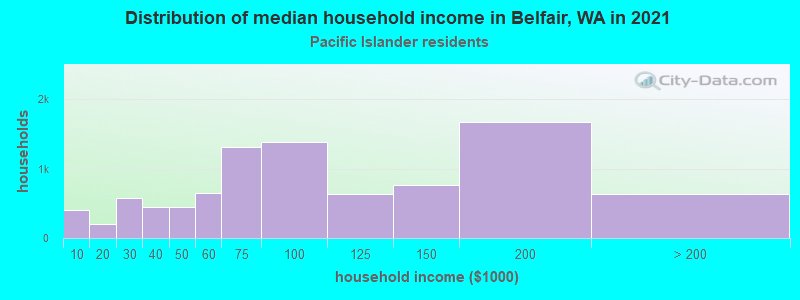
- 350.6%Native Hawaiian and Other
Pacific Islander alone
- 290.5%Other race alone
2000
2022
-
- 4,652,49078.9%White alone
- 441,5097.5%Hispanic
- 319,4015.4%Asian alone
- 184,6313.1%Black alone
- 175,9263.0%Two or more races
- 85,3961.4%American Indian alone
- 22,7790.4%Native Hawaiian and Other
Pacific Islander alone
- 11,9890.2%Other race alone
-
- 4,941,45663.5%White alone
- 1,093,31314.0%Hispanic
- 755,8329.7%Asian alone
- 523,4486.7%Two or more races
- 299,5373.8%Black alone
- 69,0240.9%American Indian alone
- 52,2310.7%Native Hawaiian and Other
Pacific Islander alone
- 50,9450.7%Other race alone
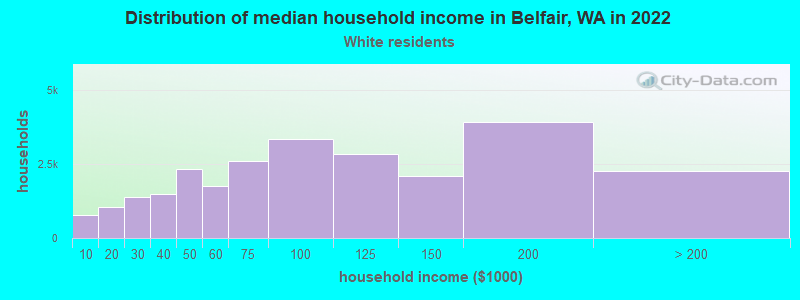
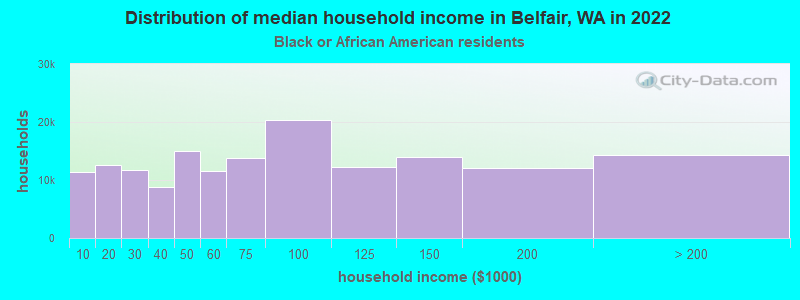
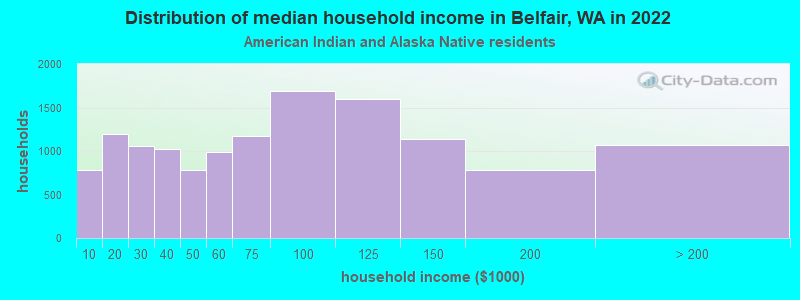
Income and house value in Belfair
- Median household income in 2022
- $95,078White non-Hispanic householders
- $61,395Black householders
- $52,865American Indian and Alaska Native householders
- $90,108Some other race householders
- $133,046Two or more races householders
- $148,088Hispanic or Latino race householders
- Median 2022 house value
- $613,642White Non-Hispanic householders
- $434,648Black or African American householders
- $408,619American Indian or Alaska Native householders
- $623,982Asian householders
- $534,842Some other race householders
- over $1,000,000Two or more races householders
- $506,317Hispanic or Latino householders