Races in Belen, New Mexico (NM) Detailed Stats
Data:
Races - White alone (%)
Races - White alone (% change since 2000)
Races - Black alone (%)
Races - Black alone (% change since 2000)
Races - American Indian alone (%)
Races - American Indian alone (% change since 2000)
Races - Asian alone (%)
Races - Asian alone (% change since 2000)
Races - Hispanic (%)
Races - Hispanic (% change since 2000)
Races - Native Hawaiian and Other Pacific Islander alone (%)
Races - Native Hawaiian and Other Pacific Islander alone (% change since 2000)
Races - Two or more races(%)
Races - Two or more races(% change since 2000)
Races - Other race alone (%)
Races - Other race alone (% change since 2000)
Racial diversity
Place of birth - Born in state of residence (%)
Place of birth - Born in state of residence (%) - White
Place of birth - Born in state of residence (%) - Black or African American
Place of birth - Born in state of residence (%) - Asian
Place of birth - Born in state of residence (%) - Hispanic or Latino
Place of birth - Born in state of residence (%) - American Indian and Alaska Native
Place of birth - Born in state of residence (%) - Multirace
Place of birth - Born in state of residence (%) - Other Race
Place of birth - Born in other state (%)
Place of birth - Born in other state (%) - White
Place of birth - Born in other state (%) - Black or African American
Place of birth - Born in other state (%) - Asian
Place of birth - Born in other state (%) - Hispanic or Latino
Place of birth - Born in other state (%) - American Indian and Alaska Native
Place of birth - Born in other state (%) - Multirace
Place of birth - Born in other state (%) - Other Race
Place of birth - Native, outside of US (%)
Place of birth - Native, outside of US (%) - White
Place of birth - Native, outside of US (%) - Black or African American
Place of birth - Native, outside of US (%) - Asian
Place of birth - Native, outside of US (%) - Hispanic or Latino
Place of birth - Native, outside of US (%) - American Indian and Alaska Native
Place of birth - Native, outside of US (%) - Multirace
Place of birth - Native, outside of US (%) - Other Race
Place of birth - Foreign born (%)
Place of birth - Foreign born (%) - White
Place of birth - Foreign born (%) - Black or African American
Place of birth - Foreign born (%) - Asian
Place of birth - Foreign born (%) - Hispanic or Latino
Place of birth - Foreign born (%) - American Indian and Alaska Native
Place of birth - Foreign born (%) - Multirace
Place of birth - Foreign born (%) - Other Race
Residents speaking English at home (%)
Residents speaking English at home - Born in the United States (%)
Residents speaking English at home - Native, born elsewhere (%)
Residents speaking English at home - Foreign born (%)
Residents speaking Spanish at home (%)
Residents speaking Spanish at home - Born in the United States (%)
Residents speaking Spanish at home - Native, born elsewhere (%)
Residents speaking Spanish at home - Foreign born (%)
Residents speaking other language at home (%)
Residents speaking other language at home - Born in the United States (%)
Residents speaking other language at home - Native, born elsewhere (%)
Residents speaking other language at home - Foreign born (%)
Marital status - Never married (%)
Marital status - Now married (%)
Marital status - Separated (%)
Marital status - Widowed (%)
Marital status - Divorced (%)
Ancestries Reported - Arab (%)
Ancestries Reported - Czech (%)
Ancestries Reported - Danish (%)
Ancestries Reported - Dutch (%)
Ancestries Reported - English (%)
Ancestries Reported - French (%)
Ancestries Reported - French Canadian (%)
Ancestries Reported - German (%)
Ancestries Reported - Greek (%)
Ancestries Reported - Hungarian (%)
Ancestries Reported - Irish (%)
Ancestries Reported - Italian (%)
Ancestries Reported - Lithuanian (%)
Ancestries Reported - Norwegian (%)
Ancestries Reported - Polish (%)
Ancestries Reported - Portuguese (%)
Ancestries Reported - Russian (%)
Ancestries Reported - Scotch-Irish (%)
Ancestries Reported - Scottish (%)
Ancestries Reported - Slovak (%)
Ancestries Reported - Subsaharan African (%)
Ancestries Reported - Swedish (%)
Ancestries Reported - Swiss (%)
Ancestries Reported - Ukrainian (%)
Ancestries Reported - United States (%)
Ancestries Reported - Welsh (%)
Ancestries Reported - West Indian (%)
Ancestries Reported - Other (%)
Geographical mobility - Same house 1 year ago (%)
Geographical mobility - Same house 1 year ago (%) - White
Geographical mobility - Same house 1 year ago (%) - Black or African American
Geographical mobility - Same house 1 year ago (%) - Asian
Geographical mobility - Same house 1 year ago (%) - Hispanic or Latino
Geographical mobility - Same house 1 year ago (%) - American Indian and Alaska Native
Geographical mobility - Same house 1 year ago (%) - Multirace
Geographical mobility - Same house 1 year ago (%) - Other Race
Geographical mobility - Moved within same county (%)
Geographical mobility - Moved within same county (%) - White
Geographical mobility - Moved within same county (%) - Black or African American
Geographical mobility - Moved within same county (%) - Asian
Geographical mobility - Moved within same county (%) - Hispanic or Latino
Geographical mobility - Moved within same county (%) - American Indian and Alaska Native
Geographical mobility - Moved within same county (%) - Multirace
Geographical mobility - Moved within same county (%) - Other Race
Geographical mobility - Moved from different county within same state (%)
Geographical mobility - Moved from different county within same state (%) - White
Geographical mobility - Moved from different county within same state (%) - Black or African American
Geographical mobility - Moved from different county within same state (%) - Asian
Geographical mobility - Moved from different county within same state (%) - Hispanic or Latino
Geographical mobility - Moved from different county within same state (%) - American Indian and Alaska Native
Geographical mobility - Moved from different county within same state (%) - Multirace
Geographical mobility - Moved from different county within same state (%) - Other Race
Geographical mobility - Moved from different state (%)
Geographical mobility - Moved from different state (%) - White
Geographical mobility - Moved from different state (%) - Black or African American
Geographical mobility - Moved from different state (%) - Asian
Geographical mobility - Moved from different state (%) - Hispanic or Latino
Geographical mobility - Moved from different state (%) - American Indian and Alaska Native
Geographical mobility - Moved from different state (%) - Multirace
Geographical mobility - Moved from different state (%) - Other Race
Geographical mobility - Moved from abroad (%)
Geographical mobility - Moved from abroad (%) - White
Geographical mobility - Moved from abroad (%) - Black or African American
Geographical mobility - Moved from abroad (%) - Asian
Geographical mobility - Moved from abroad (%) - Hispanic or Latino
Geographical mobility - Moved from abroad (%) - American Indian and Alaska Native
Geographical mobility - Moved from abroad (%) - Multirace
Geographical mobility - Moved from abroad (%) - Other Race
Place of birth for the foreign-born population - Ireland (%)
Place of birth for the foreign-born population - Denmark (%)
Place of birth for the foreign-born population - Norway (%)
Place of birth for the foreign-born population - Sweden (%)
Place of birth for the foreign-born population - United Kingdom (%)
Place of birth for the foreign-born population - England (%)
Place of birth for the foreign-born population - Scotland (%)
Place of birth for the foreign-born population - Other Northern Europe (%)
Place of birth for the foreign-born population - Austria (%)
Place of birth for the foreign-born population - Belgium (%)
Place of birth for the foreign-born population - France (%)
Place of birth for the foreign-born population - Germany (%)
Place of birth for the foreign-born population - Netherlands (%)
Place of birth for the foreign-born population - Switzerland (%)
Place of birth for the foreign-born population - Other Western Europe (%)
Place of birth for the foreign-born population - Greece (%)
Place of birth for the foreign-born population - Italy (%)
Place of birth for the foreign-born population - Portugal (%)
Place of birth for the foreign-born population - Spain (%)
Place of birth for the foreign-born population - Other Southern Europe (%)
Place of birth for the foreign-born population - Albania (%)
Place of birth for the foreign-born population - Belarus (%)
Place of birth for the foreign-born population - Bosnia and Herzegovina (%)
Place of birth for the foreign-born population - Bulgaria (%)
Place of birth for the foreign-born population - Croatia (%)
Place of birth for the foreign-born population - Czechoslovakia (%)
Place of birth for the foreign-born population - Hungary (%)
Place of birth for the foreign-born population - Latvia (%)
Place of birth for the foreign-born population - Lithuania (%)
Place of birth for the foreign-born population - North Macedonia (Macedonia) (%)
Place of birth for the foreign-born population - Moldova (%)
Place of birth for the foreign-born population - Poland (%)
Place of birth for the foreign-born population - Romania (%)
Place of birth for the foreign-born population - Russia (%)
Place of birth for the foreign-born population - Serbia (%)
Place of birth for the foreign-born population - Ukraine (%)
Place of birth for the foreign-born population - Other Eastern Europe (%)
Place of birth for the foreign-born population - China (%)
Place of birth for the foreign-born population - Hong Kong (%)
Place of birth for the foreign-born population - Taiwan (%)
Place of birth for the foreign-born population - Japan (%)
Place of birth for the foreign-born population - Korea (%)
Place of birth for the foreign-born population - Other Eastern Asia (%)
Place of birth for the foreign-born population - Afghanistan (%)
Place of birth for the foreign-born population - Bangladesh (%)
Place of birth for the foreign-born population - India (%)
Place of birth for the foreign-born population - Iran (%)
Place of birth for the foreign-born population - Kazakhstan (%)
Place of birth for the foreign-born population - Nepal (%)
Place of birth for the foreign-born population - Pakistan (%)
Place of birth for the foreign-born population - Sri Lanka (%)
Place of birth for the foreign-born population - Uzbekistan (%)
Place of birth for the foreign-born population - Other South Central Asia (%)
Place of birth for the foreign-born population - Burma (%)
Place of birth for the foreign-born population - Cambodia (%)
Place of birth for the foreign-born population - Indonesia (%)
Place of birth for the foreign-born population - Laos (%)
Place of birth for the foreign-born population - Malaysia (%)
Place of birth for the foreign-born population - Philippines (%)
Place of birth for the foreign-born population - Singapore (%)
Place of birth for the foreign-born population - Thailand (%)
Place of birth for the foreign-born population - Vietnam (%)
Place of birth for the foreign-born population - Other South Eastern Asia (%)
Place of birth for the foreign-born population - Armenia (%)
Place of birth for the foreign-born population - Iraq (%)
Place of birth for the foreign-born population - Israel (%)
Place of birth for the foreign-born population - Jordan (%)
Place of birth for the foreign-born population - Kuwait (%)
Place of birth for the foreign-born population - Lebanon (%)
Place of birth for the foreign-born population - Saudi Arabia (%)
Place of birth for the foreign-born population - Syria (%)
Place of birth for the foreign-born population - Turkey (%)
Place of birth for the foreign-born population - Yemen (%)
Place of birth for the foreign-born population - Other Western Asia (%)
Place of birth for the foreign-born population - Eritrea (%)
Place of birth for the foreign-born population - Ethiopia (%)
Place of birth for the foreign-born population - Kenya (%)
Place of birth for the foreign-born population - Somalia (%)
Place of birth for the foreign-born population - Uganda (%)
Place of birth for the foreign-born population - Zimbabwe (%)
Place of birth for the foreign-born population - Other Eastern Africa (%)
Place of birth for the foreign-born population - Cameroon (%)
Place of birth for the foreign-born population - Congo (%)
Place of birth for the foreign-born population - Democratic Republic of Congo (Zaire) (%)
Place of birth for the foreign-born population - Other Middle Africa (%)
Place of birth for the foreign-born population - Egypt (%)
Place of birth for the foreign-born population - Morocco (%)
Place of birth for the foreign-born population - Sudan (%)
Place of birth for the foreign-born population - Other Northern Africa (%)
Place of birth for the foreign-born population - South Africa (%)
Place of birth for the foreign-born population - Other Southern Africa (%)
Place of birth for the foreign-born population - Cabo Verde (%)
Place of birth for the foreign-born population - Ghana (%)
Place of birth for the foreign-born population - Liberia (%)
Place of birth for the foreign-born population - Nigeria (%)
Place of birth for the foreign-born population - Senegal (%)
Place of birth for the foreign-born population - Sierra Leone (%)
Place of birth for the foreign-born population - Other Western Africa (%)
Place of birth for the foreign-born population - Australia (%)
Place of birth for the foreign-born population - New Zealand (%)
Place of birth for the foreign-born population - Fiji (%)
Place of birth for the foreign-born population - Micronesia (%)
Place of birth for the foreign-born population - Bahamas (%)
Place of birth for the foreign-born population - Barbados (%)
Place of birth for the foreign-born population - Cuba (%)
Place of birth for the foreign-born population - Dominica (%)
Place of birth for the foreign-born population - Dominican Republic (%)
Place of birth for the foreign-born population - Grenada (%)
Place of birth for the foreign-born population - Haiti (%)
Place of birth for the foreign-born population - Jamaica (%)
Place of birth for the foreign-born population - St. Vincent and the Grenadines (%)
Place of birth for the foreign-born population - Trinidad and Tobago (%)
Place of birth for the foreign-born population - West Indies (%)
Place of birth for the foreign-born population - Other Caribbean (%)
Place of birth for the foreign-born population - Belize (%)
Place of birth for the foreign-born population - Costa Rica (%)
Place of birth for the foreign-born population - El Salvador (%)
Place of birth for the foreign-born population - Guatemala (%)
Place of birth for the foreign-born population - Honduras (%)
Place of birth for the foreign-born population - Mexico (%)
Place of birth for the foreign-born population - Nicaragua (%)
Place of birth for the foreign-born population - Panama (%)
Place of birth for the foreign-born population - Other Central America (%)
Place of birth for the foreign-born population - Argentina (%)
Place of birth for the foreign-born population - Bolivia (%)
Place of birth for the foreign-born population - Brazil (%)
Place of birth for the foreign-born population - Chile (%)
Place of birth for the foreign-born population - Colombia (%)
Place of birth for the foreign-born population - Ecuador (%)
Place of birth for the foreign-born population - Guyana (%)
Place of birth for the foreign-born population - Peru (%)
Place of birth for the foreign-born population - Uruguay (%)
Place of birth for the foreign-born population - Venezuela (%)
Place of birth for the foreign-born population - Other South America (%)
Place of birth for the foreign-born population - Canada (%)
Place of birth for the foreign-born population - Other Northern America (%)
Place of birth for the foreign-born population - Other (%)
Latest news about races in Belen, NM collected exclusively by city-data.com from local newspapers, TV, and radio stations
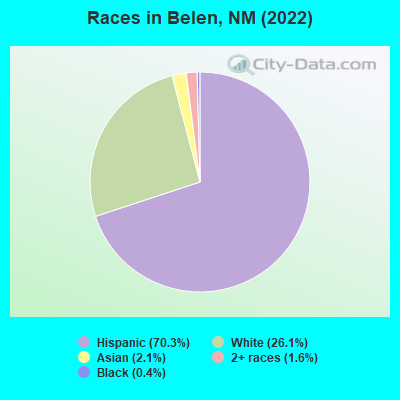
According to 2022 data, the most numerous races in Belen, NM are Hispanic (5,179 residents), White alone (1,922 residents), and American Indian alone (0 residents). 58.8% of Belen residents speak English at home. 10.0% of Belen, NM residents are foreign-born (8.1% born in Latin America, 1.9% born in Asia), which is 9.7% greater than the foreign-born rate of 9.0% across the entire state of New Mexico.
Race distribution in Belen
2000 2022
813,495 44.7% White alone 765,386 42.1% Hispanic 161,460 8.9% American Indian alone 30,654 1.7% Black alone 25,793 1.4% Two or more races 18,257 1.0% Asian alone 3,009 0.2% Other race alone 992 0.05% Native Hawaiian and Other
1,059,867 50.2% Hispanic 735,478 34.8% White alone 171,808 8.1% American Indian alone 65,084 3.1% Two or more races 36,870 1.7% Black alone 35,870 1.7% Asian alone 7,582 0.4% Other race alone 785 0.04% Native Hawaiian and Other
Income and house value in Belen Median household income in 2022 $44,860 White non-Hispanic householders$27,647 Two or more races householders$28,694 Hispanic or Latino race householdersMedian 2022 house value $129,751 White Non-Hispanic householders$181,104 Black or African American householders$125,727 American Indian or Alaska Native householders$122,507 Some other race householders$155,347 Two or more races householders$131,844 Hispanic or Latino householders
Median age by race in Belen
47.1 Median age for White residents34.7 52.9 61.9 Median age for Black or African American residents-940,668,823.2 -670,719,350.9 -699,327,568.9 Median age for American Indian / Alaska Native residents-659,439,927.1 -712,851,404.9 37.3 Median age for Asian residents-687,619,046.9 36.0 -666,666,666.0 Median age for Native Hawaiian / Pacific Islander residents-666,666,666.0 -666,666,666.0 33.1 Median age for Other race residents35.5 24.8 45.0 Median age for Two or more races residents50.1 42.4 51.8 Median age for White alone residents48.4 53.2 38.4 Median age for Hispanic or Latino residents34.9 46.7
Owner/renter occupied households by race in Belen
House owners and renters - White residents 1,062 77.9% Owner occupied302 22.1% Renter occupiedHouse owners and renters - Black or African American residents 26 100.0% Owner occupiedHouse owners and renters - Asian residents 55 100.0% Renter occupiedHouse owners and renters - Other race residents 266 66.1% Owner occupied137 33.9% Renter occupiedHouse owners and renters - Two or more races residents 1,039 84.9% Owner occupied185 15.1% Renter occupiedHouse owners and renters - White alone residents 627 79.5% Owner occupied162 20.5% Renter occupiedHouse owners and renters - Hispanic or Latino residents 1,465 77.6% Owner occupied423 22.4% Renter occupied
Language usage in Belen
English speakers - Total 58.8% of residents of Belen speak English at home.
38.3% of residents speak Spanish at home 1,918 68.9% Speak English very well864 31.1% Speak English less than very well2.5% of residents speak other language at home 129 71.3% Speak English very well52 28.7% Speak English less than very well
English speakers - Born in the United States 79.7% of residents of Belen speak English at home.
18.2% of residents speak Spanish at home 185 44.8% Speak English very well228 55.2% Speak English less than very well3.3% of residents speak other language at home 31 41.9% Speak English very well43 58.1% Speak English less than very well
English speakers - Native, born elsewhere 5.3% of residents of Belen speak English at home.
53.9% of residents speak Spanish at home 41 100.0% Speak English very well3.9% of residents speak other language at home 3 100.0% Speak English very well
English speakers - Foreign-born 0.5% of residents of Belen speak English at home.
78.6% of residents speak Spanish at home 272 37.5% Speak English very well454 62.5% Speak English less than very well19.8% of residents speak other language at home 183 100.0% Speak English very well
White (Caucasian) - Speak another language Native:
17.0% (579)Foreign-born:
100.0% (44)
Other race - Speak only English Native:
50.8% (507)Foreign-born:
1.3% (4)
Other race - Speak another language Native:
38.6% (386)Foreign-born:
100.0% (287)
Two or more races - Speak another language Native:
50.7% (988)Foreign-born:
100.0% (554)
Hispanic or Latino - Speak only English Native:
53.5% (2,294)Foreign-born:
0.6% (4)
Hispanic or Latino - Speak another language Native:
44.8% (1,923)Foreign-born:
100.0% (773)
Foreign-born residents in Belen 748 residents are foreign born (8.1% Latin America , 1.9% Asia ).
This city:
10.0%New Mexico:
9.2%
Marital status for residents in Belen Marital status - White (Caucasian) population 15 years and over
Males 48.0% Never married26.9% Now married5.0% Separated3.9% Widowed16.2% DivorcedFemales 25.4% Never married27.8% Now married0.0% Separated7.7% Widowed39.1% DivorcedWomen who gave birth in the past 12 months Now married:
100.0% (50)Unmarried:
0.0% (0)
Women who did not give birth in the past 12 months Now married:
21.5% (122)Unmarried:
78.5% (444)
Marital status - Black or African American population 15 years and over
Males 0.0% Never married35.5% Now married0.0% Separated0.0% Widowed64.5% DivorcedFemales 0.0% Never married100.0% Now married0.0% Separated0.0% Widowed0.0% DivorcedWomen who did not give birth in the past 12 months Now married:
100.0% (12)Unmarried:
0.0% (0)
Marital status - Asian population 15 years and over
Males 0.0% Never married100.0% Now married0.0% Separated0.0% Widowed0.0% DivorcedFemales 35.9% Never married48.7% Now married0.0% Separated0.0% Widowed15.4% DivorcedWomen who did not give birth in the past 12 months Now married:
57.6% (68)Unmarried:
42.4% (50)
Marital status - Other race population 15 years and over
Males 60.9% Never married29.3% Now married3.1% Separated1.7% Widowed5.0% DivorcedFemales 51.9% Never married15.8% Now married8.3% Separated15.3% Widowed8.8% DivorcedWomen who gave birth in the past 12 months Now married:
0.0% (0)Unmarried:
100.0% (117)
Women who did not give birth in the past 12 months Now married:
25.2% (45)Unmarried:
74.8% (133)
Marital status - Two or more races population 15 years and over
Males 25.9% Never married46.8% Now married0.0% Separated3.1% Widowed24.2% DivorcedFemales 46.8% Never married27.0% Now married0.0% Separated7.1% Widowed19.0% DivorcedWomen who gave birth in the past 12 months Now married:
0.0% (0)Unmarried:
100.0% (126)
Women who did not give birth in the past 12 months Now married:
34.6% (242)Unmarried:
65.4% (456)
Marital status - White alone, not Hispanic / Latino population 15 years and over
Males 40.2% Never married32.2% Now married1.2% Separated5.0% Widowed21.4% DivorcedFemales 20.4% Never married32.1% Now married0.0% Separated13.8% Widowed33.7% DivorcedWomen who gave birth in the past 12 months Now married:
100.0% (14)Unmarried:
0.0% (0)
Women who did not give birth in the past 12 months Now married:
34.9% (84)Unmarried:
65.1% (158)
Marital status - Hispanic or Latino population 15 years and over
Males 46.0% Never married31.5% Now married5.2% Separated2.9% Widowed14.3% DivorcedFemales 41.6% Never married23.7% Now married1.3% Separated5.5% Widowed27.9% DivorcedWomen who gave birth in the past 12 months Now married:
24.8% (55)Unmarried:
75.2% (166)
Women who did not give birth in the past 12 months Now married:
23.2% (279)Unmarried:
76.8% (922)
Ancestries in Belen
278 6.4% English191 4.4% American164 3.8% German68 1.6% Irish42 1.0% European38 0.9% French21 0.5% Italian16 0.4% Scottish15 0.3% Norwegian11 0.3% Scandinavian5 0.1% Scotch-Irish5 0.1% Swedish4 0.09% Albanian1 0.02% Czech1 0.02% Finnish
Children Nativity (place of birth) in Belen
Children under 6 years - Living with two parents Both parents native 92 100.0% NativeBoth parents foreign-born 3 100.0% NativeChildren under 6 years - Living with one parent Native parent 212 100.0% NativeForeign-born parent 1 100.0% NativeChildren 6 to 17 years - Living with two parents Both parents native 91 100.0% NativeBoth parents foreign-born 16 100.0% NativeChildren 6 to 17 years - Living with one parent Native parent 268 100.0% NativeForeign-born parent 255 51.3% Native242 48.7% Foreign-born
Place of birth for residents in Belen 608 Americas608 Latin America608 Central America139 Asia139 South Eastern Asia
Grandparents responsible for own grandchildren in Belen
Grandparents (30 to 59 years) White / Caucasian 10 100.0% Not responsible for grandchildrenOther race 11 100.0% Responsible for grandchildrenTwo or more races 20 25.8% Responsible for grandchildren57 74.2% Not responsible for grandchildrenHispanic or Latino 21 28.5% Responsible for grandchildren52 71.5% Not responsible for grandchildren
Grandparents (60 years and over) White / Caucasian 2 3.1% Responsible for grandchildren51 96.9% Not responsible for grandchildrenOther race 1 2.7% Responsible for grandchildren32 97.3% Not responsible for grandchildrenHispanic or Latino 1 1.3% Responsible for grandchildren67 98.7% Not responsible for grandchildren