Races in Bel Air North, Maryland (MD) Detailed Stats
Data:
Races - White alone (%)
Races - White alone (% change since 2000)
Races - Black alone (%)
Races - Black alone (% change since 2000)
Races - American Indian alone (%)
Races - American Indian alone (% change since 2000)
Races - Asian alone (%)
Races - Asian alone (% change since 2000)
Races - Hispanic (%)
Races - Hispanic (% change since 2000)
Races - Native Hawaiian and Other Pacific Islander alone (%)
Races - Native Hawaiian and Other Pacific Islander alone (% change since 2000)
Races - Two or more races(%)
Races - Two or more races(% change since 2000)
Races - Other race alone (%)
Races - Other race alone (% change since 2000)
Racial diversity
Place of birth - Born in state of residence (%)
Place of birth - Born in state of residence (%) - White
Place of birth - Born in state of residence (%) - Black or African American
Place of birth - Born in state of residence (%) - Asian
Place of birth - Born in state of residence (%) - Hispanic or Latino
Place of birth - Born in state of residence (%) - American Indian and Alaska Native
Place of birth - Born in state of residence (%) - Multirace
Place of birth - Born in state of residence (%) - Other Race
Place of birth - Born in other state (%)
Place of birth - Born in other state (%) - White
Place of birth - Born in other state (%) - Black or African American
Place of birth - Born in other state (%) - Asian
Place of birth - Born in other state (%) - Hispanic or Latino
Place of birth - Born in other state (%) - American Indian and Alaska Native
Place of birth - Born in other state (%) - Multirace
Place of birth - Born in other state (%) - Other Race
Place of birth - Native, outside of US (%)
Place of birth - Native, outside of US (%) - White
Place of birth - Native, outside of US (%) - Black or African American
Place of birth - Native, outside of US (%) - Asian
Place of birth - Native, outside of US (%) - Hispanic or Latino
Place of birth - Native, outside of US (%) - American Indian and Alaska Native
Place of birth - Native, outside of US (%) - Multirace
Place of birth - Native, outside of US (%) - Other Race
Place of birth - Foreign born (%)
Place of birth - Foreign born (%) - White
Place of birth - Foreign born (%) - Black or African American
Place of birth - Foreign born (%) - Asian
Place of birth - Foreign born (%) - Hispanic or Latino
Place of birth - Foreign born (%) - American Indian and Alaska Native
Place of birth - Foreign born (%) - Multirace
Place of birth - Foreign born (%) - Other Race
Residents speaking English at home (%)
Residents speaking English at home - Born in the United States (%)
Residents speaking English at home - Native, born elsewhere (%)
Residents speaking English at home - Foreign born (%)
Residents speaking Spanish at home (%)
Residents speaking Spanish at home - Born in the United States (%)
Residents speaking Spanish at home - Native, born elsewhere (%)
Residents speaking Spanish at home - Foreign born (%)
Residents speaking other language at home (%)
Residents speaking other language at home - Born in the United States (%)
Residents speaking other language at home - Native, born elsewhere (%)
Residents speaking other language at home - Foreign born (%)
Marital status - Never married (%)
Marital status - Now married (%)
Marital status - Separated (%)
Marital status - Widowed (%)
Marital status - Divorced (%)
Ancestries Reported - Arab (%)
Ancestries Reported - Czech (%)
Ancestries Reported - Danish (%)
Ancestries Reported - Dutch (%)
Ancestries Reported - English (%)
Ancestries Reported - French (%)
Ancestries Reported - French Canadian (%)
Ancestries Reported - German (%)
Ancestries Reported - Greek (%)
Ancestries Reported - Hungarian (%)
Ancestries Reported - Irish (%)
Ancestries Reported - Italian (%)
Ancestries Reported - Lithuanian (%)
Ancestries Reported - Norwegian (%)
Ancestries Reported - Polish (%)
Ancestries Reported - Portuguese (%)
Ancestries Reported - Russian (%)
Ancestries Reported - Scotch-Irish (%)
Ancestries Reported - Scottish (%)
Ancestries Reported - Slovak (%)
Ancestries Reported - Subsaharan African (%)
Ancestries Reported - Swedish (%)
Ancestries Reported - Swiss (%)
Ancestries Reported - Ukrainian (%)
Ancestries Reported - United States (%)
Ancestries Reported - Welsh (%)
Ancestries Reported - West Indian (%)
Ancestries Reported - Other (%)
Geographical mobility - Same house 1 year ago (%)
Geographical mobility - Same house 1 year ago (%) - White
Geographical mobility - Same house 1 year ago (%) - Black or African American
Geographical mobility - Same house 1 year ago (%) - Asian
Geographical mobility - Same house 1 year ago (%) - Hispanic or Latino
Geographical mobility - Same house 1 year ago (%) - American Indian and Alaska Native
Geographical mobility - Same house 1 year ago (%) - Multirace
Geographical mobility - Same house 1 year ago (%) - Other Race
Geographical mobility - Moved within same county (%)
Geographical mobility - Moved within same county (%) - White
Geographical mobility - Moved within same county (%) - Black or African American
Geographical mobility - Moved within same county (%) - Asian
Geographical mobility - Moved within same county (%) - Hispanic or Latino
Geographical mobility - Moved within same county (%) - American Indian and Alaska Native
Geographical mobility - Moved within same county (%) - Multirace
Geographical mobility - Moved within same county (%) - Other Race
Geographical mobility - Moved from different county within same state (%)
Geographical mobility - Moved from different county within same state (%) - White
Geographical mobility - Moved from different county within same state (%) - Black or African American
Geographical mobility - Moved from different county within same state (%) - Asian
Geographical mobility - Moved from different county within same state (%) - Hispanic or Latino
Geographical mobility - Moved from different county within same state (%) - American Indian and Alaska Native
Geographical mobility - Moved from different county within same state (%) - Multirace
Geographical mobility - Moved from different county within same state (%) - Other Race
Geographical mobility - Moved from different state (%)
Geographical mobility - Moved from different state (%) - White
Geographical mobility - Moved from different state (%) - Black or African American
Geographical mobility - Moved from different state (%) - Asian
Geographical mobility - Moved from different state (%) - Hispanic or Latino
Geographical mobility - Moved from different state (%) - American Indian and Alaska Native
Geographical mobility - Moved from different state (%) - Multirace
Geographical mobility - Moved from different state (%) - Other Race
Geographical mobility - Moved from abroad (%)
Geographical mobility - Moved from abroad (%) - White
Geographical mobility - Moved from abroad (%) - Black or African American
Geographical mobility - Moved from abroad (%) - Asian
Geographical mobility - Moved from abroad (%) - Hispanic or Latino
Geographical mobility - Moved from abroad (%) - American Indian and Alaska Native
Geographical mobility - Moved from abroad (%) - Multirace
Geographical mobility - Moved from abroad (%) - Other Race
Place of birth for the foreign-born population - Ireland (%)
Place of birth for the foreign-born population - Denmark (%)
Place of birth for the foreign-born population - Norway (%)
Place of birth for the foreign-born population - Sweden (%)
Place of birth for the foreign-born population - United Kingdom (%)
Place of birth for the foreign-born population - England (%)
Place of birth for the foreign-born population - Scotland (%)
Place of birth for the foreign-born population - Other Northern Europe (%)
Place of birth for the foreign-born population - Austria (%)
Place of birth for the foreign-born population - Belgium (%)
Place of birth for the foreign-born population - France (%)
Place of birth for the foreign-born population - Germany (%)
Place of birth for the foreign-born population - Netherlands (%)
Place of birth for the foreign-born population - Switzerland (%)
Place of birth for the foreign-born population - Other Western Europe (%)
Place of birth for the foreign-born population - Greece (%)
Place of birth for the foreign-born population - Italy (%)
Place of birth for the foreign-born population - Portugal (%)
Place of birth for the foreign-born population - Spain (%)
Place of birth for the foreign-born population - Other Southern Europe (%)
Place of birth for the foreign-born population - Albania (%)
Place of birth for the foreign-born population - Belarus (%)
Place of birth for the foreign-born population - Bosnia and Herzegovina (%)
Place of birth for the foreign-born population - Bulgaria (%)
Place of birth for the foreign-born population - Croatia (%)
Place of birth for the foreign-born population - Czechoslovakia (%)
Place of birth for the foreign-born population - Hungary (%)
Place of birth for the foreign-born population - Latvia (%)
Place of birth for the foreign-born population - Lithuania (%)
Place of birth for the foreign-born population - North Macedonia (Macedonia) (%)
Place of birth for the foreign-born population - Moldova (%)
Place of birth for the foreign-born population - Poland (%)
Place of birth for the foreign-born population - Romania (%)
Place of birth for the foreign-born population - Russia (%)
Place of birth for the foreign-born population - Serbia (%)
Place of birth for the foreign-born population - Ukraine (%)
Place of birth for the foreign-born population - Other Eastern Europe (%)
Place of birth for the foreign-born population - China (%)
Place of birth for the foreign-born population - Hong Kong (%)
Place of birth for the foreign-born population - Taiwan (%)
Place of birth for the foreign-born population - Japan (%)
Place of birth for the foreign-born population - Korea (%)
Place of birth for the foreign-born population - Other Eastern Asia (%)
Place of birth for the foreign-born population - Afghanistan (%)
Place of birth for the foreign-born population - Bangladesh (%)
Place of birth for the foreign-born population - India (%)
Place of birth for the foreign-born population - Iran (%)
Place of birth for the foreign-born population - Kazakhstan (%)
Place of birth for the foreign-born population - Nepal (%)
Place of birth for the foreign-born population - Pakistan (%)
Place of birth for the foreign-born population - Sri Lanka (%)
Place of birth for the foreign-born population - Uzbekistan (%)
Place of birth for the foreign-born population - Other South Central Asia (%)
Place of birth for the foreign-born population - Burma (%)
Place of birth for the foreign-born population - Cambodia (%)
Place of birth for the foreign-born population - Indonesia (%)
Place of birth for the foreign-born population - Laos (%)
Place of birth for the foreign-born population - Malaysia (%)
Place of birth for the foreign-born population - Philippines (%)
Place of birth for the foreign-born population - Singapore (%)
Place of birth for the foreign-born population - Thailand (%)
Place of birth for the foreign-born population - Vietnam (%)
Place of birth for the foreign-born population - Other South Eastern Asia (%)
Place of birth for the foreign-born population - Armenia (%)
Place of birth for the foreign-born population - Iraq (%)
Place of birth for the foreign-born population - Israel (%)
Place of birth for the foreign-born population - Jordan (%)
Place of birth for the foreign-born population - Kuwait (%)
Place of birth for the foreign-born population - Lebanon (%)
Place of birth for the foreign-born population - Saudi Arabia (%)
Place of birth for the foreign-born population - Syria (%)
Place of birth for the foreign-born population - Turkey (%)
Place of birth for the foreign-born population - Yemen (%)
Place of birth for the foreign-born population - Other Western Asia (%)
Place of birth for the foreign-born population - Eritrea (%)
Place of birth for the foreign-born population - Ethiopia (%)
Place of birth for the foreign-born population - Kenya (%)
Place of birth for the foreign-born population - Somalia (%)
Place of birth for the foreign-born population - Uganda (%)
Place of birth for the foreign-born population - Zimbabwe (%)
Place of birth for the foreign-born population - Other Eastern Africa (%)
Place of birth for the foreign-born population - Cameroon (%)
Place of birth for the foreign-born population - Congo (%)
Place of birth for the foreign-born population - Democratic Republic of Congo (Zaire) (%)
Place of birth for the foreign-born population - Other Middle Africa (%)
Place of birth for the foreign-born population - Egypt (%)
Place of birth for the foreign-born population - Morocco (%)
Place of birth for the foreign-born population - Sudan (%)
Place of birth for the foreign-born population - Other Northern Africa (%)
Place of birth for the foreign-born population - South Africa (%)
Place of birth for the foreign-born population - Other Southern Africa (%)
Place of birth for the foreign-born population - Cabo Verde (%)
Place of birth for the foreign-born population - Ghana (%)
Place of birth for the foreign-born population - Liberia (%)
Place of birth for the foreign-born population - Nigeria (%)
Place of birth for the foreign-born population - Senegal (%)
Place of birth for the foreign-born population - Sierra Leone (%)
Place of birth for the foreign-born population - Other Western Africa (%)
Place of birth for the foreign-born population - Australia (%)
Place of birth for the foreign-born population - New Zealand (%)
Place of birth for the foreign-born population - Fiji (%)
Place of birth for the foreign-born population - Micronesia (%)
Place of birth for the foreign-born population - Bahamas (%)
Place of birth for the foreign-born population - Barbados (%)
Place of birth for the foreign-born population - Cuba (%)
Place of birth for the foreign-born population - Dominica (%)
Place of birth for the foreign-born population - Dominican Republic (%)
Place of birth for the foreign-born population - Grenada (%)
Place of birth for the foreign-born population - Haiti (%)
Place of birth for the foreign-born population - Jamaica (%)
Place of birth for the foreign-born population - St. Vincent and the Grenadines (%)
Place of birth for the foreign-born population - Trinidad and Tobago (%)
Place of birth for the foreign-born population - West Indies (%)
Place of birth for the foreign-born population - Other Caribbean (%)
Place of birth for the foreign-born population - Belize (%)
Place of birth for the foreign-born population - Costa Rica (%)
Place of birth for the foreign-born population - El Salvador (%)
Place of birth for the foreign-born population - Guatemala (%)
Place of birth for the foreign-born population - Honduras (%)
Place of birth for the foreign-born population - Mexico (%)
Place of birth for the foreign-born population - Nicaragua (%)
Place of birth for the foreign-born population - Panama (%)
Place of birth for the foreign-born population - Other Central America (%)
Place of birth for the foreign-born population - Argentina (%)
Place of birth for the foreign-born population - Bolivia (%)
Place of birth for the foreign-born population - Brazil (%)
Place of birth for the foreign-born population - Chile (%)
Place of birth for the foreign-born population - Colombia (%)
Place of birth for the foreign-born population - Ecuador (%)
Place of birth for the foreign-born population - Guyana (%)
Place of birth for the foreign-born population - Peru (%)
Place of birth for the foreign-born population - Uruguay (%)
Place of birth for the foreign-born population - Venezuela (%)
Place of birth for the foreign-born population - Other South America (%)
Place of birth for the foreign-born population - Canada (%)
Place of birth for the foreign-born population - Other Northern America (%)
Place of birth for the foreign-born population - Other (%)
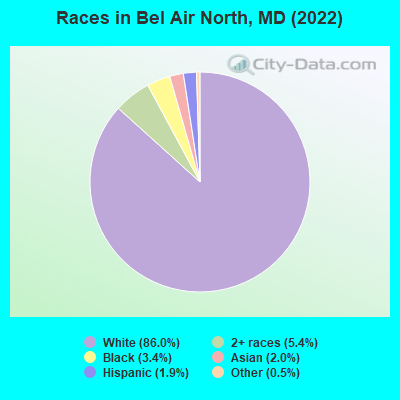
According to 2022 data, the most numerous races in Bel Air North, MD are White alone (27,207 residents), Black alone (1,062 residents), and Hispanic (609 residents). 95.3% of Bel Air North residents speak English at home. 3.0% of Bel Air North, MD residents are foreign-born (1.1% born in Asia, 0.7% born in Europe, 0.6% born in Latin America), which is 427.4% less than the foreign-born rate of 16.0% across the entire state of Maryland.
Race distribution in Bel Air North
2000 2022
3,286,547 62.1% White alone 1,464,735 27.7% Black alone 227,916 4.3% Hispanic 209,738 4.0% Asian alone 82,946 1.6% Two or more races 13,312 0.3% American Indian alone 9,379 0.2% Other race alone 1,913 0.04% Native Hawaiian and Other
2,906,492 47.1% White alone 1,800,914 29.2% Black alone 705,842 11.4% Hispanic 401,818 6.5% Asian alone 291,317 4.7% Two or more races 46,930 0.8% Other race alone 8,930 0.1% American Indian alone 2,417 0.04% Native Hawaiian and Other
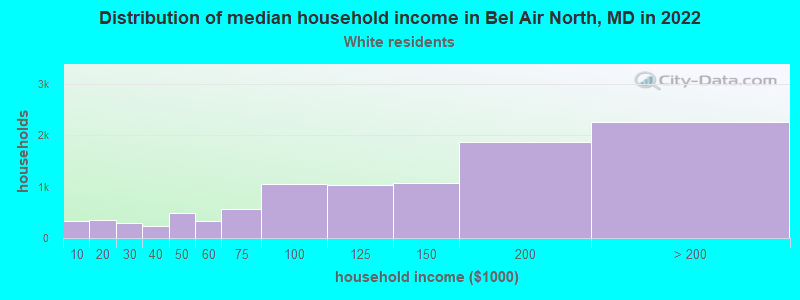
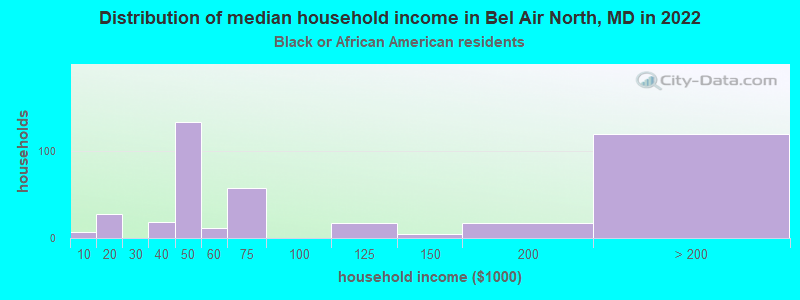
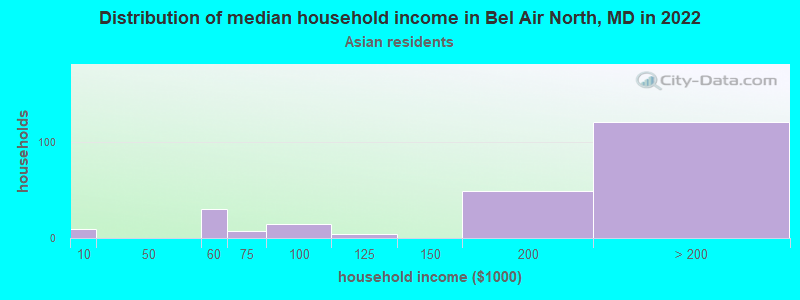
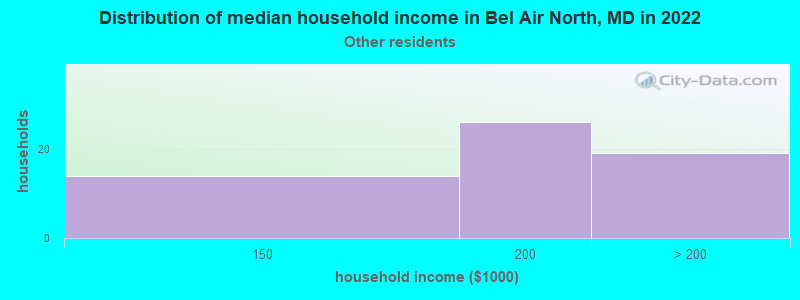
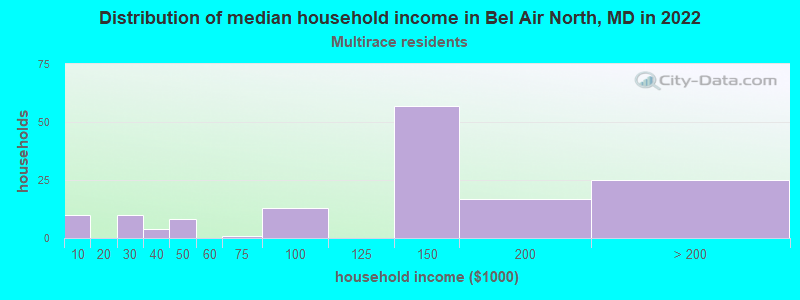
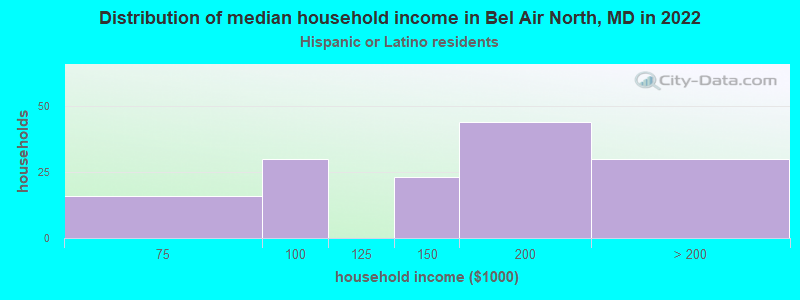
Income and house value in Bel Air North Median household income in 2022 $130,253 White non-Hispanic householders$176,986 Asian householders$155,816 Some other race householders$109,257 Two or more races householders$102,850 Hispanic or Latino race householdersMedian 2022 house value $425,228 White Non-Hispanic householders$445,099 Black or African American householders$551,903 American Indian or Alaska Native householders $561,341 Asian householders$707,886 Two or more races householders$322,150 Hispanic or Latino householders
Median age by race in Bel Air North
42.2 Median age for White residents41.2 42.8 37.2 Median age for Black or African American residents30.0 47.2 -647,863,247.2 Median age for American Indian / Alaska Native residents-642,487,046.0 -676,818,950.3 51.6 Median age for Asian residents59.8 40.3 -763,333,332.6 Median age for Native Hawaiian / Pacific Islander residents-666,666,666.0 -760,942,760.2 52.9 Median age for Other race residents43.9 -726,522,187.1 14.0 Median age for Two or more races residents17.3 12.2 42.2 Median age for White alone residents41.6 42.7 29.5 Median age for Hispanic or Latino residents28.6 32.2
Owner/renter occupied households by race in Bel Air North
House owners and renters - White residents 9,221 91.7% Owner occupied837 8.3% Renter occupiedHouse owners and renters - Black or African American residents 239 70.9% Owner occupied98 29.1% Renter occupiedHouse owners and renters - American Indian / Alaska Native residents 5 100.0% Owner occupiedHouse owners and renters - Asian residents 254 89.3% Owner occupied30 10.7% Renter occupiedHouse owners and renters - Other race residents 64 100.0% Owner occupiedHouse owners and renters - Two or more races residents 135 73.5% Owner occupied49 26.5% Renter occupiedHouse owners and renters - White alone residents 9,149 91.7% Owner occupied830 8.3% Renter occupiedHouse owners and renters - Hispanic or Latino residents 145 100.0% Owner occupied
Language usage in Bel Air North
English speakers - Total 95.3% of residents of Bel Air North speak English at home.
1.6% of residents speak Spanish at home 277 58.8% Speak English very well194 41.2% Speak English less than very well2.9% of residents speak other language at home 616 70.9% Speak English very well253 29.1% Speak English less than very well
English speakers - Born in the United States 96.5% of residents of Bel Air North speak English at home.
1.9% of residents speak Spanish at home 69 49.3% Speak English very well71 50.7% Speak English less than very well1.7% of residents speak other language at home 98 80.3% Speak English very well24 19.7% Speak English less than very well
All residents speak only English at home
English speakers - Foreign-born 35.9% of residents of Bel Air North speak English at home.
13.3% of residents speak Spanish at home 139 97.2% Speak English very well4 2.8% Speak English less than very well48.1% of residents speak other language at home 332 64.1% Speak English very well186 35.9% Speak English less than very well
White (Caucasian) - Speak only English Native:
97.8% (24,918)Foreign-born:
40.6% (185)
White (Caucasian) - Speak another language Native:
2.2% (570)Foreign-born:
58.2% (265)
Black or African American - Speak only English Native:
99.2% (967)Foreign-born:
60.2% (74)
Black or African American - Speak another language Native:
1.0% (10)Foreign-born:
40.3% (50)
Asian - Speak only English Native:
97.8% (233)Foreign-born:
18.2% (72)
Asian - Speak another language Native:
7.3% (17)Foreign-born:
74.6% (296)
Other race - Speak only English Native:
97.8% (140)Foreign-born:
58.3% (23)
Other race - Speak another language Native:
8.1% (12)Foreign-born:
48.6% (19)
Two or more races - Speak another language Native:
5.3% (73)Foreign-born:
94.1% (25)
White alone - Speak only English Native:
97.5% (24,704)Foreign-born:
40.0% (172)
White alone - Speak another language Native:
2.5% (633)Foreign-born:
57.5% (248)
Hispanic or Latino - Speak only English Native:
79.0% (349)Foreign-born:
15.2% (16)
Hispanic or Latino - Speak another language Native:
23.9% (106)Foreign-born:
76.9% (79)
Foreign-born residents in Bel Air North 960 residents are foreign born (1.1% Asia , 0.7% Europe , 0.6% Latin America ).
This city:
3.0%Maryland:
15.7%
Marital status for residents in Bel Air North Marital status - White (Caucasian) population 15 years and over
Males 24.1% Never married67.6% Now married1.1% Separated3.3% Widowed3.9% DivorcedFemales 21.4% Never married61.0% Now married0.7% Separated9.3% Widowed7.6% DivorcedWomen who gave birth in the past 12 months Now married:
91.1% (413)Unmarried:
8.9% (40)
Women who did not give birth in the past 12 months Now married:
55.6% (3,027)Unmarried:
44.4% (2,419)
Marital status - Black or African American population 15 years and over
Males 45.1% Never married46.6% Now married1.3% Separated4.1% Widowed2.9% DivorcedFemales 14.0% Never married49.4% Now married22.1% Separated9.2% Widowed5.2% DivorcedWomen who did not give birth in the past 12 months Now married:
77.1% (128)Unmarried:
22.9% (38)
Marital status - Asian population 15 years and over
Males 25.7% Never married64.0% Now married0.0% Separated10.3% Widowed0.0% DivorcedFemales 34.0% Never married66.0% Now married0.0% Separated0.0% Widowed0.0% DivorcedWomen who did not give birth in the past 12 months Now married:
49.2% (95)Unmarried:
50.8% (98)
Marital status - Other race population 15 years and over
Males 39.4% Never married48.6% Now married0.0% Separated0.0% Widowed11.9% DivorcedFemales 36.1% Never married63.9% Now married0.0% Separated0.0% Widowed0.0% DivorcedWomen who did not give birth in the past 12 months Now married:
63.9% (29)Unmarried:
36.1% (16)
Marital status - Two or more races population 15 years and over
Males 60.4% Never married37.8% Now married0.0% Separated0.0% Widowed1.8% DivorcedFemales 42.4% Never married52.8% Now married2.2% Separated0.0% Widowed2.6% DivorcedWomen who gave birth in the past 12 months Now married:
100.0% (14)Unmarried:
0.0% (0)
Women who did not give birth in the past 12 months Now married:
37.9% (89)Unmarried:
62.1% (146)
Marital status - White alone, not Hispanic / Latino population 15 years and over
Males 23.8% Never married67.9% Now married1.2% Separated3.3% Widowed3.9% DivorcedFemales 21.6% Never married60.6% Now married0.7% Separated9.4% Widowed7.7% DivorcedWomen who gave birth in the past 12 months Now married:
91.1% (419)Unmarried:
8.9% (41)
Women who did not give birth in the past 12 months Now married:
54.7% (2,961)Unmarried:
45.3% (2,454)
Marital status - Hispanic or Latino population 15 years and over
Males 49.3% Never married47.3% Now married0.0% Separated0.0% Widowed3.4% DivorcedFemales 11.8% Never married81.4% Now married0.0% Separated6.8% Widowed0.0% DivorcedWomen who did not give birth in the past 12 months Now married:
75.9% (147)Unmarried:
24.1% (47)
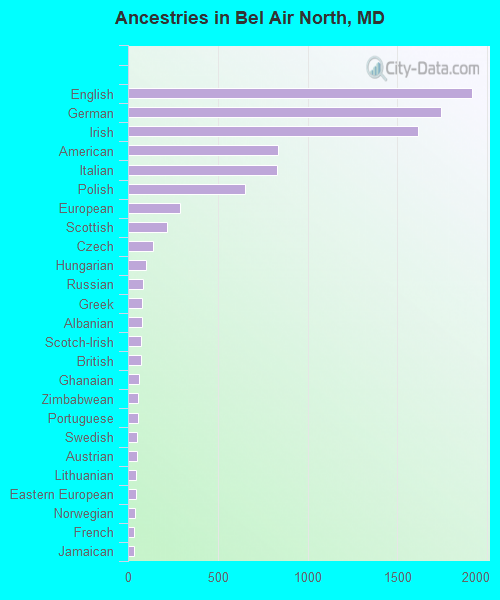
Ancestries in Bel Air North
1,914 15.1% English1,744 13.7% German1,612 12.7% Irish835 6.6% American827 6.5% Italian649 5.1% Polish292 2.3% European218 1.7% Scottish141 1.1% Czech101 0.8% Hungarian82 0.6% Russian78 0.6% Greek77 0.6% Albanian73 0.6% Scotch-Irish70 0.6% British63 0.5% Ghanaian55 0.4% Zimbabwean54 0.4% Portuguese52 0.4% Swedish49 0.4% Austrian45 0.4% Lithuanian43 0.3% Eastern European38 0.3% Norwegian35 0.3% French31 0.2% Jamaican26 0.2% Ukrainian19 0.1% French Canadian18 0.1% Armenian15 0.1% Barbadian14 0.1% Egyptian13 0.1% Palestinian12 0.09% Finnish12 0.09% Swiss12 0.09% Welsh10 0.08% Scandinavian9 0.07% Guyanese8 0.06% Pennsylvania German8 0.06% African8 0.06% Trinidadian and Tobagonian8 0.06% West Indian7 0.06% Slovak7 0.06% Dutch4 0.03% Czechoslovakian
Geographical mobility in Bel Air North Same house 1 year ago 25,612 94.1% White (Caucasian)778 70.2% Black or African American14 98.9% American Indian / Alaska Native502 87.1% Asian10 100.0% Native Hawaiian / Pacific Islander70 34.5% Other race1,875 100.0% Two or more races25,364 93.9% White alone, not Hispanic / Latino565 98.6% Hispanic or LatinoMoved within same county 1,198 4.4% White / Caucasian46 4.2% Black or African American88 43.6% Other race1,226 4.5% White alone, not Hispanic / LatinoMoved within same state 275 1.0% White / Caucasian431 38.9% Black or African American6 1.1% Asian16 8.0% Other race272 1.0% White alone, not Hispanic / Latino25 4.3% Hispanic or LatinoMoved from different state 120 0.4% White / Caucasian7 0.7% Black or African American61 10.6% Asian1 0.1% Two or more races124 0.5% White alone, not Hispanic / LatinoMoved from abroad 17 0.1% White7 0.6% Black or African American19 0.1% White alone, not Hispanic / Latino
Children Nativity (place of birth) in Bel Air North
Children under 6 years - Living with two parents Both parents native 1,662 99.3% Native12 0.7% Foreign-bornBoth parents foreign-born 20 100.0% NativeOne native, one foreign-born parent 93 100.0% NativeChildren under 6 years - Living with one parent Native parent 197 100.0% NativeChildren 6 to 17 years - Living with two parents Both parents native 4,570 100.0% NativeBoth parents foreign-born 19 100.0% NativeOne native, one foreign-born parent 423 100.0% NativeChildren 6 to 17 years - Living with one parent Native parent 651 100.0% NativeForeign-born parent 43 37.1% Native72 62.9% Foreign-born
Grandparents responsible for own grandchildren in Bel Air North
Grandparents (30 to 59 years) White / Caucasian 12 10.9% Responsible for grandchildren94 89.1% Not responsible for grandchildrenBlack or African American 10 100.0% Not responsible for grandchildrenWhite alone, not Hispanic / Latino 12 10.6% Responsible for grandchildren98 89.4% Not responsible for grandchildrenHispanic or Latino 12 100.0% Not responsible for grandchildrenGrandparents (60 years and over) White / Caucasian 34 11.2% Responsible for grandchildren267 88.8% Not responsible for grandchildrenBlack or African American 18 100.0% Not responsible for grandchildrenWhite alone, not Hispanic / Latino 34 11.0% Responsible for grandchildren272 89.0% Not responsible for grandchildren