Races in Batavia, Illinois (IL) Detailed Stats
Data:
Races - White alone (%)
Races - White alone (% change since 2000)
Races - Black alone (%)
Races - Black alone (% change since 2000)
Races - American Indian alone (%)
Races - American Indian alone (% change since 2000)
Races - Asian alone (%)
Races - Asian alone (% change since 2000)
Races - Hispanic (%)
Races - Hispanic (% change since 2000)
Races - Native Hawaiian and Other Pacific Islander alone (%)
Races - Native Hawaiian and Other Pacific Islander alone (% change since 2000)
Races - Two or more races(%)
Races - Two or more races(% change since 2000)
Races - Other race alone (%)
Races - Other race alone (% change since 2000)
Racial diversity
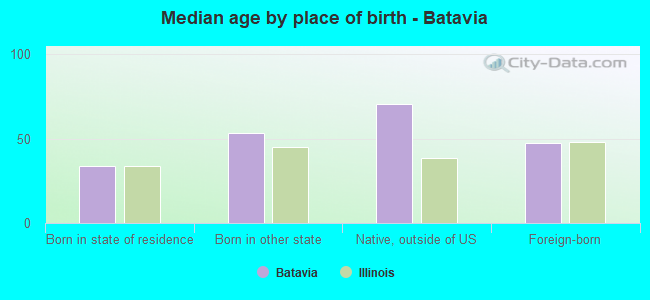
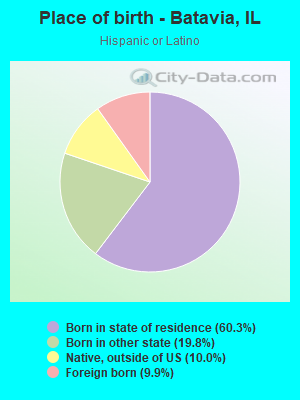
Place of birth - Born in state of residence (%)
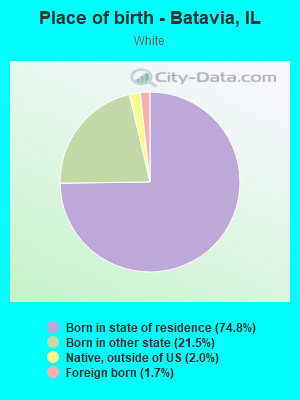
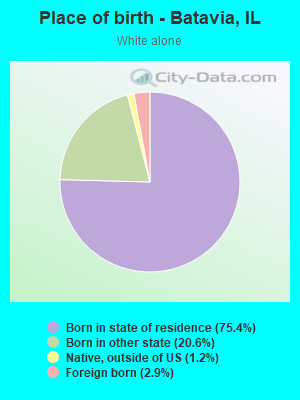
Place of birth - Born in state of residence (%) - White
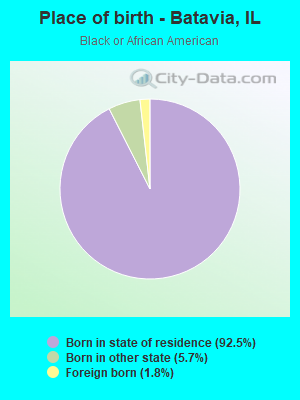
Place of birth - Born in state of residence (%) - Black or African American
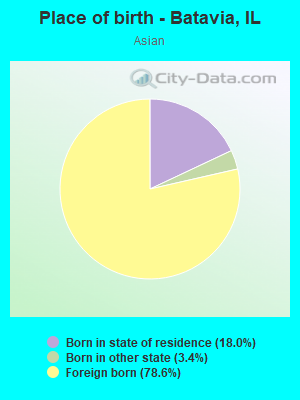
Place of birth - Born in state of residence (%) - Asian
Place of birth - Born in state of residence (%) - Hispanic or Latino
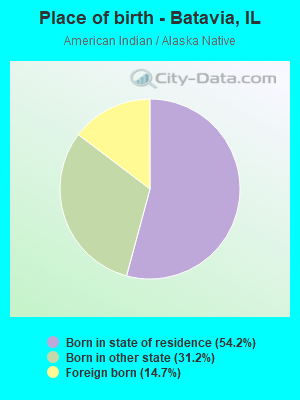
Place of birth - Born in state of residence (%) - American Indian and Alaska Native
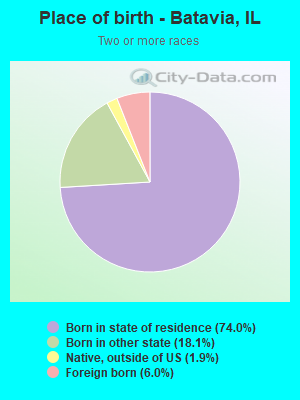
Place of birth - Born in state of residence (%) - Multirace
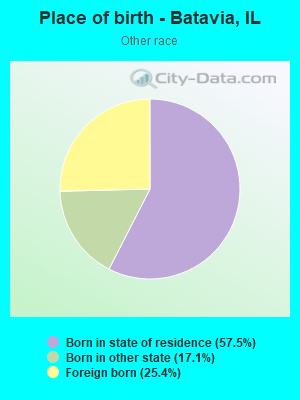
Place of birth - Born in state of residence (%) - Other Race
Place of birth - Born in other state (%)
Place of birth - Born in other state (%) - White
Place of birth - Born in other state (%) - Black or African American
Place of birth - Born in other state (%) - Asian
Place of birth - Born in other state (%) - Hispanic or Latino
Place of birth - Born in other state (%) - American Indian and Alaska Native
Place of birth - Born in other state (%) - Multirace
Place of birth - Born in other state (%) - Other Race
Place of birth - Native, outside of US (%)
Place of birth - Native, outside of US (%) - White
Place of birth - Native, outside of US (%) - Black or African American
Place of birth - Native, outside of US (%) - Asian
Place of birth - Native, outside of US (%) - Hispanic or Latino
Place of birth - Native, outside of US (%) - American Indian and Alaska Native
Place of birth - Native, outside of US (%) - Multirace
Place of birth - Native, outside of US (%) - Other Race
Place of birth - Foreign born (%)
Place of birth - Foreign born (%) - White
Place of birth - Foreign born (%) - Black or African American
Place of birth - Foreign born (%) - Asian
Place of birth - Foreign born (%) - Hispanic or Latino
Place of birth - Foreign born (%) - American Indian and Alaska Native
Place of birth - Foreign born (%) - Multirace
Place of birth - Foreign born (%) - Other Race
Residents speaking English at home (%)
Residents speaking English at home - Born in the United States (%)
Residents speaking English at home - Native, born elsewhere (%)
Residents speaking English at home - Foreign born (%)
Residents speaking Spanish at home (%)
Residents speaking Spanish at home - Born in the United States (%)
Residents speaking Spanish at home - Native, born elsewhere (%)
Residents speaking Spanish at home - Foreign born (%)
Residents speaking other language at home (%)
Residents speaking other language at home - Born in the United States (%)
Residents speaking other language at home - Native, born elsewhere (%)
Residents speaking other language at home - Foreign born (%)
Marital status - Never married (%)
Marital status - Now married (%)
Marital status - Separated (%)
Marital status - Widowed (%)
Marital status - Divorced (%)
Ancestries Reported - Arab (%)
Ancestries Reported - Czech (%)
Ancestries Reported - Danish (%)
Ancestries Reported - Dutch (%)
Ancestries Reported - English (%)
Ancestries Reported - French (%)
Ancestries Reported - French Canadian (%)
Ancestries Reported - German (%)
Ancestries Reported - Greek (%)
Ancestries Reported - Hungarian (%)
Ancestries Reported - Irish (%)
Ancestries Reported - Italian (%)
Ancestries Reported - Lithuanian (%)
Ancestries Reported - Norwegian (%)
Ancestries Reported - Polish (%)
Ancestries Reported - Portuguese (%)
Ancestries Reported - Russian (%)
Ancestries Reported - Scotch-Irish (%)
Ancestries Reported - Scottish (%)
Ancestries Reported - Slovak (%)
Ancestries Reported - Subsaharan African (%)
Ancestries Reported - Swedish (%)
Ancestries Reported - Swiss (%)
Ancestries Reported - Ukrainian (%)
Ancestries Reported - United States (%)
Ancestries Reported - Welsh (%)
Ancestries Reported - West Indian (%)
Ancestries Reported - Other (%)
Geographical mobility - Same house 1 year ago (%)
Geographical mobility - Same house 1 year ago (%) - White
Geographical mobility - Same house 1 year ago (%) - Black or African American
Geographical mobility - Same house 1 year ago (%) - Asian
Geographical mobility - Same house 1 year ago (%) - Hispanic or Latino
Geographical mobility - Same house 1 year ago (%) - American Indian and Alaska Native
Geographical mobility - Same house 1 year ago (%) - Multirace
Geographical mobility - Same house 1 year ago (%) - Other Race
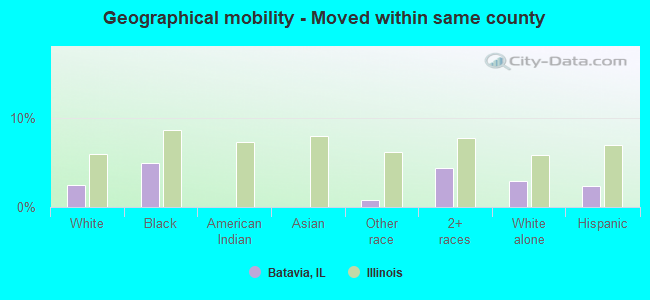
Geographical mobility - Moved within same county (%)
Geographical mobility - Moved within same county (%) - White
Geographical mobility - Moved within same county (%) - Black or African American
Geographical mobility - Moved within same county (%) - Asian
Geographical mobility - Moved within same county (%) - Hispanic or Latino
Geographical mobility - Moved within same county (%) - American Indian and Alaska Native
Geographical mobility - Moved within same county (%) - Multirace
Geographical mobility - Moved within same county (%) - Other Race
Geographical mobility - Moved from different county within same state (%)
Geographical mobility - Moved from different county within same state (%) - White
Geographical mobility - Moved from different county within same state (%) - Black or African American
Geographical mobility - Moved from different county within same state (%) - Asian
Geographical mobility - Moved from different county within same state (%) - Hispanic or Latino
Geographical mobility - Moved from different county within same state (%) - American Indian and Alaska Native
Geographical mobility - Moved from different county within same state (%) - Multirace
Geographical mobility - Moved from different county within same state (%) - Other Race
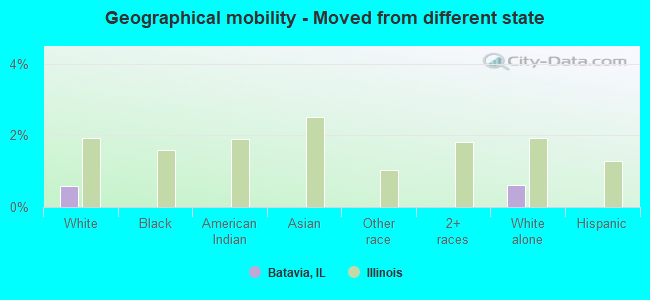
Geographical mobility - Moved from different state (%)
Geographical mobility - Moved from different state (%) - White
Geographical mobility - Moved from different state (%) - Black or African American
Geographical mobility - Moved from different state (%) - Asian
Geographical mobility - Moved from different state (%) - Hispanic or Latino
Geographical mobility - Moved from different state (%) - American Indian and Alaska Native
Geographical mobility - Moved from different state (%) - Multirace
Geographical mobility - Moved from different state (%) - Other Race
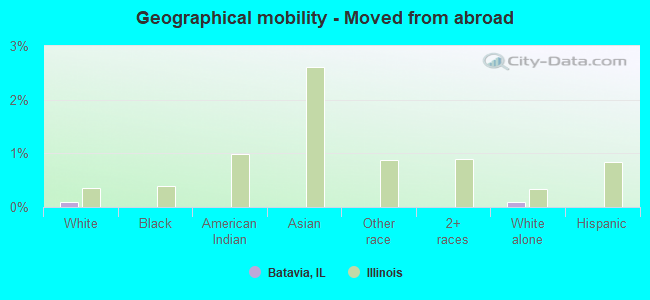
Geographical mobility - Moved from abroad (%)
Geographical mobility - Moved from abroad (%) - White
Geographical mobility - Moved from abroad (%) - Black or African American
Geographical mobility - Moved from abroad (%) - Asian
Geographical mobility - Moved from abroad (%) - Hispanic or Latino
Geographical mobility - Moved from abroad (%) - American Indian and Alaska Native
Geographical mobility - Moved from abroad (%) - Multirace
Geographical mobility - Moved from abroad (%) - Other Race
Place of birth for the foreign-born population - Ireland (%)
Place of birth for the foreign-born population - Denmark (%)
Place of birth for the foreign-born population - Norway (%)
Place of birth for the foreign-born population - Sweden (%)
Place of birth for the foreign-born population - United Kingdom (%)
Place of birth for the foreign-born population - England (%)
Place of birth for the foreign-born population - Scotland (%)
Place of birth for the foreign-born population - Other Northern Europe (%)
Place of birth for the foreign-born population - Austria (%)
Place of birth for the foreign-born population - Belgium (%)
Place of birth for the foreign-born population - France (%)
Place of birth for the foreign-born population - Germany (%)
Place of birth for the foreign-born population - Netherlands (%)
Place of birth for the foreign-born population - Switzerland (%)
Place of birth for the foreign-born population - Other Western Europe (%)
Place of birth for the foreign-born population - Greece (%)
Place of birth for the foreign-born population - Italy (%)
Place of birth for the foreign-born population - Portugal (%)
Place of birth for the foreign-born population - Spain (%)
Place of birth for the foreign-born population - Other Southern Europe (%)
Place of birth for the foreign-born population - Albania (%)
Place of birth for the foreign-born population - Belarus (%)
Place of birth for the foreign-born population - Bosnia and Herzegovina (%)
Place of birth for the foreign-born population - Bulgaria (%)
Place of birth for the foreign-born population - Croatia (%)
Place of birth for the foreign-born population - Czechoslovakia (%)
Place of birth for the foreign-born population - Hungary (%)
Place of birth for the foreign-born population - Latvia (%)
Place of birth for the foreign-born population - Lithuania (%)
Place of birth for the foreign-born population - North Macedonia (Macedonia) (%)
Place of birth for the foreign-born population - Moldova (%)
Place of birth for the foreign-born population - Poland (%)
Place of birth for the foreign-born population - Romania (%)
Place of birth for the foreign-born population - Russia (%)
Place of birth for the foreign-born population - Serbia (%)
Place of birth for the foreign-born population - Ukraine (%)
Place of birth for the foreign-born population - Other Eastern Europe (%)
Place of birth for the foreign-born population - China (%)
Place of birth for the foreign-born population - Hong Kong (%)
Place of birth for the foreign-born population - Taiwan (%)
Place of birth for the foreign-born population - Japan (%)
Place of birth for the foreign-born population - Korea (%)
Place of birth for the foreign-born population - Other Eastern Asia (%)
Place of birth for the foreign-born population - Afghanistan (%)
Place of birth for the foreign-born population - Bangladesh (%)
Place of birth for the foreign-born population - India (%)
Place of birth for the foreign-born population - Iran (%)
Place of birth for the foreign-born population - Kazakhstan (%)
Place of birth for the foreign-born population - Nepal (%)
Place of birth for the foreign-born population - Pakistan (%)
Place of birth for the foreign-born population - Sri Lanka (%)
Place of birth for the foreign-born population - Uzbekistan (%)
Place of birth for the foreign-born population - Other South Central Asia (%)
Place of birth for the foreign-born population - Burma (%)
Place of birth for the foreign-born population - Cambodia (%)
Place of birth for the foreign-born population - Indonesia (%)
Place of birth for the foreign-born population - Laos (%)
Place of birth for the foreign-born population - Malaysia (%)
Place of birth for the foreign-born population - Philippines (%)
Place of birth for the foreign-born population - Singapore (%)
Place of birth for the foreign-born population - Thailand (%)
Place of birth for the foreign-born population - Vietnam (%)
Place of birth for the foreign-born population - Other South Eastern Asia (%)
Place of birth for the foreign-born population - Armenia (%)
Place of birth for the foreign-born population - Iraq (%)
Place of birth for the foreign-born population - Israel (%)
Place of birth for the foreign-born population - Jordan (%)
Place of birth for the foreign-born population - Kuwait (%)
Place of birth for the foreign-born population - Lebanon (%)
Place of birth for the foreign-born population - Saudi Arabia (%)
Place of birth for the foreign-born population - Syria (%)
Place of birth for the foreign-born population - Turkey (%)
Place of birth for the foreign-born population - Yemen (%)
Place of birth for the foreign-born population - Other Western Asia (%)
Place of birth for the foreign-born population - Eritrea (%)
Place of birth for the foreign-born population - Ethiopia (%)
Place of birth for the foreign-born population - Kenya (%)
Place of birth for the foreign-born population - Somalia (%)
Place of birth for the foreign-born population - Uganda (%)
Place of birth for the foreign-born population - Zimbabwe (%)
Place of birth for the foreign-born population - Other Eastern Africa (%)
Place of birth for the foreign-born population - Cameroon (%)
Place of birth for the foreign-born population - Congo (%)
Place of birth for the foreign-born population - Democratic Republic of Congo (Zaire) (%)
Place of birth for the foreign-born population - Other Middle Africa (%)
Place of birth for the foreign-born population - Egypt (%)
Place of birth for the foreign-born population - Morocco (%)
Place of birth for the foreign-born population - Sudan (%)
Place of birth for the foreign-born population - Other Northern Africa (%)
Place of birth for the foreign-born population - South Africa (%)
Place of birth for the foreign-born population - Other Southern Africa (%)
Place of birth for the foreign-born population - Cabo Verde (%)
Place of birth for the foreign-born population - Ghana (%)
Place of birth for the foreign-born population - Liberia (%)
Place of birth for the foreign-born population - Nigeria (%)
Place of birth for the foreign-born population - Senegal (%)
Place of birth for the foreign-born population - Sierra Leone (%)
Place of birth for the foreign-born population - Other Western Africa (%)
Place of birth for the foreign-born population - Australia (%)
Place of birth for the foreign-born population - New Zealand (%)
Place of birth for the foreign-born population - Fiji (%)
Place of birth for the foreign-born population - Micronesia (%)
Place of birth for the foreign-born population - Bahamas (%)
Place of birth for the foreign-born population - Barbados (%)
Place of birth for the foreign-born population - Cuba (%)
Place of birth for the foreign-born population - Dominica (%)
Place of birth for the foreign-born population - Dominican Republic (%)
Place of birth for the foreign-born population - Grenada (%)
Place of birth for the foreign-born population - Haiti (%)
Place of birth for the foreign-born population - Jamaica (%)
Place of birth for the foreign-born population - St. Vincent and the Grenadines (%)
Place of birth for the foreign-born population - Trinidad and Tobago (%)
Place of birth for the foreign-born population - West Indies (%)
Place of birth for the foreign-born population - Other Caribbean (%)
Place of birth for the foreign-born population - Belize (%)
Place of birth for the foreign-born population - Costa Rica (%)
Place of birth for the foreign-born population - El Salvador (%)
Place of birth for the foreign-born population - Guatemala (%)
Place of birth for the foreign-born population - Honduras (%)
Place of birth for the foreign-born population - Mexico (%)
Place of birth for the foreign-born population - Nicaragua (%)
Place of birth for the foreign-born population - Panama (%)
Place of birth for the foreign-born population - Other Central America (%)
Place of birth for the foreign-born population - Argentina (%)
Place of birth for the foreign-born population - Bolivia (%)
Place of birth for the foreign-born population - Brazil (%)
Place of birth for the foreign-born population - Chile (%)
Place of birth for the foreign-born population - Colombia (%)
Place of birth for the foreign-born population - Ecuador (%)
Place of birth for the foreign-born population - Guyana (%)
Place of birth for the foreign-born population - Peru (%)
Place of birth for the foreign-born population - Uruguay (%)
Place of birth for the foreign-born population - Venezuela (%)
Place of birth for the foreign-born population - Other South America (%)
Place of birth for the foreign-born population - Canada (%)
Place of birth for the foreign-born population - Other Northern America (%)
Place of birth for the foreign-born population - Other (%)
Latest news about races in Batavia, IL collected exclusively by city-data.com from local newspapers, TV, and radio stations
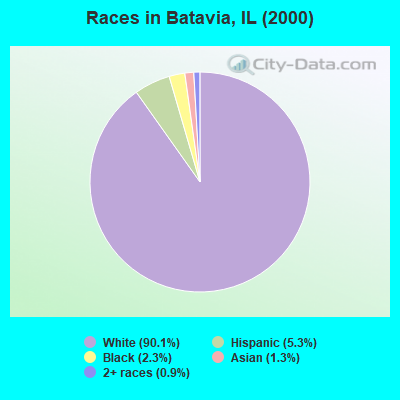
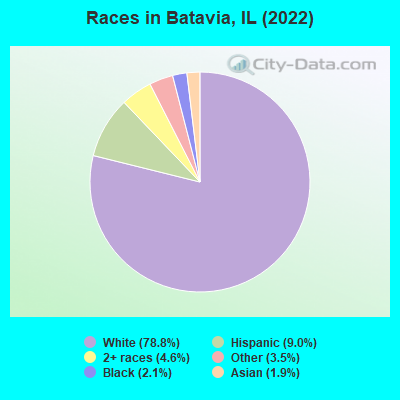
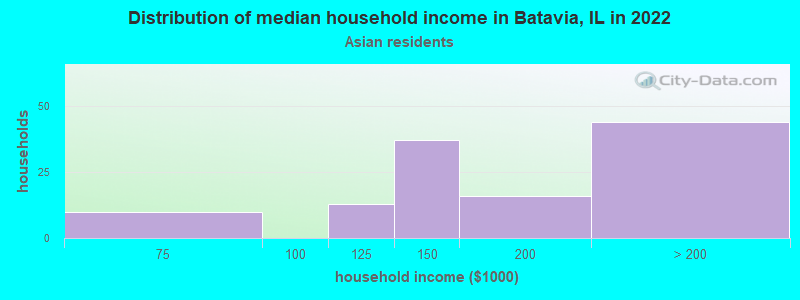
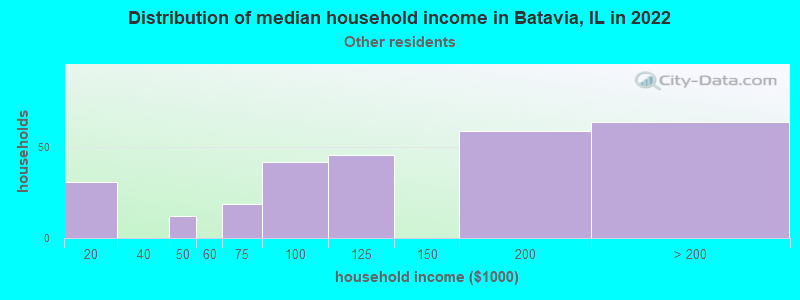
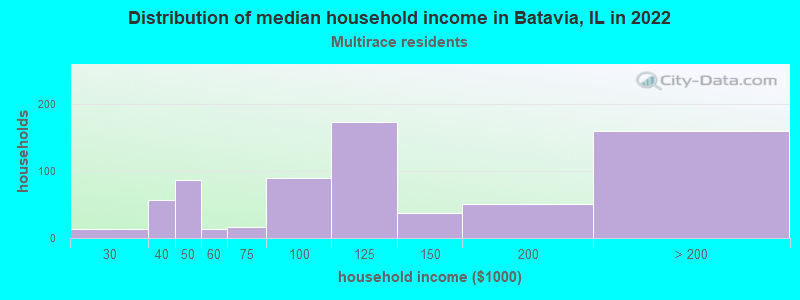
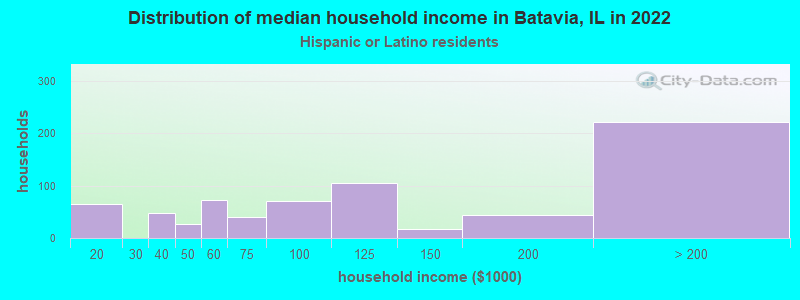
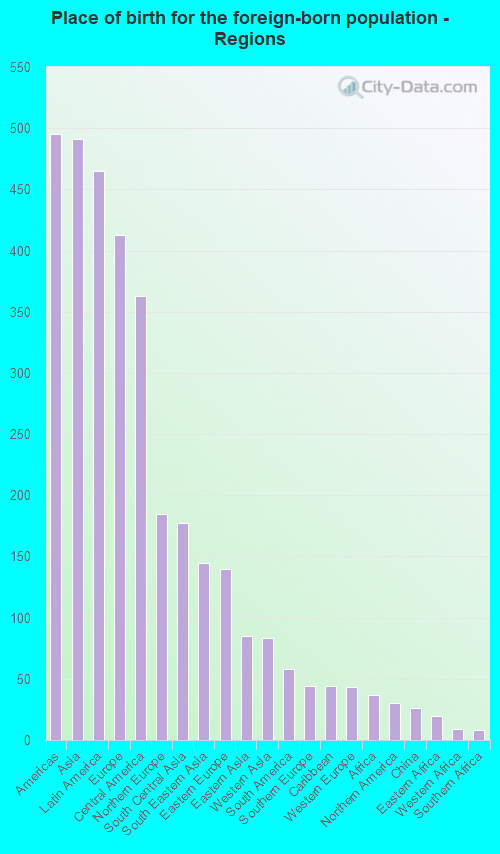
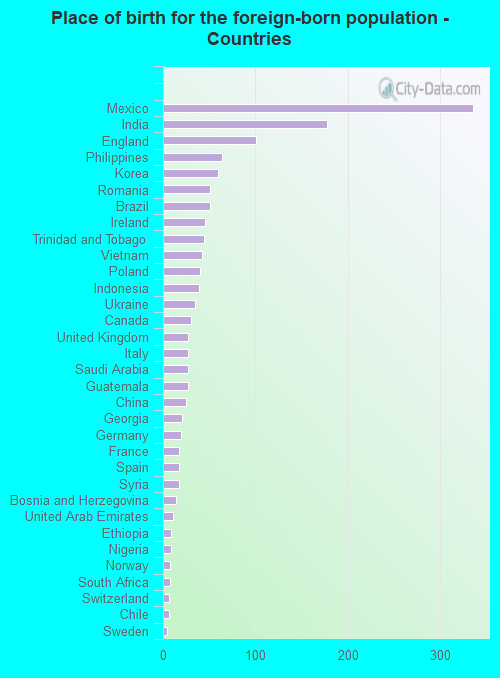
According to 2022 data, the most numerous races in Batavia, IL are White alone (20,650 residents), Hispanic (2,359 residents), and Black alone (548 residents). 91.2% of Batavia residents speak English at home. 5.5% of Batavia, IL residents are foreign-born (1.9% born in Asia, 1.8% born in Latin America, 1.6% born in Europe), which is 155.2% less than the foreign-born rate of 14.0% across the entire state of Illinois.
Race distribution in Batavia
2000 2022
8,424,140 67.8% White alone 1,856,152 14.9% Black alone 1,530,262 12.3% Hispanic 419,916 3.4% Asian alone 153,996 1.2% Two or more races 13,479 0.1% Other race alone 18,232 0.1% American Indian alone 3,116 0.03% Native Hawaiian and Other
7,356,301 58.5% White alone 2,299,726 18.3% Hispanic 1,660,423 13.2% Black alone 747,296 5.9% Asian alone 458,599 3.6% Two or more races 45,386 0.4% Other race alone 10,405 0.08% American Indian alone 3,896 0.03% Native Hawaiian and Other
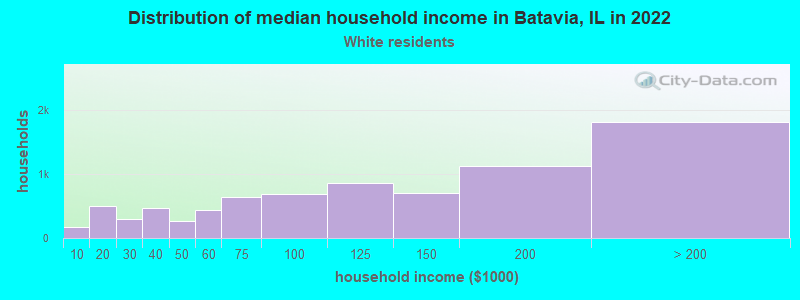
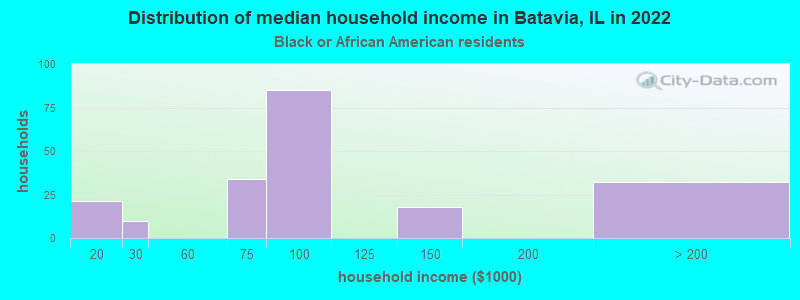
Income and house value in Batavia Median household income in 2022 $111,945 White non-Hispanic householders$96,371 Black householders$138,433 Asian householders$115,747 Some other race householders$119,963 Two or more races householders$112,809 Hispanic or Latino race householdersMedian 2022 house value $378,985 White Non-Hispanic householders$223,370 Black or African American householders $362,977 Asian householders$413,421 Some other race householders$209,410 Two or more races householders$401,322 Hispanic or Latino householders
Median age by race in Batavia
44.3 Median age for White residents41.9 46.0 39.9 Median age for Black or African American residents39.8 34.7 49.9 Median age for American Indian / Alaska Native residents-505,112,473.9 -949,999,999.1 35.8 Median age for Asian residents33.3 40.7 -593,236,714.4 Median age for Native Hawaiian / Pacific Islander residents-658,536,584.7 -576,015,108.0 27.2 Median age for Other race residents27.6 30.0 19.8 Median age for Two or more races residents19.1 20.2 42.1 Median age for White alone residents39.8 43.8 29.1 Median age for Hispanic or Latino residents29.6 21.0
Owner/renter occupied households by race in Batavia
House owners and renters - White residents 6,256 79.1% Owner occupied1,653 20.9% Renter occupiedHouse owners and renters - Black or African American residents 103 47.0% Owner occupied116 53.0% Renter occupiedHouse owners and renters - American Indian / Alaska Native residents 31 100.0% Owner occupiedHouse owners and renters - Asian residents 123 89.8% Owner occupied14 10.2% Renter occupiedHouse owners and renters - Other race residents 212 67.5% Owner occupied102 32.5% Renter occupiedHouse owners and renters - Two or more races residents 455 66.6% Owner occupied228 33.4% Renter occupiedHouse owners and renters - White alone residents 6,506 78.6% Owner occupied1,769 21.4% Renter occupiedHouse owners and renters - Hispanic or Latino residents 445 63.0% Owner occupied262 37.0% Renter occupied
Language usage in Batavia
English speakers - Total 91.2% of residents of Batavia speak English at home.
5.2% of residents speak Spanish at home 1,012 80.2% Speak English very well250 19.8% Speak English less than very well3.3% of residents speak other language at home 613 76.9% Speak English very well184 23.1% Speak English less than very well
English speakers - Born in the United States 96.7% of residents of Batavia speak English at home.
3.1% of residents speak Spanish at home 142 95.3% Speak English very well7 4.7% Speak English less than very well0.5% of residents speak other language at home 22 100.0% Speak English very well
English speakers - Native, born elsewhere 34.8% of residents of Batavia speak English at home.
53.6% of residents speak Spanish at home 233 95.1% Speak English very well12 4.9% Speak English less than very well2.0% of residents speak other language at home 9 100.0% Speak English very well
English speakers - Foreign-born 43.6% of residents of Batavia speak English at home.
24.2% of residents speak Spanish at home 170 47.4% Speak English very well189 52.6% Speak English less than very well37.0% of residents speak other language at home 441 80.5% Speak English very well107 19.5% Speak English less than very well
White (Caucasian) - Speak only English Native:
100.0% (18,125)Foreign-born:
82.0% (278)
White (Caucasian) - Speak another language Native:
1.7% (305)Foreign-born:
42.8% (145)
Black or African American - Speak another language Native:
0.1% (1)Foreign-born:
81.8% (8)
Asian - Speak only English Native:
68.2% (50)Foreign-born:
43.2% (174)
Asian - Speak another language Native:
27.7% (20)Foreign-born:
56.8% (229)
Other race - Speak only English Native:
55.1% (563)Foreign-born:
9.2% (36)
Other race - Speak another language Native:
49.9% (511)Foreign-born:
91.6% (360)
Two or more races - Speak only English Native:
98.4% (1,837)Foreign-born:
92.4% (129)
Two or more races - Speak another language Native:
4.3% (80)Foreign-born:
18.3% (26)
White alone - Speak only English Native:
98.8% (18,391)Foreign-born:
53.5% (315)
White alone - Speak another language Native:
1.3% (241)Foreign-born:
45.3% (267)
Hispanic or Latino - Speak only English Native:
67.2% (1,246)Foreign-born:
23.8% (53)
Hispanic or Latino - Speak another language Native:
33.4% (619)Foreign-born:
80.6% (181)
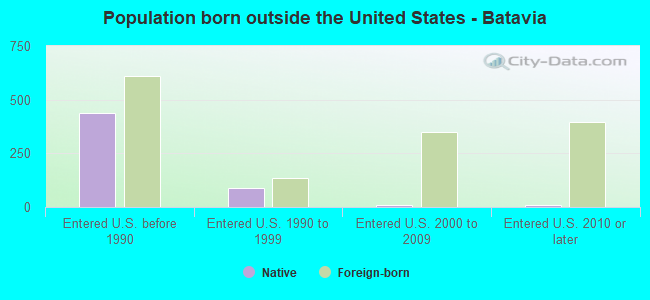
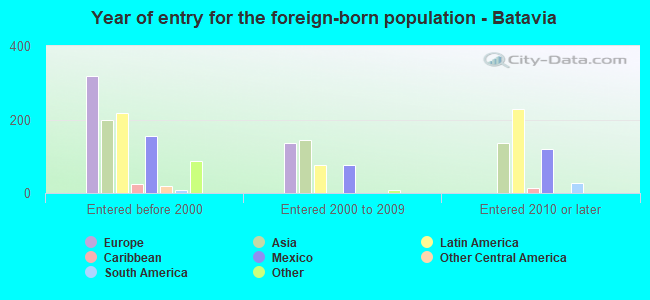
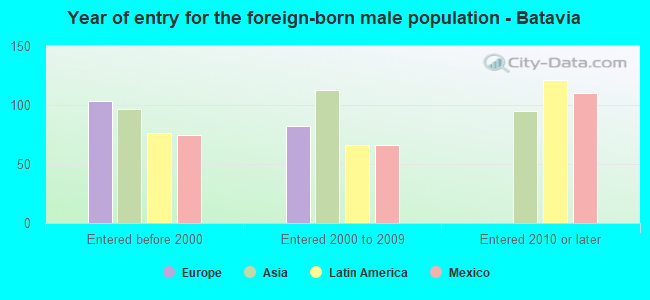
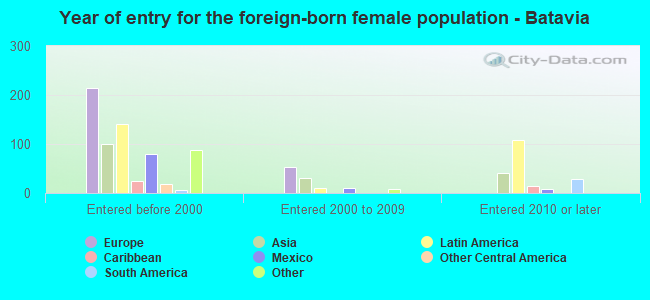
Foreign-born residents in Batavia 1,437 residents are foreign born (1.9% Asia , 1.8% Latin America , 1.6% Europe ).
This city:
5.5%Illinois:
14.1%
Marital status for residents in Batavia Marital status - White (Caucasian) population 15 years and over
Males 23.6% Never married64.4% Now married1.3% Separated1.8% Widowed8.9% DivorcedFemales 22.6% Never married57.7% Now married0.2% Separated8.5% Widowed11.0% DivorcedWomen who gave birth in the past 12 months Now married:
89.5% (226)Unmarried:
10.5% (26)
Women who did not give birth in the past 12 months Now married:
53.0% (1,898)Unmarried:
47.0% (1,684)
Marital status - Black or African American population 15 years and over
Males 21.5% Never married70.0% Now married0.0% Separated0.0% Widowed8.4% DivorcedFemales 38.4% Never married44.6% Now married0.0% Separated12.9% Widowed4.1% DivorcedWomen who gave birth in the past 12 months Now married:
100.0% (51)Unmarried:
0.0% (0)
Women who did not give birth in the past 12 months Now married:
36.0% (38)Unmarried:
64.0% (67)
Marital status - American Indian / Alaska Native population 15 years and over
Males 100.0% Never married0.0% Now married0.0% Separated0.0% Widowed0.0% DivorcedFemales 0.0% Never married43.2% Now married0.0% Separated0.0% Widowed56.8% DivorcedWomen who did not give birth in the past 12 months Now married:
43.2% (27)Unmarried:
56.8% (35)
Marital status - Asian population 15 years and over
Males 29.9% Never married70.1% Now married0.0% Separated0.0% Widowed0.0% DivorcedFemales 21.7% Never married62.7% Now married0.0% Separated15.5% Widowed0.0% DivorcedWomen who did not give birth in the past 12 months Now married:
61.1% (62)Unmarried:
38.9% (40)
Marital status - Other race population 15 years and over
Males 64.2% Never married35.0% Now married0.0% Separated0.0% Widowed0.8% DivorcedFemales 29.6% Never married64.6% Now married2.8% Separated0.0% Widowed3.0% DivorcedWomen who gave birth in the past 12 months Now married:
41.9% (17)Unmarried:
58.1% (23)
Women who did not give birth in the past 12 months Now married:
71.9% (274)Unmarried:
28.1% (107)
Marital status - Two or more races population 15 years and over
Males 39.2% Never married49.1% Now married0.0% Separated0.0% Widowed11.7% DivorcedFemales 40.1% Never married32.1% Now married0.0% Separated7.1% Widowed20.8% DivorcedWomen who did not give birth in the past 12 months Now married:
36.3% (182)Unmarried:
63.7% (320)
Marital status - White alone, not Hispanic / Latino population 15 years and over
Males 24.2% Never married64.3% Now married1.4% Separated1.9% Widowed8.3% DivorcedFemales 22.4% Never married57.2% Now married0.2% Separated8.7% Widowed11.4% DivorcedWomen who gave birth in the past 12 months Now married:
87.7% (219)Unmarried:
12.3% (31)
Women who did not give birth in the past 12 months Now married:
53.2% (2,121)Unmarried:
46.8% (1,868)
Marital status - Hispanic or Latino population 15 years and over
Males 38.5% Never married51.2% Now married0.0% Separated0.0% Widowed10.3% DivorcedFemales 32.5% Never married48.6% Now married1.6% Separated5.3% Widowed12.1% DivorcedWomen who gave birth in the past 12 months Now married:
71.9% (47)Unmarried:
28.1% (18)
Women who did not give birth in the past 12 months Now married:
40.7% (154)Unmarried:
59.3% (224)
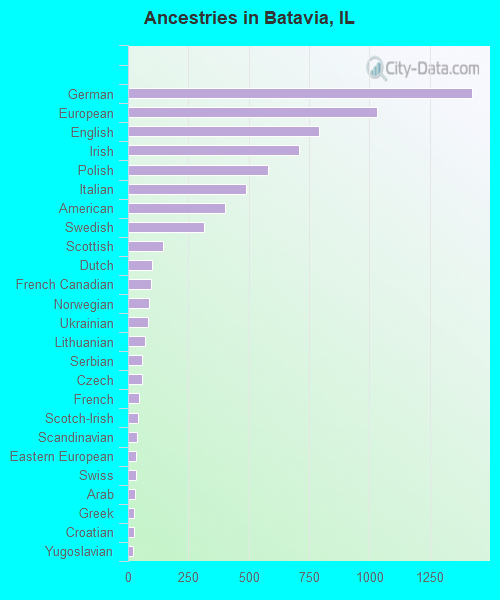
Ancestries in Batavia
1,425 14.8% German1,033 10.8% European793 8.3% English709 7.4% Irish582 6.1% Polish491 5.1% Italian403 4.2% American314 3.3% Swedish145 1.5% Scottish101 1.1% Dutch95 1.0% French Canadian87 0.9% Norwegian83 0.9% Ukrainian69 0.7% Lithuanian60 0.6% Serbian57 0.6% Czech44 0.5% French42 0.4% Scotch-Irish37 0.4% Scandinavian34 0.4% Eastern European34 0.4% Swiss28 0.3% Arab23 0.2% Greek23 0.2% Croatian19 0.2% Yugoslavian18 0.2% Luxembourger17 0.2% Slovak15 0.2% Armenian13 0.1% Syrian11 0.1% African10 0.1% Danish9 0.09% Slovene9 0.09% Nigerian8 0.08% Czechoslovakian8 0.08% Cypriot8 0.08% British8 0.08% Finnish7 0.07% Albanian7 0.07% Egyptian6 0.06% Hungarian5 0.05% Welsh3 0.03% Austrian
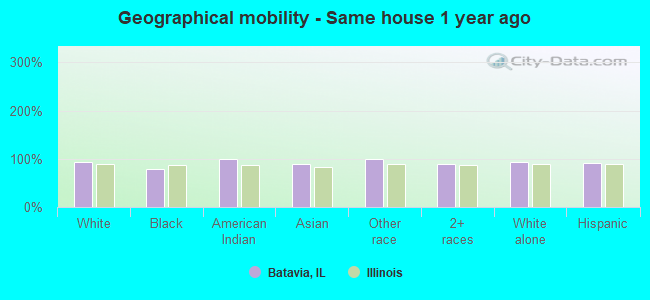
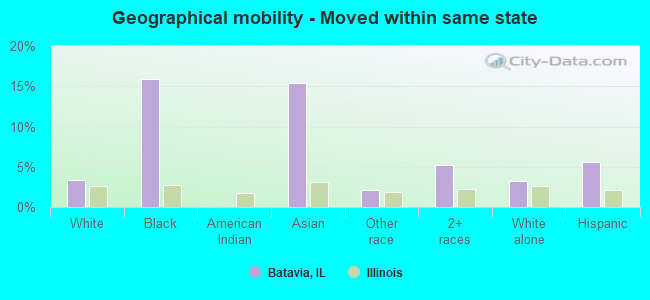
Geographical mobility in Batavia Same house 1 year ago 18,032 93.9% White (Caucasian)423 78.0% Black or African American65 99.7% American Indian / Alaska Native464 88.9% Asian1,463 99.8% Other race1,982 89.6% Two or more races19,153 93.3% White alone, not Hispanic / Latino2,071 92.1% Hispanic or LatinoMoved within same county 480 2.5% White / Caucasian27 4.9% Black or African American12 0.8% Other race96 4.4% Two or more races590 2.9% White alone, not Hispanic / Latino54 2.4% Hispanic or LatinoMoved within same state 640 3.3% White / Caucasian86 15.9% Black or African American80 15.4% Asian30 2.1% Other race116 5.3% Two or more races664 3.2% White alone, not Hispanic / Latino125 5.5% Hispanic or LatinoMoved from different state 112 0.6% White / Caucasian125 0.6% White alone, not Hispanic / LatinoMoved from abroad 20 0.1% White19 0.1% White alone, not Hispanic / Latino
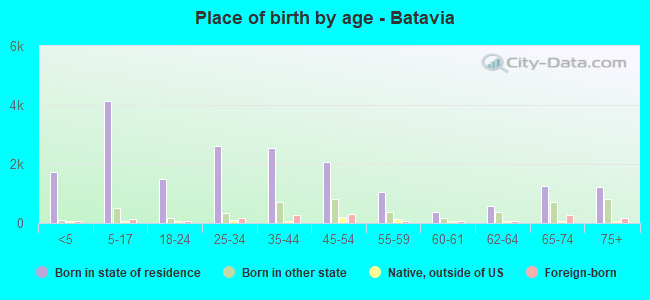
Children Nativity (place of birth) in Batavia
Children under 6 years - Living with two parents Both parents native 1,650 100.0% NativeBoth parents foreign-born 29 100.0% NativeOne native, one foreign-born parent 431 100.0% NativeChildren under 6 years - Living with one parent Native parent 178 100.0% NativeChildren 6 to 17 years - Living with two parents Both parents native 2,831 95.1% Native144 4.9% Foreign-bornBoth parents foreign-born 116 100.0% NativeOne native, one foreign-born parent 178 94.2% Native11 5.8% Foreign-bornChildren 6 to 17 years - Living with one parent Native parent 841 100.0% NativeForeign-born parent 50 51.0% Native48 49.0% Foreign-born
Grandparents responsible for own grandchildren in Batavia
Grandparents (30 to 59 years) White / Caucasian 131 42.0% Responsible for grandchildren181 58.0% Not responsible for grandchildrenOther race 105 100.0% Not responsible for grandchildrenWhite alone, not Hispanic / Latino 133 59.1% Responsible for grandchildren92 40.9% Not responsible for grandchildrenHispanic or Latino 36 17.8% Responsible for grandchildren165 82.2% Not responsible for grandchildren
Grandparents (60 years and over) White / Caucasian 128 100.0% Not responsible for grandchildrenWhite alone, not Hispanic / Latino 135 100.0% Not responsible for grandchildrenHispanic or Latino 17 100.0% Not responsible for grandchildren