Races in Barrington, Rhode Island (RI) Detailed Stats
Ancestries, Foreign-born residents, place of birth

Recent posts about races in Barrington, Rhode Island on our local forum with over 2,400,000 registered users:
 | Rhode Island is introducing legislation to ban critical race (750 replies) |
| Safety on Abbott St (east side of Providence) (86 replies) |
| Top Democrats Flock to One of Whitest and Most Affluent RI Communities (138 replies) |
| Barrington Schools vs Massachusetts schools near Providence (99 replies) |
| Crazy Rhode Island real estate market (525 replies) |
| Is now a good time to buy in RI? (107 replies) |
Latest news about races in Barrington, RI collected exclusively by city-data.com from local newspapers, TV, and radio stations
5.6% of Barrington, RI residents are foreign-born (2.9% born in Europe, 1.1% born in Asia, 0.8% born in Latin America, 0.6% born in North America), which is 149.2% less than the foreign-born rate of 14.0% across the entire state of Rhode Island.
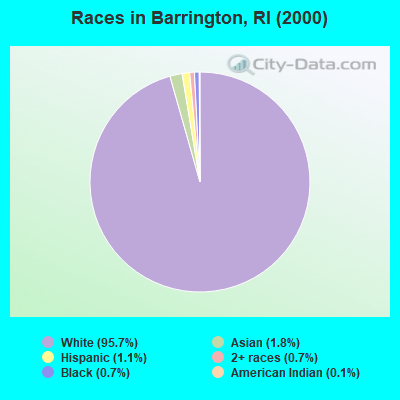
Race distribution in Barrington

- 16,09295.7%White alone
- 2961.8%Asian alone
- 1771.1%Hispanic
- 1150.7%Two or more races
- 1110.7%Black alone
- 170.1%American Indian alone
- 110.07%Other race alone
2000
2022
-
- 858,43381.9%White alone
- 90,8208.7%Hispanic
- 41,9224.0%Black alone
- 23,4162.2%Asian alone
- 20,8162.0%Two or more races
- 8,4110.8%Other race alone
- 4,1810.4%American Indian alone
- 3200.03%Native Hawaiian and Other
Pacific Islander alone

-
- 745,82568.2%White alone
- 191,97917.6%Hispanic
- 56,7385.2%Two or more races
- 51,3264.7%Black alone
- 37,2343.4%Asian alone
- 9,5140.9%Other race alone
- 9780.09%American Indian alone
- 1400.01%Native Hawaiian and Other
Pacific Islander alone

Income and house value in Barrington
- Median household income in 2022
- $141,338White non-Hispanic householders
- over $200,000Black householders
- over $200,000Asian householders
- over $200,000Some other race householders
- $51,603Two or more races householders
- over $200,000Hispanic or Latino race householders
- Median 2022 house value
- $601,828White Non-Hispanic householders
- $431,178Black or African American householders
- $630,674Asian householders
- $607,294Some other race householders
- $683,205Two or more races householders
- $658,003Hispanic or Latino householders
Household income for White non-Hispanic householders

Household income for Black householders

Household income for Asian householders

Household income for Two or more races householders

Household income for Hispanic or Latino race householders

Foreign-born residents in Barrington
945 residents are foreign born (2.9% Europe, 1.1% Asia, 0.8% Latin America, 0.6% North America).
| This city: | 5.6% |
| Rhode Island: | 11.4% |
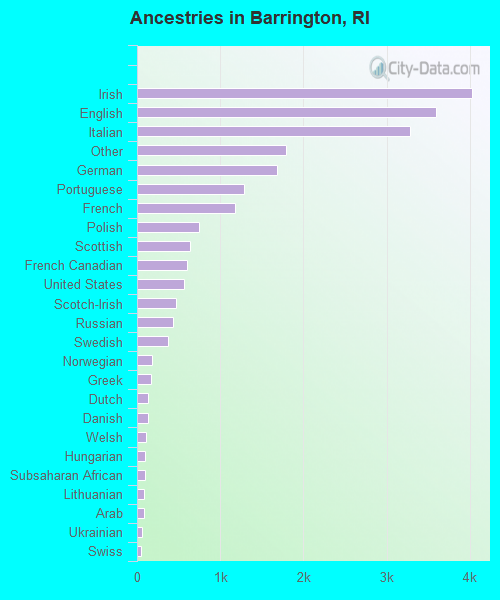
Ancestries in Barrington

- 4,02818.4%Irish
- 3,58716.4%English
- 3,28415.0%Italian
- 1,7888.2%Other
- 1,6877.7%German
- 1,2915.9%Portuguese
- 1,1825.4%French
- 7463.4%Polish
- 6342.9%Scottish
- 6022.7%French Canadian
- 5612.6%United States
- 4672.1%Scotch-Irish
- 4322.0%Russian
- 3681.7%Swedish
- 1760.8%Norwegian
- 1640.7%Greek
- 1350.6%Dutch
- 1290.6%Danish
- 1050.5%Welsh
- 960.4%Hungarian
- 910.4%Subsaharan African
- 860.4%Lithuanian
- 850.4%Arab
- 650.3%Ukrainian
- 460.2%Swiss
- 400.2%West Indian
- 320.1%Slovak
- 150.07%Czech
Zip codes: 02806.