Races in Ballwin, Missouri (MO) Detailed Stats
Data:
Races - White alone (%)
Races - White alone (% change since 2000)
Races - Black alone (%)
Races - Black alone (% change since 2000)
Races - American Indian alone (%)
Races - American Indian alone (% change since 2000)
Races - Asian alone (%)
Races - Asian alone (% change since 2000)
Races - Hispanic (%)
Races - Hispanic (% change since 2000)
Races - Native Hawaiian and Other Pacific Islander alone (%)
Races - Native Hawaiian and Other Pacific Islander alone (% change since 2000)
Races - Two or more races(%)
Races - Two or more races(% change since 2000)
Races - Other race alone (%)
Races - Other race alone (% change since 2000)
Racial diversity
Place of birth - Born in state of residence (%)
Place of birth - Born in state of residence (%) - White
Place of birth - Born in state of residence (%) - Black or African American
Place of birth - Born in state of residence (%) - Asian
Place of birth - Born in state of residence (%) - Hispanic or Latino
Place of birth - Born in state of residence (%) - American Indian and Alaska Native
Place of birth - Born in state of residence (%) - Multirace
Place of birth - Born in state of residence (%) - Other Race
Place of birth - Born in other state (%)
Place of birth - Born in other state (%) - White
Place of birth - Born in other state (%) - Black or African American
Place of birth - Born in other state (%) - Asian
Place of birth - Born in other state (%) - Hispanic or Latino
Place of birth - Born in other state (%) - American Indian and Alaska Native
Place of birth - Born in other state (%) - Multirace
Place of birth - Born in other state (%) - Other Race
Place of birth - Native, outside of US (%)
Place of birth - Native, outside of US (%) - White
Place of birth - Native, outside of US (%) - Black or African American
Place of birth - Native, outside of US (%) - Asian
Place of birth - Native, outside of US (%) - Hispanic or Latino
Place of birth - Native, outside of US (%) - American Indian and Alaska Native
Place of birth - Native, outside of US (%) - Multirace
Place of birth - Native, outside of US (%) - Other Race
Place of birth - Foreign born (%)
Place of birth - Foreign born (%) - White
Place of birth - Foreign born (%) - Black or African American
Place of birth - Foreign born (%) - Asian
Place of birth - Foreign born (%) - Hispanic or Latino
Place of birth - Foreign born (%) - American Indian and Alaska Native
Place of birth - Foreign born (%) - Multirace
Place of birth - Foreign born (%) - Other Race
Residents speaking English at home (%)
Residents speaking English at home - Born in the United States (%)
Residents speaking English at home - Native, born elsewhere (%)
Residents speaking English at home - Foreign born (%)
Residents speaking Spanish at home (%)
Residents speaking Spanish at home - Born in the United States (%)
Residents speaking Spanish at home - Native, born elsewhere (%)
Residents speaking Spanish at home - Foreign born (%)
Residents speaking other language at home (%)
Residents speaking other language at home - Born in the United States (%)
Residents speaking other language at home - Native, born elsewhere (%)
Residents speaking other language at home - Foreign born (%)
Marital status - Never married (%)
Marital status - Now married (%)
Marital status - Separated (%)
Marital status - Widowed (%)
Marital status - Divorced (%)
Ancestries Reported - Arab (%)
Ancestries Reported - Czech (%)
Ancestries Reported - Danish (%)
Ancestries Reported - Dutch (%)
Ancestries Reported - English (%)
Ancestries Reported - French (%)
Ancestries Reported - French Canadian (%)
Ancestries Reported - German (%)
Ancestries Reported - Greek (%)
Ancestries Reported - Hungarian (%)
Ancestries Reported - Irish (%)
Ancestries Reported - Italian (%)
Ancestries Reported - Lithuanian (%)
Ancestries Reported - Norwegian (%)
Ancestries Reported - Polish (%)
Ancestries Reported - Portuguese (%)
Ancestries Reported - Russian (%)
Ancestries Reported - Scotch-Irish (%)
Ancestries Reported - Scottish (%)
Ancestries Reported - Slovak (%)
Ancestries Reported - Subsaharan African (%)
Ancestries Reported - Swedish (%)
Ancestries Reported - Swiss (%)
Ancestries Reported - Ukrainian (%)
Ancestries Reported - United States (%)
Ancestries Reported - Welsh (%)
Ancestries Reported - West Indian (%)
Ancestries Reported - Other (%)
Geographical mobility - Same house 1 year ago (%)
Geographical mobility - Same house 1 year ago (%) - White
Geographical mobility - Same house 1 year ago (%) - Black or African American
Geographical mobility - Same house 1 year ago (%) - Asian
Geographical mobility - Same house 1 year ago (%) - Hispanic or Latino
Geographical mobility - Same house 1 year ago (%) - American Indian and Alaska Native
Geographical mobility - Same house 1 year ago (%) - Multirace
Geographical mobility - Same house 1 year ago (%) - Other Race
Geographical mobility - Moved within same county (%)
Geographical mobility - Moved within same county (%) - White
Geographical mobility - Moved within same county (%) - Black or African American
Geographical mobility - Moved within same county (%) - Asian
Geographical mobility - Moved within same county (%) - Hispanic or Latino
Geographical mobility - Moved within same county (%) - American Indian and Alaska Native
Geographical mobility - Moved within same county (%) - Multirace
Geographical mobility - Moved within same county (%) - Other Race
Geographical mobility - Moved from different county within same state (%)
Geographical mobility - Moved from different county within same state (%) - White
Geographical mobility - Moved from different county within same state (%) - Black or African American
Geographical mobility - Moved from different county within same state (%) - Asian
Geographical mobility - Moved from different county within same state (%) - Hispanic or Latino
Geographical mobility - Moved from different county within same state (%) - American Indian and Alaska Native
Geographical mobility - Moved from different county within same state (%) - Multirace
Geographical mobility - Moved from different county within same state (%) - Other Race
Geographical mobility - Moved from different state (%)
Geographical mobility - Moved from different state (%) - White
Geographical mobility - Moved from different state (%) - Black or African American
Geographical mobility - Moved from different state (%) - Asian
Geographical mobility - Moved from different state (%) - Hispanic or Latino
Geographical mobility - Moved from different state (%) - American Indian and Alaska Native
Geographical mobility - Moved from different state (%) - Multirace
Geographical mobility - Moved from different state (%) - Other Race
Geographical mobility - Moved from abroad (%)
Geographical mobility - Moved from abroad (%) - White
Geographical mobility - Moved from abroad (%) - Black or African American
Geographical mobility - Moved from abroad (%) - Asian
Geographical mobility - Moved from abroad (%) - Hispanic or Latino
Geographical mobility - Moved from abroad (%) - American Indian and Alaska Native
Geographical mobility - Moved from abroad (%) - Multirace
Geographical mobility - Moved from abroad (%) - Other Race
Place of birth for the foreign-born population - Ireland (%)
Place of birth for the foreign-born population - Denmark (%)
Place of birth for the foreign-born population - Norway (%)
Place of birth for the foreign-born population - Sweden (%)
Place of birth for the foreign-born population - United Kingdom (%)
Place of birth for the foreign-born population - England (%)
Place of birth for the foreign-born population - Scotland (%)
Place of birth for the foreign-born population - Other Northern Europe (%)
Place of birth for the foreign-born population - Austria (%)
Place of birth for the foreign-born population - Belgium (%)
Place of birth for the foreign-born population - France (%)
Place of birth for the foreign-born population - Germany (%)
Place of birth for the foreign-born population - Netherlands (%)
Place of birth for the foreign-born population - Switzerland (%)
Place of birth for the foreign-born population - Other Western Europe (%)
Place of birth for the foreign-born population - Greece (%)
Place of birth for the foreign-born population - Italy (%)
Place of birth for the foreign-born population - Portugal (%)
Place of birth for the foreign-born population - Spain (%)
Place of birth for the foreign-born population - Other Southern Europe (%)
Place of birth for the foreign-born population - Albania (%)
Place of birth for the foreign-born population - Belarus (%)
Place of birth for the foreign-born population - Bosnia and Herzegovina (%)
Place of birth for the foreign-born population - Bulgaria (%)
Place of birth for the foreign-born population - Croatia (%)
Place of birth for the foreign-born population - Czechoslovakia (%)
Place of birth for the foreign-born population - Hungary (%)
Place of birth for the foreign-born population - Latvia (%)
Place of birth for the foreign-born population - Lithuania (%)
Place of birth for the foreign-born population - North Macedonia (Macedonia) (%)
Place of birth for the foreign-born population - Moldova (%)
Place of birth for the foreign-born population - Poland (%)
Place of birth for the foreign-born population - Romania (%)
Place of birth for the foreign-born population - Russia (%)
Place of birth for the foreign-born population - Serbia (%)
Place of birth for the foreign-born population - Ukraine (%)
Place of birth for the foreign-born population - Other Eastern Europe (%)
Place of birth for the foreign-born population - China (%)
Place of birth for the foreign-born population - Hong Kong (%)
Place of birth for the foreign-born population - Taiwan (%)
Place of birth for the foreign-born population - Japan (%)
Place of birth for the foreign-born population - Korea (%)
Place of birth for the foreign-born population - Other Eastern Asia (%)
Place of birth for the foreign-born population - Afghanistan (%)
Place of birth for the foreign-born population - Bangladesh (%)
Place of birth for the foreign-born population - India (%)
Place of birth for the foreign-born population - Iran (%)
Place of birth for the foreign-born population - Kazakhstan (%)
Place of birth for the foreign-born population - Nepal (%)
Place of birth for the foreign-born population - Pakistan (%)
Place of birth for the foreign-born population - Sri Lanka (%)
Place of birth for the foreign-born population - Uzbekistan (%)
Place of birth for the foreign-born population - Other South Central Asia (%)
Place of birth for the foreign-born population - Burma (%)
Place of birth for the foreign-born population - Cambodia (%)
Place of birth for the foreign-born population - Indonesia (%)
Place of birth for the foreign-born population - Laos (%)
Place of birth for the foreign-born population - Malaysia (%)
Place of birth for the foreign-born population - Philippines (%)
Place of birth for the foreign-born population - Singapore (%)
Place of birth for the foreign-born population - Thailand (%)
Place of birth for the foreign-born population - Vietnam (%)
Place of birth for the foreign-born population - Other South Eastern Asia (%)
Place of birth for the foreign-born population - Armenia (%)
Place of birth for the foreign-born population - Iraq (%)
Place of birth for the foreign-born population - Israel (%)
Place of birth for the foreign-born population - Jordan (%)
Place of birth for the foreign-born population - Kuwait (%)
Place of birth for the foreign-born population - Lebanon (%)
Place of birth for the foreign-born population - Saudi Arabia (%)
Place of birth for the foreign-born population - Syria (%)
Place of birth for the foreign-born population - Turkey (%)
Place of birth for the foreign-born population - Yemen (%)
Place of birth for the foreign-born population - Other Western Asia (%)
Place of birth for the foreign-born population - Eritrea (%)
Place of birth for the foreign-born population - Ethiopia (%)
Place of birth for the foreign-born population - Kenya (%)
Place of birth for the foreign-born population - Somalia (%)
Place of birth for the foreign-born population - Uganda (%)
Place of birth for the foreign-born population - Zimbabwe (%)
Place of birth for the foreign-born population - Other Eastern Africa (%)
Place of birth for the foreign-born population - Cameroon (%)
Place of birth for the foreign-born population - Congo (%)
Place of birth for the foreign-born population - Democratic Republic of Congo (Zaire) (%)
Place of birth for the foreign-born population - Other Middle Africa (%)
Place of birth for the foreign-born population - Egypt (%)
Place of birth for the foreign-born population - Morocco (%)
Place of birth for the foreign-born population - Sudan (%)
Place of birth for the foreign-born population - Other Northern Africa (%)
Place of birth for the foreign-born population - South Africa (%)
Place of birth for the foreign-born population - Other Southern Africa (%)
Place of birth for the foreign-born population - Cabo Verde (%)
Place of birth for the foreign-born population - Ghana (%)
Place of birth for the foreign-born population - Liberia (%)
Place of birth for the foreign-born population - Nigeria (%)
Place of birth for the foreign-born population - Senegal (%)
Place of birth for the foreign-born population - Sierra Leone (%)
Place of birth for the foreign-born population - Other Western Africa (%)
Place of birth for the foreign-born population - Australia (%)
Place of birth for the foreign-born population - New Zealand (%)
Place of birth for the foreign-born population - Fiji (%)
Place of birth for the foreign-born population - Micronesia (%)
Place of birth for the foreign-born population - Bahamas (%)
Place of birth for the foreign-born population - Barbados (%)
Place of birth for the foreign-born population - Cuba (%)
Place of birth for the foreign-born population - Dominica (%)
Place of birth for the foreign-born population - Dominican Republic (%)
Place of birth for the foreign-born population - Grenada (%)
Place of birth for the foreign-born population - Haiti (%)
Place of birth for the foreign-born population - Jamaica (%)
Place of birth for the foreign-born population - St. Vincent and the Grenadines (%)
Place of birth for the foreign-born population - Trinidad and Tobago (%)
Place of birth for the foreign-born population - West Indies (%)
Place of birth for the foreign-born population - Other Caribbean (%)
Place of birth for the foreign-born population - Belize (%)
Place of birth for the foreign-born population - Costa Rica (%)
Place of birth for the foreign-born population - El Salvador (%)
Place of birth for the foreign-born population - Guatemala (%)
Place of birth for the foreign-born population - Honduras (%)
Place of birth for the foreign-born population - Mexico (%)
Place of birth for the foreign-born population - Nicaragua (%)
Place of birth for the foreign-born population - Panama (%)
Place of birth for the foreign-born population - Other Central America (%)
Place of birth for the foreign-born population - Argentina (%)
Place of birth for the foreign-born population - Bolivia (%)
Place of birth for the foreign-born population - Brazil (%)
Place of birth for the foreign-born population - Chile (%)
Place of birth for the foreign-born population - Colombia (%)
Place of birth for the foreign-born population - Ecuador (%)
Place of birth for the foreign-born population - Guyana (%)
Place of birth for the foreign-born population - Peru (%)
Place of birth for the foreign-born population - Uruguay (%)
Place of birth for the foreign-born population - Venezuela (%)
Place of birth for the foreign-born population - Other South America (%)
Place of birth for the foreign-born population - Canada (%)
Place of birth for the foreign-born population - Other Northern America (%)
Place of birth for the foreign-born population - Other (%)
Latest news about races in Ballwin, MO collected exclusively by city-data.com from local newspapers, TV, and radio stations
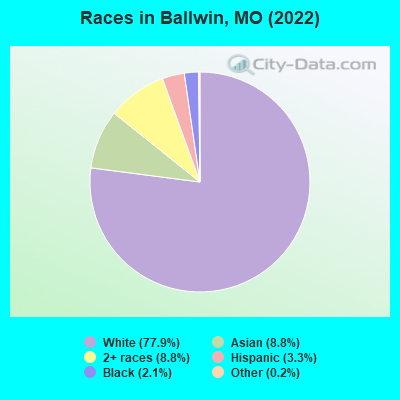
According to 2022 data, the most numerous races in Ballwin, MO are White alone (23,873 residents), Black alone (629 residents), and Two or more races (2,699 residents). 88.4% of Ballwin residents speak English at home. 8.3% of Ballwin, MO residents are foreign-born (6.4% born in Asia, 0.9% born in Europe), which is 51.9% greater than the foreign-born rate of 4.0% across the entire state of Missouri.
Race distribution in Ballwin
2000 2022
4,686,474 83.8% White alone 625,667 11.2% Black alone 118,592 2.1% Hispanic 71,905 1.3% Two or more races 61,041 1.1% Asian alone 23,302 0.4% American Indian alone 5,291 0.09% Other race alone 2,939 0.05% Native Hawaiian and Other
4,733,411 76.6% White alone 656,739 10.6% Black alone 316,300 5.1% Two or more races 291,763 4.7% Hispanic 132,436 2.1% Asian alone 27,467 0.4% Other race alone 12,313 0.2% American Indian alone 7,528 0.1% Native Hawaiian and Other
Income and house value in Ballwin Median household income in 2022 $124,504 White non-Hispanic householders$122,933 Asian householders$103,174 Some other race householders$70,641 Two or more races householders$59,403 Hispanic or Latino race householdersMedian 2022 house value $360,877 White Non-Hispanic householders$373,044 Black or African American householders$251,144 American Indian or Alaska Native householders $378,094 Asian householders$373,044 Some other race householders$308,765 Two or more races householders$381,767 Hispanic or Latino householders
Median age by race in Ballwin
44.8 Median age for White residents44.1 46.0 28.8 Median age for Black or African American residents29.0 18.9 22.2 Median age for American Indian / Alaska Native residents-644,003,776.5 -505,494,505.0 40.4 Median age for Asian residents40.3 40.9 -710,303,029.6 Median age for Native Hawaiian / Pacific Islander residents-1,449,781,657.9 -752,136,751.4 20.5 Median age for Other race residents25.5 20.0 27.4 Median age for Two or more races residents16.9 31.5 45.0 Median age for White alone residents43.9 46.4 35.4 Median age for Hispanic or Latino residents26.9 37.0
Owner/renter occupied households by race in Ballwin
House owners and renters - White residents 8,183 83.8% Owner occupied1,577 16.2% Renter occupiedHouse owners and renters - Black or African American residents 64 43.9% Owner occupied82 56.1% Renter occupiedHouse owners and renters - American Indian / Alaska Native residents 3 100.0% Renter occupiedHouse owners and renters - Asian residents 813 80.3% Owner occupied199 19.7% Renter occupiedHouse owners and renters - Native Hawaiian / Pacific Islander residents 5 100.0% Owner occupiedHouse owners and renters - Other race residents 34 56.3% Owner occupied27 43.7% Renter occupiedHouse owners and renters - Two or more races residents 1,084 100.0% Owner occupiedHouse owners and renters - White alone residents 8,076 83.8% Owner occupied1,561 16.2% Renter occupiedHouse owners and renters - Hispanic or Latino residents 256 80.2% Owner occupied63 19.8% Renter occupied
Language usage in Ballwin
English speakers - Total 88.4% of residents of Ballwin speak English at home.
2.0% of residents speak Spanish at home 426 75.7% Speak English very well137 24.3% Speak English less than very well9.6% of residents speak other language at home 1,929 69.7% Speak English very well839 30.3% Speak English less than very well
English speakers - Born in the United States 96.3% of residents of Ballwin speak English at home.
1.6% of residents speak Spanish at home 110 83.3% Speak English very well22 16.7% Speak English less than very well2.1% of residents speak other language at home 150 85.7% Speak English very well25 14.3% Speak English less than very well
English speakers - Native, born elsewhere 36.3% of residents of Ballwin speak English at home.
7.8% of residents speak Spanish at home 8 100.0% Speak English very well76.5% of residents speak other language at home 51 65.4% Speak English very well27 34.6% Speak English less than very well
English speakers - Foreign-born 12.8% of residents of Ballwin speak English at home.
7.7% of residents speak Spanish at home 105 54.1% Speak English very well89 45.9% Speak English less than very well77.9% of residents speak other language at home 1,268 64.5% Speak English very well699 35.5% Speak English less than very well
White (Caucasian) - Speak only English Native:
97.6% (21,942)Foreign-born:
15.0% (85)
White (Caucasian) - Speak another language Native:
2.4% (542)Foreign-born:
86.5% (489)
Black or African American - Speak only English Native:
99.0% (557)Foreign-born:
100.0% (14)
American Indian / Alaska Native - Speak only English Native:
91.2% (5)Foreign-born:
100.0% (2)
Asian - Speak only English Native:
44.1% (295)Foreign-born:
12.2% (223)
Asian - Speak another language Native:
52.8% (353)Foreign-born:
86.6% (1,581)
Other race - Speak only English Native:
64.6% (108)Foreign-born:
55.7% (21)
Other race - Speak another language Native:
32.5% (55)Foreign-born:
66.8% (26)
White alone - Speak only English Native:
98.3% (21,921)Foreign-born:
14.7% (60)
White alone - Speak another language Native:
1.7% (373)Foreign-born:
87.2% (358)
Hispanic or Latino - Speak only English Native:
58.4% (398)Foreign-born:
16.6% (41)
Hispanic or Latino - Speak another language Native:
39.3% (268)Foreign-born:
81.6% (202)
Foreign-born residents in Ballwin 2,552 residents are foreign born (6.4% Asia , 0.9% Europe ).
This city:
8.3%Missouri:
4.2%
Marital status for residents in Ballwin Marital status - White (Caucasian) population 15 years and over
Males 25.1% Never married64.8% Now married0.8% Separated3.4% Widowed5.9% DivorcedFemales 22.6% Never married58.6% Now married1.5% Separated8.6% Widowed8.7% DivorcedWomen who gave birth in the past 12 months Now married:
78.2% (193)Unmarried:
21.8% (54)
Women who did not give birth in the past 12 months Now married:
50.0% (2,438)Unmarried:
50.0% (2,438)
Marital status - Black or African American population 15 years and over
Males 56.7% Never married20.2% Now married0.0% Separated18.6% Widowed4.6% DivorcedFemales 38.0% Never married22.1% Now married0.0% Separated4.8% Widowed35.1% DivorcedWomen who did not give birth in the past 12 months Now married:
0.0% (0)Unmarried:
100.0% (122)
Marital status - Asian population 15 years and over
Males 27.1% Never married72.5% Now married0.0% Separated0.0% Widowed0.4% DivorcedFemales 11.2% Never married79.3% Now married1.5% Separated4.1% Widowed3.9% DivorcedWomen who gave birth in the past 12 months Now married:
100.0% (65)Unmarried:
0.0% (0)
Women who did not give birth in the past 12 months Now married:
79.6% (447)Unmarried:
20.4% (114)
Marital status - Other race population 15 years and over
Males 45.9% Never married54.1% Now married0.0% Separated0.0% Widowed0.0% DivorcedFemales 40.8% Never married59.2% Now married0.0% Separated0.0% Widowed0.0% DivorcedWomen who did not give birth in the past 12 months Now married:
59.2% (48)Unmarried:
40.8% (33)
Marital status - Two or more races population 15 years and over
Males 26.0% Never married72.3% Now married0.0% Separated0.0% Widowed1.6% DivorcedFemales 21.6% Never married43.3% Now married0.0% Separated17.2% Widowed17.9% DivorcedWomen who gave birth in the past 12 months Now married:
81.9% (89)Unmarried:
18.1% (20)
Women who did not give birth in the past 12 months Now married:
43.0% (185)Unmarried:
57.0% (246)
Marital status - White alone, not Hispanic / Latino population 15 years and over
Males 25.0% Never married64.9% Now married0.7% Separated3.4% Widowed6.0% DivorcedFemales 21.9% Never married58.9% Now married1.5% Separated8.8% Widowed8.8% DivorcedWomen who gave birth in the past 12 months Now married:
78.2% (195)Unmarried:
21.8% (54)
Women who did not give birth in the past 12 months Now married:
50.5% (2,382)Unmarried:
49.5% (2,336)
Marital status - Hispanic or Latino population 15 years and over
Males 38.5% Never married54.2% Now married4.5% Separated0.0% Widowed2.9% DivorcedFemales 42.9% Never married32.7% Now married0.0% Separated0.0% Widowed24.5% DivorcedWomen who did not give birth in the past 12 months Now married:
38.2% (126)Unmarried:
61.8% (203)
Ancestries in Ballwin
3,373 25.3% German1,282 9.6% English1,209 9.1% American1,006 7.5% Irish867 6.5% European331 2.5% Italian230 1.7% Polish174 1.3% Scottish170 1.3% Bulgarian127 1.0% Greek96 0.7% Dutch84 0.6% Czech79 0.6% Russian75 0.6% Scotch-Irish67 0.5% French60 0.4% Armenian59 0.4% Norwegian52 0.4% British48 0.4% Syrian48 0.4% Swedish45 0.3% French Canadian44 0.3% Czechoslovakian42 0.3% Ukrainian38 0.3% Northern European27 0.2% Jamaican17 0.1% Yugoslavian16 0.1% Croatian16 0.1% Swiss15 0.1% Eastern European14 0.1% Arab14 0.1% Scandinavian11 0.08% Slovene8 0.06% Latvian7 0.05% Serbian
Geographical mobility in Ballwin Same house 1 year ago 21,911 91.1% White (Caucasian)603 96.0% Black or African American8 62.4% American Indian / Alaska Native2,314 87.9% Asian6 100.0% Native Hawaiian / Pacific Islander154 74.6% Other race2,620 83.4% Two or more races21,611 91.1% White alone, not Hispanic / Latino959 94.5% Hispanic or LatinoMoved within same county 1,364 5.7% White / Caucasian5 39.6% American Indian / Alaska Native66 2.5% Asian61 29.7% Other race318 10.1% Two or more races1,338 5.6% White alone, not Hispanic / Latino13 1.3% Hispanic or LatinoMoved within same state 415 1.7% White / Caucasian9 1.4% Black or African American55 2.1% Asian17 0.5% Two or more races411 1.7% White alone, not Hispanic / LatinoMoved from different state 343 1.4% White / Caucasian14 2.2% Black or African American47 1.8% Asian30 1.0% Two or more races344 1.4% White alone, not Hispanic / LatinoMoved from abroad 121 4.6% Asian33 1.1% Two or more races
Children Nativity (place of birth) in Ballwin
Children under 6 years - Living with two parents Both parents native 1,774 99.0% Native19 1.0% Foreign-bornBoth parents foreign-born 244 85.8% Native40 14.2% Foreign-bornOne native, one foreign-born parent 117 100.0% NativeChildren under 6 years - Living with one parent Native parent 221 100.0% NativeChildren 6 to 17 years - Living with two parents Both parents native 2,851 99.4% Native16 0.6% Foreign-bornBoth parents foreign-born 345 82.2% Native75 17.8% Foreign-bornOne native, one foreign-born parent 182 100.0% NativeChildren 6 to 17 years - Living with one parent Native parent 828 100.0% NativeForeign-born parent 71 48.6% Native75 51.4% Foreign-born
Grandparents responsible for own grandchildren in Ballwin
Grandparents (30 to 59 years) Black or African American 28 100.0% Responsible for grandchildrenTwo or more races 23 100.0% Not responsible for grandchildren
Grandparents (60 years and over) Black or African American 31 100.0% Responsible for grandchildren