Races in Ballenger Creek, Maryland (MD) Detailed Stats
Data:
Races - White alone (%)
Races - White alone (% change since 2000)
Races - Black alone (%)
Races - Black alone (% change since 2000)
Races - American Indian alone (%)
Races - American Indian alone (% change since 2000)
Races - Asian alone (%)
Races - Asian alone (% change since 2000)
Races - Hispanic (%)
Races - Hispanic (% change since 2000)
Races - Native Hawaiian and Other Pacific Islander alone (%)
Races - Native Hawaiian and Other Pacific Islander alone (% change since 2000)
Races - Two or more races(%)
Races - Two or more races(% change since 2000)
Races - Other race alone (%)
Races - Other race alone (% change since 2000)
Racial diversity
Place of birth - Born in state of residence (%)
Place of birth - Born in state of residence (%) - White
Place of birth - Born in state of residence (%) - Black or African American
Place of birth - Born in state of residence (%) - Asian
Place of birth - Born in state of residence (%) - Hispanic or Latino
Place of birth - Born in state of residence (%) - American Indian and Alaska Native
Place of birth - Born in state of residence (%) - Multirace
Place of birth - Born in state of residence (%) - Other Race
Place of birth - Born in other state (%)
Place of birth - Born in other state (%) - White
Place of birth - Born in other state (%) - Black or African American
Place of birth - Born in other state (%) - Asian
Place of birth - Born in other state (%) - Hispanic or Latino
Place of birth - Born in other state (%) - American Indian and Alaska Native
Place of birth - Born in other state (%) - Multirace
Place of birth - Born in other state (%) - Other Race
Place of birth - Native, outside of US (%)
Place of birth - Native, outside of US (%) - White
Place of birth - Native, outside of US (%) - Black or African American
Place of birth - Native, outside of US (%) - Asian
Place of birth - Native, outside of US (%) - Hispanic or Latino
Place of birth - Native, outside of US (%) - American Indian and Alaska Native
Place of birth - Native, outside of US (%) - Multirace
Place of birth - Native, outside of US (%) - Other Race
Place of birth - Foreign born (%)
Place of birth - Foreign born (%) - White
Place of birth - Foreign born (%) - Black or African American
Place of birth - Foreign born (%) - Asian
Place of birth - Foreign born (%) - Hispanic or Latino
Place of birth - Foreign born (%) - American Indian and Alaska Native
Place of birth - Foreign born (%) - Multirace
Place of birth - Foreign born (%) - Other Race
Residents speaking English at home (%)
Residents speaking English at home - Born in the United States (%)
Residents speaking English at home - Native, born elsewhere (%)
Residents speaking English at home - Foreign born (%)
Residents speaking Spanish at home (%)
Residents speaking Spanish at home - Born in the United States (%)
Residents speaking Spanish at home - Native, born elsewhere (%)
Residents speaking Spanish at home - Foreign born (%)
Residents speaking other language at home (%)
Residents speaking other language at home - Born in the United States (%)
Residents speaking other language at home - Native, born elsewhere (%)
Residents speaking other language at home - Foreign born (%)
Marital status - Never married (%)
Marital status - Now married (%)
Marital status - Separated (%)
Marital status - Widowed (%)
Marital status - Divorced (%)
Ancestries Reported - Arab (%)
Ancestries Reported - Czech (%)
Ancestries Reported - Danish (%)
Ancestries Reported - Dutch (%)
Ancestries Reported - English (%)
Ancestries Reported - French (%)
Ancestries Reported - French Canadian (%)
Ancestries Reported - German (%)
Ancestries Reported - Greek (%)
Ancestries Reported - Hungarian (%)
Ancestries Reported - Irish (%)
Ancestries Reported - Italian (%)
Ancestries Reported - Lithuanian (%)
Ancestries Reported - Norwegian (%)
Ancestries Reported - Polish (%)
Ancestries Reported - Portuguese (%)
Ancestries Reported - Russian (%)
Ancestries Reported - Scotch-Irish (%)
Ancestries Reported - Scottish (%)
Ancestries Reported - Slovak (%)
Ancestries Reported - Subsaharan African (%)
Ancestries Reported - Swedish (%)
Ancestries Reported - Swiss (%)
Ancestries Reported - Ukrainian (%)
Ancestries Reported - United States (%)
Ancestries Reported - Welsh (%)
Ancestries Reported - West Indian (%)
Ancestries Reported - Other (%)
Geographical mobility - Same house 1 year ago (%)
Geographical mobility - Same house 1 year ago (%) - White
Geographical mobility - Same house 1 year ago (%) - Black or African American
Geographical mobility - Same house 1 year ago (%) - Asian
Geographical mobility - Same house 1 year ago (%) - Hispanic or Latino
Geographical mobility - Same house 1 year ago (%) - American Indian and Alaska Native
Geographical mobility - Same house 1 year ago (%) - Multirace
Geographical mobility - Same house 1 year ago (%) - Other Race
Geographical mobility - Moved within same county (%)
Geographical mobility - Moved within same county (%) - White
Geographical mobility - Moved within same county (%) - Black or African American
Geographical mobility - Moved within same county (%) - Asian
Geographical mobility - Moved within same county (%) - Hispanic or Latino
Geographical mobility - Moved within same county (%) - American Indian and Alaska Native
Geographical mobility - Moved within same county (%) - Multirace
Geographical mobility - Moved within same county (%) - Other Race
Geographical mobility - Moved from different county within same state (%)
Geographical mobility - Moved from different county within same state (%) - White
Geographical mobility - Moved from different county within same state (%) - Black or African American
Geographical mobility - Moved from different county within same state (%) - Asian
Geographical mobility - Moved from different county within same state (%) - Hispanic or Latino
Geographical mobility - Moved from different county within same state (%) - American Indian and Alaska Native
Geographical mobility - Moved from different county within same state (%) - Multirace
Geographical mobility - Moved from different county within same state (%) - Other Race
Geographical mobility - Moved from different state (%)
Geographical mobility - Moved from different state (%) - White
Geographical mobility - Moved from different state (%) - Black or African American
Geographical mobility - Moved from different state (%) - Asian
Geographical mobility - Moved from different state (%) - Hispanic or Latino
Geographical mobility - Moved from different state (%) - American Indian and Alaska Native
Geographical mobility - Moved from different state (%) - Multirace
Geographical mobility - Moved from different state (%) - Other Race
Geographical mobility - Moved from abroad (%)
Geographical mobility - Moved from abroad (%) - White
Geographical mobility - Moved from abroad (%) - Black or African American
Geographical mobility - Moved from abroad (%) - Asian
Geographical mobility - Moved from abroad (%) - Hispanic or Latino
Geographical mobility - Moved from abroad (%) - American Indian and Alaska Native
Geographical mobility - Moved from abroad (%) - Multirace
Geographical mobility - Moved from abroad (%) - Other Race
Place of birth for the foreign-born population - Ireland (%)
Place of birth for the foreign-born population - Denmark (%)
Place of birth for the foreign-born population - Norway (%)
Place of birth for the foreign-born population - Sweden (%)
Place of birth for the foreign-born population - United Kingdom (%)
Place of birth for the foreign-born population - England (%)
Place of birth for the foreign-born population - Scotland (%)
Place of birth for the foreign-born population - Other Northern Europe (%)
Place of birth for the foreign-born population - Austria (%)
Place of birth for the foreign-born population - Belgium (%)
Place of birth for the foreign-born population - France (%)
Place of birth for the foreign-born population - Germany (%)
Place of birth for the foreign-born population - Netherlands (%)
Place of birth for the foreign-born population - Switzerland (%)
Place of birth for the foreign-born population - Other Western Europe (%)
Place of birth for the foreign-born population - Greece (%)
Place of birth for the foreign-born population - Italy (%)
Place of birth for the foreign-born population - Portugal (%)
Place of birth for the foreign-born population - Spain (%)
Place of birth for the foreign-born population - Other Southern Europe (%)
Place of birth for the foreign-born population - Albania (%)
Place of birth for the foreign-born population - Belarus (%)
Place of birth for the foreign-born population - Bosnia and Herzegovina (%)
Place of birth for the foreign-born population - Bulgaria (%)
Place of birth for the foreign-born population - Croatia (%)
Place of birth for the foreign-born population - Czechoslovakia (%)
Place of birth for the foreign-born population - Hungary (%)
Place of birth for the foreign-born population - Latvia (%)
Place of birth for the foreign-born population - Lithuania (%)
Place of birth for the foreign-born population - North Macedonia (Macedonia) (%)
Place of birth for the foreign-born population - Moldova (%)
Place of birth for the foreign-born population - Poland (%)
Place of birth for the foreign-born population - Romania (%)
Place of birth for the foreign-born population - Russia (%)
Place of birth for the foreign-born population - Serbia (%)
Place of birth for the foreign-born population - Ukraine (%)
Place of birth for the foreign-born population - Other Eastern Europe (%)
Place of birth for the foreign-born population - China (%)
Place of birth for the foreign-born population - Hong Kong (%)
Place of birth for the foreign-born population - Taiwan (%)
Place of birth for the foreign-born population - Japan (%)
Place of birth for the foreign-born population - Korea (%)
Place of birth for the foreign-born population - Other Eastern Asia (%)
Place of birth for the foreign-born population - Afghanistan (%)
Place of birth for the foreign-born population - Bangladesh (%)
Place of birth for the foreign-born population - India (%)
Place of birth for the foreign-born population - Iran (%)
Place of birth for the foreign-born population - Kazakhstan (%)
Place of birth for the foreign-born population - Nepal (%)
Place of birth for the foreign-born population - Pakistan (%)
Place of birth for the foreign-born population - Sri Lanka (%)
Place of birth for the foreign-born population - Uzbekistan (%)
Place of birth for the foreign-born population - Other South Central Asia (%)
Place of birth for the foreign-born population - Burma (%)
Place of birth for the foreign-born population - Cambodia (%)
Place of birth for the foreign-born population - Indonesia (%)
Place of birth for the foreign-born population - Laos (%)
Place of birth for the foreign-born population - Malaysia (%)
Place of birth for the foreign-born population - Philippines (%)
Place of birth for the foreign-born population - Singapore (%)
Place of birth for the foreign-born population - Thailand (%)
Place of birth for the foreign-born population - Vietnam (%)
Place of birth for the foreign-born population - Other South Eastern Asia (%)
Place of birth for the foreign-born population - Armenia (%)
Place of birth for the foreign-born population - Iraq (%)
Place of birth for the foreign-born population - Israel (%)
Place of birth for the foreign-born population - Jordan (%)
Place of birth for the foreign-born population - Kuwait (%)
Place of birth for the foreign-born population - Lebanon (%)
Place of birth for the foreign-born population - Saudi Arabia (%)
Place of birth for the foreign-born population - Syria (%)
Place of birth for the foreign-born population - Turkey (%)
Place of birth for the foreign-born population - Yemen (%)
Place of birth for the foreign-born population - Other Western Asia (%)
Place of birth for the foreign-born population - Eritrea (%)
Place of birth for the foreign-born population - Ethiopia (%)
Place of birth for the foreign-born population - Kenya (%)
Place of birth for the foreign-born population - Somalia (%)
Place of birth for the foreign-born population - Uganda (%)
Place of birth for the foreign-born population - Zimbabwe (%)
Place of birth for the foreign-born population - Other Eastern Africa (%)
Place of birth for the foreign-born population - Cameroon (%)
Place of birth for the foreign-born population - Congo (%)
Place of birth for the foreign-born population - Democratic Republic of Congo (Zaire) (%)
Place of birth for the foreign-born population - Other Middle Africa (%)
Place of birth for the foreign-born population - Egypt (%)
Place of birth for the foreign-born population - Morocco (%)
Place of birth for the foreign-born population - Sudan (%)
Place of birth for the foreign-born population - Other Northern Africa (%)
Place of birth for the foreign-born population - South Africa (%)
Place of birth for the foreign-born population - Other Southern Africa (%)
Place of birth for the foreign-born population - Cabo Verde (%)
Place of birth for the foreign-born population - Ghana (%)
Place of birth for the foreign-born population - Liberia (%)
Place of birth for the foreign-born population - Nigeria (%)
Place of birth for the foreign-born population - Senegal (%)
Place of birth for the foreign-born population - Sierra Leone (%)
Place of birth for the foreign-born population - Other Western Africa (%)
Place of birth for the foreign-born population - Australia (%)
Place of birth for the foreign-born population - New Zealand (%)
Place of birth for the foreign-born population - Fiji (%)
Place of birth for the foreign-born population - Micronesia (%)
Place of birth for the foreign-born population - Bahamas (%)
Place of birth for the foreign-born population - Barbados (%)
Place of birth for the foreign-born population - Cuba (%)
Place of birth for the foreign-born population - Dominica (%)
Place of birth for the foreign-born population - Dominican Republic (%)
Place of birth for the foreign-born population - Grenada (%)
Place of birth for the foreign-born population - Haiti (%)
Place of birth for the foreign-born population - Jamaica (%)
Place of birth for the foreign-born population - St. Vincent and the Grenadines (%)
Place of birth for the foreign-born population - Trinidad and Tobago (%)
Place of birth for the foreign-born population - West Indies (%)
Place of birth for the foreign-born population - Other Caribbean (%)
Place of birth for the foreign-born population - Belize (%)
Place of birth for the foreign-born population - Costa Rica (%)
Place of birth for the foreign-born population - El Salvador (%)
Place of birth for the foreign-born population - Guatemala (%)
Place of birth for the foreign-born population - Honduras (%)
Place of birth for the foreign-born population - Mexico (%)
Place of birth for the foreign-born population - Nicaragua (%)
Place of birth for the foreign-born population - Panama (%)
Place of birth for the foreign-born population - Other Central America (%)
Place of birth for the foreign-born population - Argentina (%)
Place of birth for the foreign-born population - Bolivia (%)
Place of birth for the foreign-born population - Brazil (%)
Place of birth for the foreign-born population - Chile (%)
Place of birth for the foreign-born population - Colombia (%)
Place of birth for the foreign-born population - Ecuador (%)
Place of birth for the foreign-born population - Guyana (%)
Place of birth for the foreign-born population - Peru (%)
Place of birth for the foreign-born population - Uruguay (%)
Place of birth for the foreign-born population - Venezuela (%)
Place of birth for the foreign-born population - Other South America (%)
Place of birth for the foreign-born population - Canada (%)
Place of birth for the foreign-born population - Other Northern America (%)
Place of birth for the foreign-born population - Other (%)
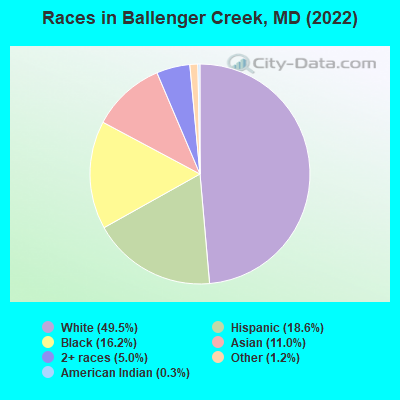
According to 2022 data, the most numerous races in Ballenger Creek, MD are White alone (12,612 residents), Black alone (4,121 residents), and Hispanic (4,735 residents). 72.4% of Ballenger Creek residents speak English at home. 19.5% of Ballenger Creek, MD residents are foreign-born (8.1% born in Latin America, 6.8% born in Asia, 2.9% born in Africa), which is 18.1% greater than the foreign-born rate of 16.0% across the entire state of Maryland.
Race distribution in Ballenger Creek
2000 2022
3,286,547 62.1% White alone 1,464,735 27.7% Black alone 227,916 4.3% Hispanic 209,738 4.0% Asian alone 82,946 1.6% Two or more races 13,312 0.3% American Indian alone 9,379 0.2% Other race alone 1,913 0.04% Native Hawaiian and Other
2,906,492 47.1% White alone 1,800,914 29.2% Black alone 705,842 11.4% Hispanic 401,818 6.5% Asian alone 291,317 4.7% Two or more races 46,930 0.8% Other race alone 8,930 0.1% American Indian alone 2,417 0.04% Native Hawaiian and Other
Income and house value in Ballenger Creek Median household income in 2022 $110,919 White non-Hispanic householders$140,160 Black householders$37,242 American Indian and Alaska Native householders$130,514 Asian householders$100,705 Some other race householders$118,430 Two or more races householders$116,680 Hispanic or Latino race householdersMedian 2022 house value $386,300 White Non-Hispanic householders$377,302 Black or African American householders $582,207 Asian householders$399,070 Some other race householders$523,580 Two or more races householders$431,286 Hispanic or Latino householders
Median age by race in Ballenger Creek
40.2 Median age for White residents37.7 42.8 30.3 Median age for Black or African American residents29.5 32.5 35.2 Median age for American Indian / Alaska Native residents30.0 32.6 36.5 Median age for Asian residents35.1 35.5 76.8 Median age for Native Hawaiian / Pacific Islander residents-720,061,021.4 76.8 28.1 Median age for Other race residents29.6 29.3 26.2 Median age for Two or more races residents28.3 23.0 41.5 Median age for White alone residents37.8 45.2 30.0 Median age for Hispanic or Latino residents33.6 26.9
Owner/renter occupied households by race in Ballenger Creek
House owners and renters - White residents 4,060 67.5% Owner occupied1,957 32.5% Renter occupiedHouse owners and renters - Black or African American residents 1,076 68.6% Owner occupied492 31.4% Renter occupiedHouse owners and renters - American Indian / Alaska Native residents 12 12.5% Owner occupied86 87.5% Renter occupiedHouse owners and renters - Asian residents 654 63.3% Owner occupied379 36.7% Renter occupiedHouse owners and renters - Native Hawaiian / Pacific Islander residents 3 21.0% Owner occupied12 79.0% Renter occupiedHouse owners and renters - Other race residents 224 48.2% Owner occupied240 51.8% Renter occupiedHouse owners and renters - Two or more races residents 521 60.8% Owner occupied336 39.2% Renter occupiedHouse owners and renters - White alone residents 3,983 68.1% Owner occupied1,870 31.9% Renter occupiedHouse owners and renters - Hispanic or Latino residents 564 46.1% Owner occupied660 53.9% Renter occupied
Language usage in Ballenger Creek
English speakers - Total 72.4% of residents of Ballenger Creek speak English at home.
12.0% of residents speak Spanish at home 1,784 63.4% Speak English very well1,032 36.6% Speak English less than very well17.9% of residents speak other language at home 2,738 65.3% Speak English very well1,454 34.7% Speak English less than very well
English speakers - Born in the United States 86.8% of residents of Ballenger Creek speak English at home.
5.2% of residents speak Spanish at home 335 77.9% Speak English very well95 22.1% Speak English less than very well7.6% of residents speak other language at home 592 95.3% Speak English very well29 4.7% Speak English less than very well
English speakers - Native, born elsewhere 72.9% of residents of Ballenger Creek speak English at home.
26.5% of residents speak Spanish at home 82 88.2% Speak English very well11 11.8% Speak English less than very well5.1% of residents speak other language at home 18 100.0% Speak English very well
English speakers - Foreign-born 16.2% of residents of Ballenger Creek speak English at home.
27.1% of residents speak Spanish at home 866 56.5% Speak English very well667 43.5% Speak English less than very well59.2% of residents speak other language at home 1,909 57.0% Speak English very well1,439 43.0% Speak English less than very well
White (Caucasian) - Speak only English Native:
95.8% (11,307)Foreign-born:
16.5% (105)
White (Caucasian) - Speak another language Native:
3.8% (448)Foreign-born:
68.4% (437)
Black or African American - Speak only English Native:
87.0% (2,537)Foreign-born:
17.8% (200)
Black or African American - Speak another language Native:
9.9% (288)Foreign-born:
83.2% (938)
Asian - Speak only English Native:
41.0% (297)Foreign-born:
15.3% (288)
Asian - Speak another language Native:
51.4% (372)Foreign-born:
84.8% (1,594)
Native Hawaiian / Pacific Islander - Speak only English Native:
17.1% (2)Foreign-born:
84.6% (5)
Other race - Speak only English Native:
43.4% (375)Foreign-born:
2.0% (11)
Other race - Speak another language Native:
52.1% (449)Foreign-born:
100.0% (555)
Two or more races - Speak only English Native:
70.6% (1,277)Foreign-born:
20.5% (313)
Two or more races - Speak another language Native:
29.5% (534)Foreign-born:
68.8% (1,049)
White alone - Speak only English Native:
97.8% (11,122)Foreign-born:
14.2% (89)
White alone - Speak another language Native:
2.1% (243)Foreign-born:
82.7% (516)
Hispanic or Latino - Speak only English Native:
45.6% (965)Foreign-born:
16.2% (307)
Hispanic or Latino - Speak another language Native:
54.6% (1,155)Foreign-born:
82.6% (1,564)
Foreign-born residents in Ballenger Creek 4,981 residents are foreign born (8.1% Latin America , 6.8% Asia , 2.9% Africa ).
This city:
19.5%Maryland:
15.7%
Marital status for residents in Ballenger Creek Marital status - White (Caucasian) population 15 years and over
Males 34.2% Never married53.0% Now married2.2% Separated1.7% Widowed8.9% DivorcedFemales 29.7% Never married44.2% Now married1.4% Separated8.8% Widowed15.9% DivorcedWomen who gave birth in the past 12 months Now married:
67.6% (134)Unmarried:
32.4% (64)
Women who did not give birth in the past 12 months Now married:
39.9% (1,197)Unmarried:
60.1% (1,806)
Marital status - Black or African American population 15 years and over
Males 58.7% Never married36.5% Now married0.0% Separated0.0% Widowed4.8% DivorcedFemales 31.8% Never married33.7% Now married5.6% Separated3.1% Widowed25.8% DivorcedWomen who gave birth in the past 12 months Now married:
100.0% (48)Unmarried:
0.0% (0)
Women who did not give birth in the past 12 months Now married:
34.9% (403)Unmarried:
65.1% (751)
Marital status - American Indian / Alaska Native population 15 years and over
Males 9.0% Never married91.0% Now married0.0% Separated0.0% Widowed0.0% DivorcedFemales 21.1% Never married47.9% Now married0.0% Separated0.0% Widowed31.0% DivorcedWomen who did not give birth in the past 12 months Now married:
69.4% (51)Unmarried:
30.6% (22)
Marital status - Asian population 15 years and over
Males 39.6% Never married58.0% Now married1.8% Separated0.6% Widowed0.0% DivorcedFemales 42.5% Never married49.8% Now married0.0% Separated5.1% Widowed2.7% DivorcedWomen who gave birth in the past 12 months Now married:
100.0% (32)Unmarried:
0.0% (0)
Women who did not give birth in the past 12 months Now married:
45.4% (391)Unmarried:
54.6% (470)
Marital status - Native Hawaiian / Pacific Islander population 15 years and over
Males 0.0% Never married100.0% Now married0.0% Separated0.0% Widowed0.0% DivorcedFemales 0.0% Never married23.1% Now married76.9% Separated0.0% Widowed0.0% DivorcedWomen who did not give birth in the past 12 months Now married:
100.0% (3)Unmarried:
0.0% (0)
Marital status - Other race population 15 years and over
Males 61.7% Never married30.4% Now married0.0% Separated0.0% Widowed7.9% DivorcedFemales 40.3% Never married36.3% Now married0.0% Separated0.0% Widowed23.4% DivorcedWomen who gave birth in the past 12 months Now married:
100.0% (14)Unmarried:
0.0% (0)
Women who did not give birth in the past 12 months Now married:
33.5% (235)Unmarried:
66.5% (466)
Marital status - Two or more races population 15 years and over
Males 29.9% Never married43.1% Now married0.7% Separated0.0% Widowed26.3% DivorcedFemales 34.9% Never married36.9% Now married0.0% Separated1.7% Widowed26.4% DivorcedWomen who gave birth in the past 12 months Now married:
0.0% (0)Unmarried:
100.0% (24)
Women who did not give birth in the past 12 months Now married:
39.7% (321)Unmarried:
60.3% (489)
Marital status - White alone, not Hispanic / Latino population 15 years and over
Males 34.7% Never married51.4% Now married2.3% Separated1.9% Widowed9.6% DivorcedFemales 29.8% Never married42.8% Now married1.5% Separated9.3% Widowed16.6% DivorcedWomen who gave birth in the past 12 months Now married:
58.9% (72)Unmarried:
41.1% (50)
Women who did not give birth in the past 12 months Now married:
39.0% (1,143)Unmarried:
61.0% (1,784)
Marital status - Hispanic or Latino population 15 years and over
Males 37.7% Never married47.6% Now married0.0% Separated0.0% Widowed14.6% DivorcedFemales 27.7% Never married52.7% Now married0.0% Separated1.6% Widowed18.0% DivorcedWomen who gave birth in the past 12 months Now married:
69.3% (92)Unmarried:
30.7% (41)
Women who did not give birth in the past 12 months Now married:
52.0% (579)Unmarried:
48.0% (534)
Ancestries in Ballenger Creek
823 7.3% German681 6.0% Irish598 5.3% English594 5.3% American360 3.2% Italian333 3.0% European276 2.5% African229 2.0% Iranian147 1.3% Scottish128 1.1% Turkish118 1.0% Ethiopian117 1.0% Nigerian89 0.8% Polish84 0.7% Ghanaian84 0.7% Eastern European76 0.7% Russian59 0.5% Ukrainian57 0.5% Scotch-Irish54 0.5% Lebanese52 0.5% Czech38 0.3% Jamaican32 0.3% Haitian30 0.3% Egyptian29 0.3% Greek29 0.3% Liberian28 0.2% Romanian27 0.2% Portuguese27 0.2% Dutch26 0.2% Scandinavian26 0.2% Swiss23 0.2% Senegalese20 0.2% Swedish19 0.2% Northern European15 0.1% Slovak13 0.1% Brazilian9 0.08% Trinidadian and Tobagonian7 0.06% Palestinian7 0.06% Lithuanian7 0.06% Hungarian3 0.03% British
Geographical mobility in Ballenger Creek Same house 1 year ago 11,027 82.4% White (Caucasian)4,013 88.7% Black or African American208 97.5% American Indian / Alaska Native2,247 80.3% Asian9 44.9% Native Hawaiian / Pacific Islander1,084 99.3% Other race2,939 76.9% Two or more races10,439 83.1% White alone, not Hispanic / Latino4,094 87.3% Hispanic or LatinoMoved within same county 1,156 8.6% White / Caucasian144 3.2% Black or African American75 2.7% Asian10 52.6% Native Hawaiian / Pacific Islander7 0.6% Other race176 4.6% Two or more races1,212 9.7% White alone, not Hispanic / Latino108 2.3% Hispanic or LatinoMoved within same state 708 5.3% White / Caucasian467 10.3% Black or African American4 1.9% American Indian / Alaska Native44 1.6% Asian25 2.3% Other race179 4.7% Two or more races389 3.1% White alone, not Hispanic / Latino464 9.9% Hispanic or LatinoMoved from different state 398 3.0% White / Caucasian11 0.2% Black or African American295 10.6% Asian12 0.3% Two or more races377 3.0% White alone, not Hispanic / Latino9 0.2% Hispanic or LatinoMoved from abroad 153 1.1% White170 6.1% Asian513 13.4% Two or more races287 2.3% White alone, not Hispanic / Latino304 6.5% Hispanic or Latino
Children Nativity (place of birth) in Ballenger Creek
Children under 6 years - Living with two parents Both parents native 361 100.0% NativeBoth parents foreign-born 1,055 100.0% NativeOne native, one foreign-born parent 88 100.0% NativeChildren under 6 years - Living with one parent Native parent 491 100.0% NativeForeign-born parent 72 37.2% Native122 62.8% Foreign-bornChildren 6 to 17 years - Living with two parents Both parents native 975 98.3% Native17 1.7% Foreign-bornBoth parents foreign-born 720 94.8% Native39 5.2% Foreign-bornOne native, one foreign-born parent 392 100.0% NativeChildren 6 to 17 years - Living with one parent Native parent 939 100.0% NativeForeign-born parent 293 48.9% Native306 51.1% Foreign-born
Grandparents responsible for own grandchildren in Ballenger Creek
Grandparents (30 to 59 years) White / Caucasian 64 100.0% Not responsible for grandchildrenAsian 3 100.0% Not responsible for grandchildrenOther race 13 100.0% Not responsible for grandchildrenWhite alone, not Hispanic / Latino 22 100.0% Not responsible for grandchildrenHispanic or Latino 68 100.0% Not responsible for grandchildrenGrandparents (60 years and over) White / Caucasian 120 48.1% Responsible for grandchildren129 51.9% Not responsible for grandchildrenAsian 40 100.0% Not responsible for grandchildrenWhite alone, not Hispanic / Latino 120 54.5% Responsible for grandchildren100 45.5% Not responsible for grandchildrenHispanic or Latino 45 100.0% Not responsible for grandchildren