Races in Augusta-Richmond County, Georgia (GA) Detailed Stats
Data:
Races - White alone (%)
Races - White alone (% change since 2000)
Races - Black alone (%)
Races - Black alone (% change since 2000)
Races - American Indian alone (%)
Races - American Indian alone (% change since 2000)
Races - Asian alone (%)
Races - Asian alone (% change since 2000)
Races - Hispanic (%)
Races - Hispanic (% change since 2000)
Races - Native Hawaiian and Other Pacific Islander alone (%)
Races - Native Hawaiian and Other Pacific Islander alone (% change since 2000)
Races - Two or more races(%)
Races - Two or more races(% change since 2000)
Races - Other race alone (%)
Races - Other race alone (% change since 2000)
Racial diversity
Place of birth - Born in state of residence (%)
Place of birth - Born in state of residence (%) - White
Place of birth - Born in state of residence (%) - Black or African American
Place of birth - Born in state of residence (%) - Asian
Place of birth - Born in state of residence (%) - Hispanic or Latino
Place of birth - Born in state of residence (%) - American Indian and Alaska Native
Place of birth - Born in state of residence (%) - Multirace
Place of birth - Born in state of residence (%) - Other Race
Place of birth - Born in other state (%)
Place of birth - Born in other state (%) - White
Place of birth - Born in other state (%) - Black or African American
Place of birth - Born in other state (%) - Asian
Place of birth - Born in other state (%) - Hispanic or Latino
Place of birth - Born in other state (%) - American Indian and Alaska Native
Place of birth - Born in other state (%) - Multirace
Place of birth - Born in other state (%) - Other Race
Place of birth - Native, outside of US (%)
Place of birth - Native, outside of US (%) - White
Place of birth - Native, outside of US (%) - Black or African American
Place of birth - Native, outside of US (%) - Asian
Place of birth - Native, outside of US (%) - Hispanic or Latino
Place of birth - Native, outside of US (%) - American Indian and Alaska Native
Place of birth - Native, outside of US (%) - Multirace
Place of birth - Native, outside of US (%) - Other Race
Place of birth - Foreign born (%)
Place of birth - Foreign born (%) - White
Place of birth - Foreign born (%) - Black or African American
Place of birth - Foreign born (%) - Asian
Place of birth - Foreign born (%) - Hispanic or Latino
Place of birth - Foreign born (%) - American Indian and Alaska Native
Place of birth - Foreign born (%) - Multirace
Place of birth - Foreign born (%) - Other Race
Residents speaking English at home (%)
Residents speaking English at home - Born in the United States (%)
Residents speaking English at home - Native, born elsewhere (%)
Residents speaking English at home - Foreign born (%)
Residents speaking Spanish at home (%)
Residents speaking Spanish at home - Born in the United States (%)
Residents speaking Spanish at home - Native, born elsewhere (%)
Residents speaking Spanish at home - Foreign born (%)
Residents speaking other language at home (%)
Residents speaking other language at home - Born in the United States (%)
Residents speaking other language at home - Native, born elsewhere (%)
Residents speaking other language at home - Foreign born (%)
Marital status - Never married (%)
Marital status - Now married (%)
Marital status - Separated (%)
Marital status - Widowed (%)
Marital status - Divorced (%)
Ancestries Reported - Arab (%)
Ancestries Reported - Czech (%)
Ancestries Reported - Danish (%)
Ancestries Reported - Dutch (%)
Ancestries Reported - English (%)
Ancestries Reported - French (%)
Ancestries Reported - French Canadian (%)
Ancestries Reported - German (%)
Ancestries Reported - Greek (%)
Ancestries Reported - Hungarian (%)
Ancestries Reported - Irish (%)
Ancestries Reported - Italian (%)
Ancestries Reported - Lithuanian (%)
Ancestries Reported - Norwegian (%)
Ancestries Reported - Polish (%)
Ancestries Reported - Portuguese (%)
Ancestries Reported - Russian (%)
Ancestries Reported - Scotch-Irish (%)
Ancestries Reported - Scottish (%)
Ancestries Reported - Slovak (%)
Ancestries Reported - Subsaharan African (%)
Ancestries Reported - Swedish (%)
Ancestries Reported - Swiss (%)
Ancestries Reported - Ukrainian (%)
Ancestries Reported - United States (%)
Ancestries Reported - Welsh (%)
Ancestries Reported - West Indian (%)
Ancestries Reported - Other (%)
Geographical mobility - Same house 1 year ago (%)
Geographical mobility - Same house 1 year ago (%) - White
Geographical mobility - Same house 1 year ago (%) - Black or African American
Geographical mobility - Same house 1 year ago (%) - Asian
Geographical mobility - Same house 1 year ago (%) - Hispanic or Latino
Geographical mobility - Same house 1 year ago (%) - American Indian and Alaska Native
Geographical mobility - Same house 1 year ago (%) - Multirace
Geographical mobility - Same house 1 year ago (%) - Other Race
Geographical mobility - Moved within same county (%)
Geographical mobility - Moved within same county (%) - White
Geographical mobility - Moved within same county (%) - Black or African American
Geographical mobility - Moved within same county (%) - Asian
Geographical mobility - Moved within same county (%) - Hispanic or Latino
Geographical mobility - Moved within same county (%) - American Indian and Alaska Native
Geographical mobility - Moved within same county (%) - Multirace
Geographical mobility - Moved within same county (%) - Other Race
Geographical mobility - Moved from different county within same state (%)
Geographical mobility - Moved from different county within same state (%) - White
Geographical mobility - Moved from different county within same state (%) - Black or African American
Geographical mobility - Moved from different county within same state (%) - Asian
Geographical mobility - Moved from different county within same state (%) - Hispanic or Latino
Geographical mobility - Moved from different county within same state (%) - American Indian and Alaska Native
Geographical mobility - Moved from different county within same state (%) - Multirace
Geographical mobility - Moved from different county within same state (%) - Other Race
Geographical mobility - Moved from different state (%)
Geographical mobility - Moved from different state (%) - White
Geographical mobility - Moved from different state (%) - Black or African American
Geographical mobility - Moved from different state (%) - Asian
Geographical mobility - Moved from different state (%) - Hispanic or Latino
Geographical mobility - Moved from different state (%) - American Indian and Alaska Native
Geographical mobility - Moved from different state (%) - Multirace
Geographical mobility - Moved from different state (%) - Other Race
Geographical mobility - Moved from abroad (%)
Geographical mobility - Moved from abroad (%) - White
Geographical mobility - Moved from abroad (%) - Black or African American
Geographical mobility - Moved from abroad (%) - Asian
Geographical mobility - Moved from abroad (%) - Hispanic or Latino
Geographical mobility - Moved from abroad (%) - American Indian and Alaska Native
Geographical mobility - Moved from abroad (%) - Multirace
Geographical mobility - Moved from abroad (%) - Other Race
Place of birth for the foreign-born population - Ireland (%)
Place of birth for the foreign-born population - Denmark (%)
Place of birth for the foreign-born population - Norway (%)
Place of birth for the foreign-born population - Sweden (%)
Place of birth for the foreign-born population - United Kingdom (%)
Place of birth for the foreign-born population - England (%)
Place of birth for the foreign-born population - Scotland (%)
Place of birth for the foreign-born population - Other Northern Europe (%)
Place of birth for the foreign-born population - Austria (%)
Place of birth for the foreign-born population - Belgium (%)
Place of birth for the foreign-born population - France (%)
Place of birth for the foreign-born population - Germany (%)
Place of birth for the foreign-born population - Netherlands (%)
Place of birth for the foreign-born population - Switzerland (%)
Place of birth for the foreign-born population - Other Western Europe (%)
Place of birth for the foreign-born population - Greece (%)
Place of birth for the foreign-born population - Italy (%)
Place of birth for the foreign-born population - Portugal (%)
Place of birth for the foreign-born population - Spain (%)
Place of birth for the foreign-born population - Other Southern Europe (%)
Place of birth for the foreign-born population - Albania (%)
Place of birth for the foreign-born population - Belarus (%)
Place of birth for the foreign-born population - Bosnia and Herzegovina (%)
Place of birth for the foreign-born population - Bulgaria (%)
Place of birth for the foreign-born population - Croatia (%)
Place of birth for the foreign-born population - Czechoslovakia (%)
Place of birth for the foreign-born population - Hungary (%)
Place of birth for the foreign-born population - Latvia (%)
Place of birth for the foreign-born population - Lithuania (%)
Place of birth for the foreign-born population - North Macedonia (Macedonia) (%)
Place of birth for the foreign-born population - Moldova (%)
Place of birth for the foreign-born population - Poland (%)
Place of birth for the foreign-born population - Romania (%)
Place of birth for the foreign-born population - Russia (%)
Place of birth for the foreign-born population - Serbia (%)
Place of birth for the foreign-born population - Ukraine (%)
Place of birth for the foreign-born population - Other Eastern Europe (%)
Place of birth for the foreign-born population - China (%)
Place of birth for the foreign-born population - Hong Kong (%)
Place of birth for the foreign-born population - Taiwan (%)
Place of birth for the foreign-born population - Japan (%)
Place of birth for the foreign-born population - Korea (%)
Place of birth for the foreign-born population - Other Eastern Asia (%)
Place of birth for the foreign-born population - Afghanistan (%)
Place of birth for the foreign-born population - Bangladesh (%)
Place of birth for the foreign-born population - India (%)
Place of birth for the foreign-born population - Iran (%)
Place of birth for the foreign-born population - Kazakhstan (%)
Place of birth for the foreign-born population - Nepal (%)
Place of birth for the foreign-born population - Pakistan (%)
Place of birth for the foreign-born population - Sri Lanka (%)
Place of birth for the foreign-born population - Uzbekistan (%)
Place of birth for the foreign-born population - Other South Central Asia (%)
Place of birth for the foreign-born population - Burma (%)
Place of birth for the foreign-born population - Cambodia (%)
Place of birth for the foreign-born population - Indonesia (%)
Place of birth for the foreign-born population - Laos (%)
Place of birth for the foreign-born population - Malaysia (%)
Place of birth for the foreign-born population - Philippines (%)
Place of birth for the foreign-born population - Singapore (%)
Place of birth for the foreign-born population - Thailand (%)
Place of birth for the foreign-born population - Vietnam (%)
Place of birth for the foreign-born population - Other South Eastern Asia (%)
Place of birth for the foreign-born population - Armenia (%)
Place of birth for the foreign-born population - Iraq (%)
Place of birth for the foreign-born population - Israel (%)
Place of birth for the foreign-born population - Jordan (%)
Place of birth for the foreign-born population - Kuwait (%)
Place of birth for the foreign-born population - Lebanon (%)
Place of birth for the foreign-born population - Saudi Arabia (%)
Place of birth for the foreign-born population - Syria (%)
Place of birth for the foreign-born population - Turkey (%)
Place of birth for the foreign-born population - Yemen (%)
Place of birth for the foreign-born population - Other Western Asia (%)
Place of birth for the foreign-born population - Eritrea (%)
Place of birth for the foreign-born population - Ethiopia (%)
Place of birth for the foreign-born population - Kenya (%)
Place of birth for the foreign-born population - Somalia (%)
Place of birth for the foreign-born population - Uganda (%)
Place of birth for the foreign-born population - Zimbabwe (%)
Place of birth for the foreign-born population - Other Eastern Africa (%)
Place of birth for the foreign-born population - Cameroon (%)
Place of birth for the foreign-born population - Congo (%)
Place of birth for the foreign-born population - Democratic Republic of Congo (Zaire) (%)
Place of birth for the foreign-born population - Other Middle Africa (%)
Place of birth for the foreign-born population - Egypt (%)
Place of birth for the foreign-born population - Morocco (%)
Place of birth for the foreign-born population - Sudan (%)
Place of birth for the foreign-born population - Other Northern Africa (%)
Place of birth for the foreign-born population - South Africa (%)
Place of birth for the foreign-born population - Other Southern Africa (%)
Place of birth for the foreign-born population - Cabo Verde (%)
Place of birth for the foreign-born population - Ghana (%)
Place of birth for the foreign-born population - Liberia (%)
Place of birth for the foreign-born population - Nigeria (%)
Place of birth for the foreign-born population - Senegal (%)
Place of birth for the foreign-born population - Sierra Leone (%)
Place of birth for the foreign-born population - Other Western Africa (%)
Place of birth for the foreign-born population - Australia (%)
Place of birth for the foreign-born population - New Zealand (%)
Place of birth for the foreign-born population - Fiji (%)
Place of birth for the foreign-born population - Micronesia (%)
Place of birth for the foreign-born population - Bahamas (%)
Place of birth for the foreign-born population - Barbados (%)
Place of birth for the foreign-born population - Cuba (%)
Place of birth for the foreign-born population - Dominica (%)
Place of birth for the foreign-born population - Dominican Republic (%)
Place of birth for the foreign-born population - Grenada (%)
Place of birth for the foreign-born population - Haiti (%)
Place of birth for the foreign-born population - Jamaica (%)
Place of birth for the foreign-born population - St. Vincent and the Grenadines (%)
Place of birth for the foreign-born population - Trinidad and Tobago (%)
Place of birth for the foreign-born population - West Indies (%)
Place of birth for the foreign-born population - Other Caribbean (%)
Place of birth for the foreign-born population - Belize (%)
Place of birth for the foreign-born population - Costa Rica (%)
Place of birth for the foreign-born population - El Salvador (%)
Place of birth for the foreign-born population - Guatemala (%)
Place of birth for the foreign-born population - Honduras (%)
Place of birth for the foreign-born population - Mexico (%)
Place of birth for the foreign-born population - Nicaragua (%)
Place of birth for the foreign-born population - Panama (%)
Place of birth for the foreign-born population - Other Central America (%)
Place of birth for the foreign-born population - Argentina (%)
Place of birth for the foreign-born population - Bolivia (%)
Place of birth for the foreign-born population - Brazil (%)
Place of birth for the foreign-born population - Chile (%)
Place of birth for the foreign-born population - Colombia (%)
Place of birth for the foreign-born population - Ecuador (%)
Place of birth for the foreign-born population - Guyana (%)
Place of birth for the foreign-born population - Peru (%)
Place of birth for the foreign-born population - Uruguay (%)
Place of birth for the foreign-born population - Venezuela (%)
Place of birth for the foreign-born population - Other South America (%)
Place of birth for the foreign-born population - Canada (%)
Place of birth for the foreign-born population - Other Northern America (%)
Place of birth for the foreign-born population - Other (%)
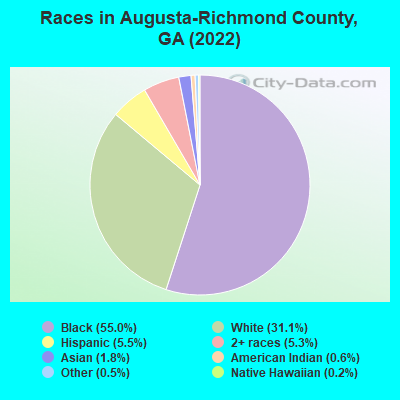
According to 2022 data, the most numerous races in Augusta-Richmond County, GA are White alone (62,995 residents), Black alone (111,457 residents), and Hispanic (11,228 residents). 92.3% of Augusta-Richmond County residents speak English at home. 3.5% of Augusta-Richmond County, GA residents are foreign-born (1.4% born in Asia, 1.2% born in Latin America, 0.4% born in Europe), which is 184.6% less than the foreign-born rate of 10.0% across the entire state of Georgia.
Race distribution in Augusta-Richmond County
2000 2022
97,517 50.0% Black alone 85,340 43.7% White alone 5,447 2.8% Hispanic 2,925 1.5% Asian alone 2,881 1.5% Two or more races 491 0.3% American Indian alone 359 0.2% Other race alone 222 0.1% Native Hawaiian and Other
111,457 55.0% Black alone 62,995 31.1% White alone 11,228 5.5% Hispanic 10,758 5.3% Two or more races 3,586 1.8% Asian alone 1,189 0.6% American Indian alone 1,074 0.5% Other race alone 309 0.2% Native Hawaiian and Other
2000 2022
5,128,661 62.6% White alone 2,331,465 28.5% Black alone 435,227 5.3% Hispanic 171,513 2.1% Asian alone 87,364 1.1% Two or more races 17,670 0.2% American Indian alone 11,275 0.1% Other race alone 3,278 0.04% Native Hawaiian and Other
5,415,657 49.6% White alone 3,349,240 30.7% Black alone 1,132,604 10.4% Hispanic 479,156 4.4% Asian alone 462,923 4.2% Two or more races 54,416 0.5% Other race alone 11,923 0.1% American Indian alone 6,957 0.06% Native Hawaiian and Other
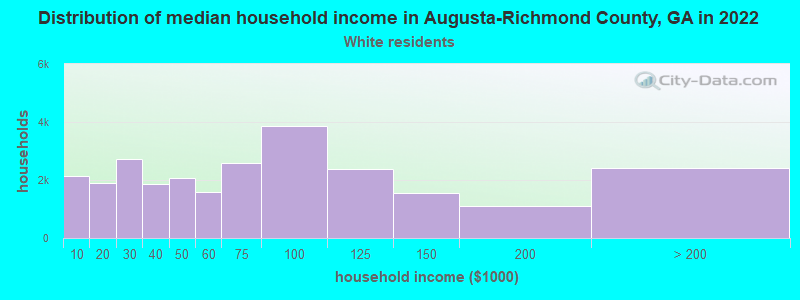
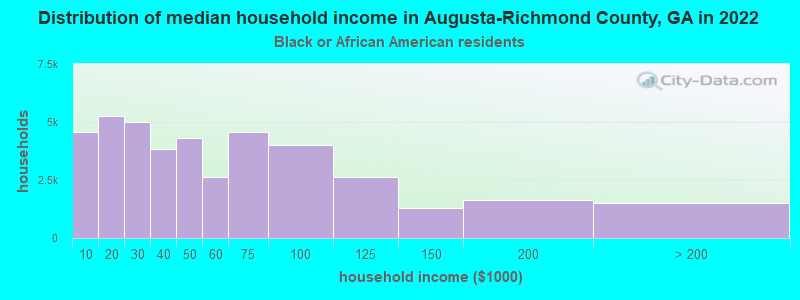
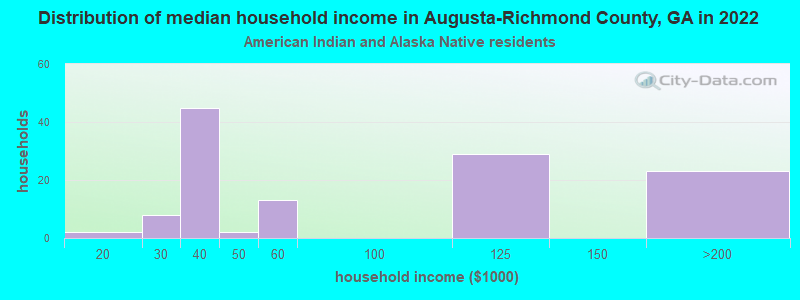
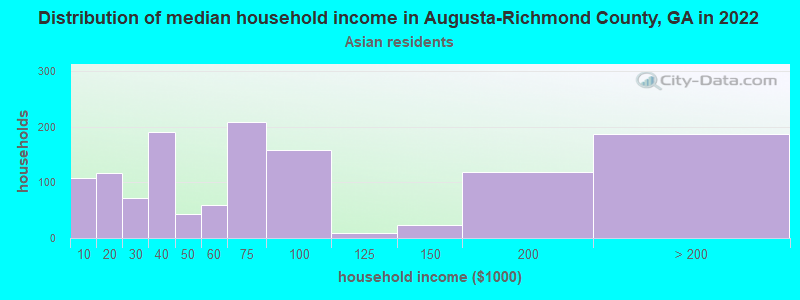
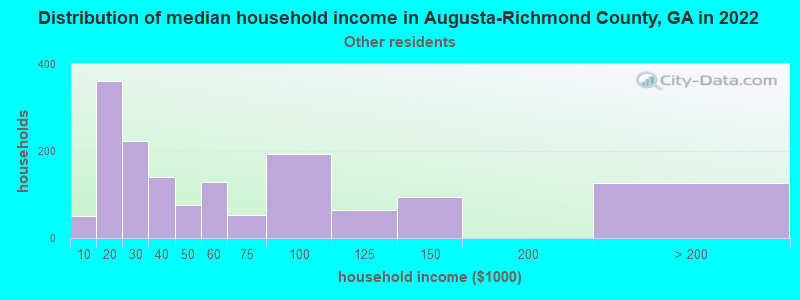
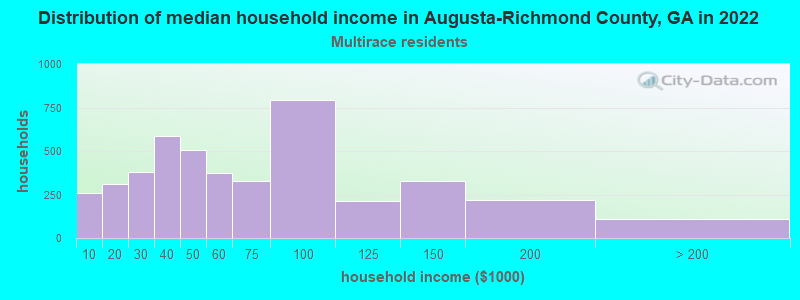
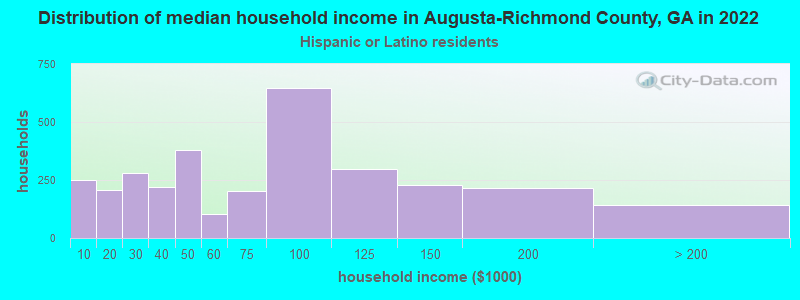
Income and house value in Augusta-Richmond County Median household income in 2022 $65,021 White non-Hispanic householders$43,886 Black householders$59,375 Asian householders$41,696 Some other race householders$44,907 Two or more races householders$56,000 Hispanic or Latino race householdersMedian 2022 house value $163,550 White Non-Hispanic householders$135,732 Black or African American householders$138,692 American Indian or Alaska Native householders $155,067 Asian householders$150,924 Native Hawaiian and other Pacific Islander householders$169,468 Some other race householders$156,250 Two or more races householders$160,393 Hispanic or Latino householders
Median age by race in Augusta-Richmond County
40.2 Median age for White residents37.1 42.9 34.9 Median age for Black or African American residents33.1 37.3 45.3 Median age for American Indian / Alaska Native residents33.6 49.2 33.8 Median age for Asian residents27.8 41.3 -666,666,666.0 Median age for Native Hawaiian / Pacific Islander residents-666,666,666.0 -666,666,666.0 28.9 Median age for Other race residents26.6 31.3 22.1 Median age for Two or more races residents21.7 22.2 40.8 Median age for White alone residents38.2 44.3 24.9 Median age for Hispanic or Latino residents24.5 27.4
Owner/renter occupied households by race in Augusta-Richmond County
House owners and renters - White residents 16,895 64.5% Owner occupied9,283 35.5% Renter occupiedHouse owners and renters - Black or African American residents 20,541 49.9% Owner occupied20,656 50.1% Renter occupiedHouse owners and renters - American Indian / Alaska Native residents 47 44.5% Owner occupied58 55.5% Renter occupiedHouse owners and renters - Asian residents 550 37.5% Owner occupied917 62.5% Renter occupiedHouse owners and renters - Native Hawaiian / Pacific Islander residents 16 100.0% Renter occupiedHouse owners and renters - Other race residents 618 44.4% Owner occupied774 55.6% Renter occupiedHouse owners and renters - Two or more races residents 1,960 57.3% Owner occupied1,463 42.7% Renter occupiedHouse owners and renters - White alone residents 16,529 65.5% Owner occupied8,698 34.5% Renter occupiedHouse owners and renters - Hispanic or Latino residents 1,707 50.0% Owner occupied1,707 50.0% Renter occupied
Language usage in Augusta-Richmond County
English speakers - Total 92.3% of residents of Augusta-Richmond County speak English at home.
4.1% of residents speak Spanish at home 5,808 75.2% Speak English very well1,915 24.8% Speak English less than very well3.6% of residents speak other language at home 5,806 84.6% Speak English very well1,056 15.4% Speak English less than very well
English speakers - Born in the United States 94.9% of residents of Augusta-Richmond County speak English at home.
2.7% of residents speak Spanish at home 1,336 75.6% Speak English very well431 24.4% Speak English less than very well2.3% of residents speak other language at home 1,440 95.3% Speak English very well71 4.7% Speak English less than very well
English speakers - Native, born elsewhere 71.2% of residents of Augusta-Richmond County speak English at home.
23.5% of residents speak Spanish at home 802 56.2% Speak English very well625 43.8% Speak English less than very well5.3% of residents speak other language at home 290 90.6% Speak English very well30 9.4% Speak English less than very well
English speakers - Foreign-born 27.0% of residents of Augusta-Richmond County speak English at home.
21.9% of residents speak Spanish at home 915 52.8% Speak English very well817 47.2% Speak English less than very well51.1% of residents speak other language at home 3,181 78.6% Speak English very well867 21.4% Speak English less than very well
White (Caucasian) - Speak only English Native:
96.4% (58,056)Foreign-born:
38.0% (676)
White (Caucasian) - Speak another language Native:
3.6% (2,171)Foreign-born:
62.0% (1,103)
Black or African American - Speak only English Native:
97.1% (101,335)Foreign-born:
42.7% (888)
Black or African American - Speak another language Native:
2.9% (3,063)Foreign-born:
57.3% (1,190)
American Indian / Alaska Native - Speak another language Native:
18.1% (45)Foreign-born:
100.0% (52)
Asian - Speak only English Native:
68.3% (1,116)Foreign-born:
16.5% (312)
Asian - Speak another language Native:
31.7% (517)Foreign-born:
83.5% (1,576)
Native Hawaiian / Pacific Islander - Speak another language Native:
58.8% (44)Foreign-born:
100.0% (104)
Other race - Speak only English Native:
52.3% (1,640)Foreign-born:
14.2% (156)
Other race - Speak another language Native:
47.7% (1,497)Foreign-born:
85.8% (944)
Two or more races - Speak only English Native:
88.4% (9,676)Foreign-born:
15.2% (107)
Two or more races - Speak another language Native:
11.6% (1,272)Foreign-born:
84.8% (595)
White alone - Speak only English Native:
97.8% (56,681)Foreign-born:
38.0% (676)
White alone - Speak another language Native:
2.2% (1,261)Foreign-born:
62.0% (1,103)
Hispanic or Latino - Speak only English Native:
53.5% (4,601)Foreign-born:
3.7% (62)
Hispanic or Latino - Speak another language Native:
46.5% (3,999)Foreign-born:
96.3% (1,593)
Foreign-born residents in Augusta-Richmond County 7,102 residents are foreign born (1.4% Asia , 1.2% Latin America , 0.4% Europe ).
This city:
3.5%Georgia:
10.4%
Marital status for residents in Augusta-Richmond County Marital status - White (Caucasian) population 15 years and over
Males 42.8% Never married41.1% Now married2.5% Separated3.7% Widowed9.8% DivorcedFemales 29.3% Never married41.3% Now married2.2% Separated11.7% Widowed15.5% DivorcedWomen who gave birth in the past 12 months Now married:
93.7% (595)Unmarried:
6.3% (40)
Women who did not give birth in the past 12 months Now married:
37.1% (5,156)Unmarried:
62.9% (8,728)
Marital status - Black or African American population 15 years and over
Males 55.9% Never married27.8% Now married2.2% Separated1.8% Widowed12.4% DivorcedFemales 47.7% Never married26.5% Now married4.0% Separated6.5% Widowed15.3% DivorcedWomen who gave birth in the past 12 months Now married:
10.8% (118)Unmarried:
89.2% (974)
Women who did not give birth in the past 12 months Now married:
27.3% (7,890)Unmarried:
72.7% (20,999)
Marital status - American Indian / Alaska Native population 15 years and over
Males 38.6% Never married31.1% Now married2.3% Separated0.0% Widowed28.0% DivorcedFemales 23.2% Never married56.1% Now married0.0% Separated6.1% Widowed14.6% DivorcedWomen who did not give birth in the past 12 months Now married:
81.5% (70)Unmarried:
18.5% (16)
Marital status - Asian population 15 years and over
Males 53.6% Never married37.6% Now married3.7% Separated2.6% Widowed2.4% DivorcedFemales 37.7% Never married43.0% Now married2.0% Separated14.3% Widowed2.9% DivorcedWomen who gave birth in the past 12 months Now married:
100.0% (39)Unmarried:
0.0% (0)
Women who did not give birth in the past 12 months Now married:
35.6% (285)Unmarried:
64.4% (514)
Marital status - Native Hawaiian / Pacific Islander population 15 years and over
Males 7.1% Never married92.9% Now married0.0% Separated0.0% Widowed0.0% DivorcedFemales 24.7% Never married75.3% Now married0.0% Separated0.0% Widowed0.0% DivorcedWomen who did not give birth in the past 12 months Now married:
68.6% (51)Unmarried:
31.4% (23)
Marital status - Other race population 15 years and over
Males 38.8% Never married33.3% Now married4.0% Separated1.3% Widowed22.6% DivorcedFemales 25.6% Never married39.0% Now married1.2% Separated20.5% Widowed13.7% DivorcedWomen who gave birth in the past 12 months Now married:
100.0% (75)Unmarried:
0.0% (0)
Women who did not give birth in the past 12 months Now married:
26.0% (209)Unmarried:
74.0% (594)
Marital status - Two or more races population 15 years and over
Males 55.5% Never married25.7% Now married0.0% Separated3.9% Widowed14.9% DivorcedFemales 48.3% Never married29.2% Now married3.4% Separated10.5% Widowed8.6% DivorcedWomen who gave birth in the past 12 months Now married:
34.9% (101)Unmarried:
65.1% (188)
Women who did not give birth in the past 12 months Now married:
27.6% (1,140)Unmarried:
72.4% (2,985)
Marital status - White alone, not Hispanic / Latino population 15 years and over
Males 42.1% Never married41.5% Now married2.5% Separated3.8% Widowed10.2% DivorcedFemales 27.5% Never married43.0% Now married2.3% Separated11.8% Widowed15.5% DivorcedWomen who gave birth in the past 12 months Now married:
93.7% (595)Unmarried:
6.3% (40)
Women who did not give birth in the past 12 months Now married:
39.2% (5,082)Unmarried:
60.8% (7,885)
Marital status - Hispanic or Latino population 15 years and over
Males 46.2% Never married45.2% Now married0.8% Separated4.2% Widowed3.6% DivorcedFemales 45.4% Never married37.8% Now married0.0% Separated5.0% Widowed11.7% DivorcedWomen who gave birth in the past 12 months Now married:
54.0% (92)Unmarried:
46.0% (79)
Women who did not give birth in the past 12 months Now married:
36.2% (947)Unmarried:
63.8% (1,668)
Ancestries in Augusta-Richmond County
8,089 6.1% American5,510 4.2% English2,817 2.1% German2,279 1.7% Irish1,939 1.5% African1,003 0.8% European600 0.5% Scottish597 0.5% Italian579 0.4% Scotch-Irish393 0.3% Haitian306 0.2% Nigerian290 0.2% Jamaican257 0.2% French Canadian245 0.2% Polish224 0.2% British184 0.1% French170 0.1% Norwegian161 0.1% Assyrian151 0.1% Dutch110 0.08% Welsh71 0.05% Iranian69 0.05% Ukrainian63 0.05% Russian59 0.04% Syrian56 0.04% Eastern European54 0.04% Northern European54 0.04% Israeli53 0.04% British West Indian48 0.04% Egyptian47 0.04% Austrian45 0.03% Guyanese41 0.03% South African41 0.03% Belizean39 0.03% Greek37 0.03% Barbadian36 0.03% West Indian31 0.02% Portuguese29 0.02% Canadian25 0.02% Cajun25 0.02% Slovak24 0.02% Albanian24 0.02% Slovene22 0.02% Turkish20 0.02% Swedish19 0.01% Zimbabwean19 0.01% Maltese15 0.01% Hungarian14 0.01% U.S. Virgin Islander13 0.01% Ghanaian11 0.01% Lebanese10 0.01% Pennsylvania German10 0.01% Romanian8 0.01% Slavic7 0.01% Arab7 0.01% Czech7 0.01% Bermudan7 0.01% Yugoslavian
Geographical mobility in Augusta-Richmond County Same house 1 year ago 54,278 84.2% White (Caucasian)95,553 85.0% Black or African American245 72.0% American Indian / Alaska Native2,982 78.3% Asian173 100.0% Native Hawaiian / Pacific Islander3,307 72.3% Other race9,955 70.1% Two or more races52,582 84.6% White alone, not Hispanic / Latino8,142 72.5% Hispanic or LatinoMoved within same county 3,772 5.9% White / Caucasian9,386 8.4% Black or African American31 9.1% American Indian / Alaska Native45 1.2% Asian877 19.2% Other race2,223 15.7% Two or more races3,670 5.9% White alone, not Hispanic / Latino1,263 11.2% Hispanic or LatinoMoved within same state 3,017 4.7% White / Caucasian2,239 2.0% Black or African American4 1.1% American Indian / Alaska Native157 4.1% Asian51 1.1% Other race975 6.9% Two or more races2,957 4.8% White alone, not Hispanic / Latino153 1.4% Hispanic or LatinoMoved from different state 3,269 5.1% White / Caucasian5,085 4.5% Black or African American60 17.5% American Indian / Alaska Native418 11.0% Asian7 4.2% Native Hawaiian / Pacific Islander244 5.3% Other race1,048 7.4% Two or more races2,916 4.7% White alone, not Hispanic / Latino1,502 13.4% Hispanic or LatinoMoved from abroad 104 0.2% White116 0.1% Black or African American293 7.7% Asian94 2.1% Other race30 0.0% White alone, not Hispanic / Latino168 1.5% Hispanic or Latino
Children Nativity (place of birth) in Augusta-Richmond County
Children under 6 years - Living with two parents Both parents native 4,519 100.0% NativeBoth parents foreign-born 85 49.1% Native88 50.9% Foreign-bornOne native, one foreign-born parent 360 100.0% NativeChildren under 6 years - Living with one parent Native parent 9,186 100.0% NativeForeign-born parent 141 100.0% NativeChildren 6 to 17 years - Living with two parents Both parents native 9,838 99.9% Native6 0.1% Foreign-bornBoth parents foreign-born 424 82.5% Native90 17.5% Foreign-bornOne native, one foreign-born parent 455 85.0% Native81 15.0% Foreign-bornChildren 6 to 17 years - Living with one parent Native parent 17,102 100.0% NativeForeign-born parent 554 50.3% Native547 49.7% Foreign-born
Place of birth for residents in Augusta-Richmond County
Grandparents responsible for own grandchildren in Augusta-Richmond County
Grandparents (30 to 59 years) White / Caucasian 122 22.6% Responsible for grandchildren419 77.4% Not responsible for grandchildrenBlack or African American 215 12.6% Responsible for grandchildren1,496 87.4% Not responsible for grandchildrenOther race 9 100.0% Not responsible for grandchildrenTwo or more races 37 36.3% Responsible for grandchildren65 63.7% Not responsible for grandchildrenWhite alone, not Hispanic / Latino 122 22.6% Responsible for grandchildren419 77.4% Not responsible for grandchildrenHispanic or Latino 77 68.1% Responsible for grandchildren36 31.9% Not responsible for grandchildrenGrandparents (60 years and over) White / Caucasian 372 43.7% Responsible for grandchildren480 56.3% Not responsible for grandchildrenBlack or African American 888 56.7% Responsible for grandchildren679 43.3% Not responsible for grandchildrenTwo or more races 46 26.2% Responsible for grandchildren130 73.8% Not responsible for grandchildrenWhite alone, not Hispanic / Latino 296 38.1% Responsible for grandchildren480 61.9% Not responsible for grandchildrenHispanic or Latino 55 61.3% Responsible for grandchildren35 38.7% Not responsible for grandchildren
Zip codes: 30805 , 30812 , 30813 , 30815 , 30901 , 30904 , 30905 , 30906 , 30907 , 30909 , 30912 .