Races in Aspen Hill, Maryland (MD) Detailed Stats
Data:
Races - White alone (%)
Races - White alone (% change since 2000)
Races - Black alone (%)
Races - Black alone (% change since 2000)
Races - American Indian alone (%)
Races - American Indian alone (% change since 2000)
Races - Asian alone (%)
Races - Asian alone (% change since 2000)
Races - Hispanic (%)
Races - Hispanic (% change since 2000)
Races - Native Hawaiian and Other Pacific Islander alone (%)
Races - Native Hawaiian and Other Pacific Islander alone (% change since 2000)
Races - Two or more races(%)
Races - Two or more races(% change since 2000)
Races - Other race alone (%)
Races - Other race alone (% change since 2000)
Racial diversity
Place of birth - Born in state of residence (%)
Place of birth - Born in state of residence (%) - White
Place of birth - Born in state of residence (%) - Black or African American
Place of birth - Born in state of residence (%) - Asian
Place of birth - Born in state of residence (%) - Hispanic or Latino
Place of birth - Born in state of residence (%) - American Indian and Alaska Native
Place of birth - Born in state of residence (%) - Multirace
Place of birth - Born in state of residence (%) - Other Race
Place of birth - Born in other state (%)
Place of birth - Born in other state (%) - White
Place of birth - Born in other state (%) - Black or African American
Place of birth - Born in other state (%) - Asian
Place of birth - Born in other state (%) - Hispanic or Latino
Place of birth - Born in other state (%) - American Indian and Alaska Native
Place of birth - Born in other state (%) - Multirace
Place of birth - Born in other state (%) - Other Race
Place of birth - Native, outside of US (%)
Place of birth - Native, outside of US (%) - White
Place of birth - Native, outside of US (%) - Black or African American
Place of birth - Native, outside of US (%) - Asian
Place of birth - Native, outside of US (%) - Hispanic or Latino
Place of birth - Native, outside of US (%) - American Indian and Alaska Native
Place of birth - Native, outside of US (%) - Multirace
Place of birth - Native, outside of US (%) - Other Race
Place of birth - Foreign born (%)
Place of birth - Foreign born (%) - White
Place of birth - Foreign born (%) - Black or African American
Place of birth - Foreign born (%) - Asian
Place of birth - Foreign born (%) - Hispanic or Latino
Place of birth - Foreign born (%) - American Indian and Alaska Native
Place of birth - Foreign born (%) - Multirace
Place of birth - Foreign born (%) - Other Race
Residents speaking English at home (%)
Residents speaking English at home - Born in the United States (%)
Residents speaking English at home - Native, born elsewhere (%)
Residents speaking English at home - Foreign born (%)
Residents speaking Spanish at home (%)
Residents speaking Spanish at home - Born in the United States (%)
Residents speaking Spanish at home - Native, born elsewhere (%)
Residents speaking Spanish at home - Foreign born (%)
Residents speaking other language at home (%)
Residents speaking other language at home - Born in the United States (%)
Residents speaking other language at home - Native, born elsewhere (%)
Residents speaking other language at home - Foreign born (%)
Marital status - Never married (%)
Marital status - Now married (%)
Marital status - Separated (%)
Marital status - Widowed (%)
Marital status - Divorced (%)
Ancestries Reported - Arab (%)
Ancestries Reported - Czech (%)
Ancestries Reported - Danish (%)
Ancestries Reported - Dutch (%)
Ancestries Reported - English (%)
Ancestries Reported - French (%)
Ancestries Reported - French Canadian (%)
Ancestries Reported - German (%)
Ancestries Reported - Greek (%)
Ancestries Reported - Hungarian (%)
Ancestries Reported - Irish (%)
Ancestries Reported - Italian (%)
Ancestries Reported - Lithuanian (%)
Ancestries Reported - Norwegian (%)
Ancestries Reported - Polish (%)
Ancestries Reported - Portuguese (%)
Ancestries Reported - Russian (%)
Ancestries Reported - Scotch-Irish (%)
Ancestries Reported - Scottish (%)
Ancestries Reported - Slovak (%)
Ancestries Reported - Subsaharan African (%)
Ancestries Reported - Swedish (%)
Ancestries Reported - Swiss (%)
Ancestries Reported - Ukrainian (%)
Ancestries Reported - United States (%)
Ancestries Reported - Welsh (%)
Ancestries Reported - West Indian (%)
Ancestries Reported - Other (%)
Geographical mobility - Same house 1 year ago (%)
Geographical mobility - Same house 1 year ago (%) - White
Geographical mobility - Same house 1 year ago (%) - Black or African American
Geographical mobility - Same house 1 year ago (%) - Asian
Geographical mobility - Same house 1 year ago (%) - Hispanic or Latino
Geographical mobility - Same house 1 year ago (%) - American Indian and Alaska Native
Geographical mobility - Same house 1 year ago (%) - Multirace
Geographical mobility - Same house 1 year ago (%) - Other Race
Geographical mobility - Moved within same county (%)
Geographical mobility - Moved within same county (%) - White
Geographical mobility - Moved within same county (%) - Black or African American
Geographical mobility - Moved within same county (%) - Asian
Geographical mobility - Moved within same county (%) - Hispanic or Latino
Geographical mobility - Moved within same county (%) - American Indian and Alaska Native
Geographical mobility - Moved within same county (%) - Multirace
Geographical mobility - Moved within same county (%) - Other Race
Geographical mobility - Moved from different county within same state (%)
Geographical mobility - Moved from different county within same state (%) - White
Geographical mobility - Moved from different county within same state (%) - Black or African American
Geographical mobility - Moved from different county within same state (%) - Asian
Geographical mobility - Moved from different county within same state (%) - Hispanic or Latino
Geographical mobility - Moved from different county within same state (%) - American Indian and Alaska Native
Geographical mobility - Moved from different county within same state (%) - Multirace
Geographical mobility - Moved from different county within same state (%) - Other Race
Geographical mobility - Moved from different state (%)
Geographical mobility - Moved from different state (%) - White
Geographical mobility - Moved from different state (%) - Black or African American
Geographical mobility - Moved from different state (%) - Asian
Geographical mobility - Moved from different state (%) - Hispanic or Latino
Geographical mobility - Moved from different state (%) - American Indian and Alaska Native
Geographical mobility - Moved from different state (%) - Multirace
Geographical mobility - Moved from different state (%) - Other Race
Geographical mobility - Moved from abroad (%)
Geographical mobility - Moved from abroad (%) - White
Geographical mobility - Moved from abroad (%) - Black or African American
Geographical mobility - Moved from abroad (%) - Asian
Geographical mobility - Moved from abroad (%) - Hispanic or Latino
Geographical mobility - Moved from abroad (%) - American Indian and Alaska Native
Geographical mobility - Moved from abroad (%) - Multirace
Geographical mobility - Moved from abroad (%) - Other Race
Place of birth for the foreign-born population - Ireland (%)
Place of birth for the foreign-born population - Denmark (%)
Place of birth for the foreign-born population - Norway (%)
Place of birth for the foreign-born population - Sweden (%)
Place of birth for the foreign-born population - United Kingdom (%)
Place of birth for the foreign-born population - England (%)
Place of birth for the foreign-born population - Scotland (%)
Place of birth for the foreign-born population - Other Northern Europe (%)
Place of birth for the foreign-born population - Austria (%)
Place of birth for the foreign-born population - Belgium (%)
Place of birth for the foreign-born population - France (%)
Place of birth for the foreign-born population - Germany (%)
Place of birth for the foreign-born population - Netherlands (%)
Place of birth for the foreign-born population - Switzerland (%)
Place of birth for the foreign-born population - Other Western Europe (%)
Place of birth for the foreign-born population - Greece (%)
Place of birth for the foreign-born population - Italy (%)
Place of birth for the foreign-born population - Portugal (%)
Place of birth for the foreign-born population - Spain (%)
Place of birth for the foreign-born population - Other Southern Europe (%)
Place of birth for the foreign-born population - Albania (%)
Place of birth for the foreign-born population - Belarus (%)
Place of birth for the foreign-born population - Bosnia and Herzegovina (%)
Place of birth for the foreign-born population - Bulgaria (%)
Place of birth for the foreign-born population - Croatia (%)
Place of birth for the foreign-born population - Czechoslovakia (%)
Place of birth for the foreign-born population - Hungary (%)
Place of birth for the foreign-born population - Latvia (%)
Place of birth for the foreign-born population - Lithuania (%)
Place of birth for the foreign-born population - North Macedonia (Macedonia) (%)
Place of birth for the foreign-born population - Moldova (%)
Place of birth for the foreign-born population - Poland (%)
Place of birth for the foreign-born population - Romania (%)
Place of birth for the foreign-born population - Russia (%)
Place of birth for the foreign-born population - Serbia (%)
Place of birth for the foreign-born population - Ukraine (%)
Place of birth for the foreign-born population - Other Eastern Europe (%)
Place of birth for the foreign-born population - China (%)
Place of birth for the foreign-born population - Hong Kong (%)
Place of birth for the foreign-born population - Taiwan (%)
Place of birth for the foreign-born population - Japan (%)
Place of birth for the foreign-born population - Korea (%)
Place of birth for the foreign-born population - Other Eastern Asia (%)
Place of birth for the foreign-born population - Afghanistan (%)
Place of birth for the foreign-born population - Bangladesh (%)
Place of birth for the foreign-born population - India (%)
Place of birth for the foreign-born population - Iran (%)
Place of birth for the foreign-born population - Kazakhstan (%)
Place of birth for the foreign-born population - Nepal (%)
Place of birth for the foreign-born population - Pakistan (%)
Place of birth for the foreign-born population - Sri Lanka (%)
Place of birth for the foreign-born population - Uzbekistan (%)
Place of birth for the foreign-born population - Other South Central Asia (%)
Place of birth for the foreign-born population - Burma (%)
Place of birth for the foreign-born population - Cambodia (%)
Place of birth for the foreign-born population - Indonesia (%)
Place of birth for the foreign-born population - Laos (%)
Place of birth for the foreign-born population - Malaysia (%)
Place of birth for the foreign-born population - Philippines (%)
Place of birth for the foreign-born population - Singapore (%)
Place of birth for the foreign-born population - Thailand (%)
Place of birth for the foreign-born population - Vietnam (%)
Place of birth for the foreign-born population - Other South Eastern Asia (%)
Place of birth for the foreign-born population - Armenia (%)
Place of birth for the foreign-born population - Iraq (%)
Place of birth for the foreign-born population - Israel (%)
Place of birth for the foreign-born population - Jordan (%)
Place of birth for the foreign-born population - Kuwait (%)
Place of birth for the foreign-born population - Lebanon (%)
Place of birth for the foreign-born population - Saudi Arabia (%)
Place of birth for the foreign-born population - Syria (%)
Place of birth for the foreign-born population - Turkey (%)
Place of birth for the foreign-born population - Yemen (%)
Place of birth for the foreign-born population - Other Western Asia (%)
Place of birth for the foreign-born population - Eritrea (%)
Place of birth for the foreign-born population - Ethiopia (%)
Place of birth for the foreign-born population - Kenya (%)
Place of birth for the foreign-born population - Somalia (%)
Place of birth for the foreign-born population - Uganda (%)
Place of birth for the foreign-born population - Zimbabwe (%)
Place of birth for the foreign-born population - Other Eastern Africa (%)
Place of birth for the foreign-born population - Cameroon (%)
Place of birth for the foreign-born population - Congo (%)
Place of birth for the foreign-born population - Democratic Republic of Congo (Zaire) (%)
Place of birth for the foreign-born population - Other Middle Africa (%)
Place of birth for the foreign-born population - Egypt (%)
Place of birth for the foreign-born population - Morocco (%)
Place of birth for the foreign-born population - Sudan (%)
Place of birth for the foreign-born population - Other Northern Africa (%)
Place of birth for the foreign-born population - South Africa (%)
Place of birth for the foreign-born population - Other Southern Africa (%)
Place of birth for the foreign-born population - Cabo Verde (%)
Place of birth for the foreign-born population - Ghana (%)
Place of birth for the foreign-born population - Liberia (%)
Place of birth for the foreign-born population - Nigeria (%)
Place of birth for the foreign-born population - Senegal (%)
Place of birth for the foreign-born population - Sierra Leone (%)
Place of birth for the foreign-born population - Other Western Africa (%)
Place of birth for the foreign-born population - Australia (%)
Place of birth for the foreign-born population - New Zealand (%)
Place of birth for the foreign-born population - Fiji (%)
Place of birth for the foreign-born population - Micronesia (%)
Place of birth for the foreign-born population - Bahamas (%)
Place of birth for the foreign-born population - Barbados (%)
Place of birth for the foreign-born population - Cuba (%)
Place of birth for the foreign-born population - Dominica (%)
Place of birth for the foreign-born population - Dominican Republic (%)
Place of birth for the foreign-born population - Grenada (%)
Place of birth for the foreign-born population - Haiti (%)
Place of birth for the foreign-born population - Jamaica (%)
Place of birth for the foreign-born population - St. Vincent and the Grenadines (%)
Place of birth for the foreign-born population - Trinidad and Tobago (%)
Place of birth for the foreign-born population - West Indies (%)
Place of birth for the foreign-born population - Other Caribbean (%)
Place of birth for the foreign-born population - Belize (%)
Place of birth for the foreign-born population - Costa Rica (%)
Place of birth for the foreign-born population - El Salvador (%)
Place of birth for the foreign-born population - Guatemala (%)
Place of birth for the foreign-born population - Honduras (%)
Place of birth for the foreign-born population - Mexico (%)
Place of birth for the foreign-born population - Nicaragua (%)
Place of birth for the foreign-born population - Panama (%)
Place of birth for the foreign-born population - Other Central America (%)
Place of birth for the foreign-born population - Argentina (%)
Place of birth for the foreign-born population - Bolivia (%)
Place of birth for the foreign-born population - Brazil (%)
Place of birth for the foreign-born population - Chile (%)
Place of birth for the foreign-born population - Colombia (%)
Place of birth for the foreign-born population - Ecuador (%)
Place of birth for the foreign-born population - Guyana (%)
Place of birth for the foreign-born population - Peru (%)
Place of birth for the foreign-born population - Uruguay (%)
Place of birth for the foreign-born population - Venezuela (%)
Place of birth for the foreign-born population - Other South America (%)
Place of birth for the foreign-born population - Canada (%)
Place of birth for the foreign-born population - Other Northern America (%)
Place of birth for the foreign-born population - Other (%)
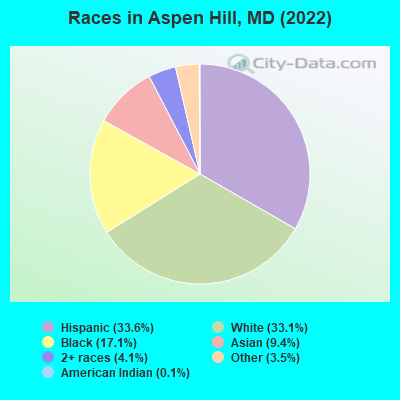
According to 2022 data, the most numerous races in Aspen Hill, MD are White alone (17,896 residents), Black alone (9,219 residents), and Hispanic (18,141 residents). 49.4% of Aspen Hill residents speak English at home. 39.3% of Aspen Hill, MD residents are foreign-born (22.3% born in Latin America, 7.0% born in Asia, 6.0% born in Africa), which is 59.3% greater than the foreign-born rate of 16.0% across the entire state of Maryland.
Race distribution in Aspen Hill
2000 2022
24,701 49.2% White alone 10,330 20.6% Black alone 7,757 15.4% Hispanic 5,747 11.4% Asian alone 1,309 2.6% Two or more races 242 0.5% Other race alone 114 0.2% American Indian alone 28 0.06% Native Hawaiian and Other
18,141 33.6% Hispanic 17,896 33.1% White alone 9,219 17.1% Black alone 5,068 9.4% Asian alone 2,194 4.1% Two or more races 1,869 3.5% Other race alone 73 0.1% American Indian alone
2000 2022
3,286,547 62.1% White alone 1,464,735 27.7% Black alone 227,916 4.3% Hispanic 209,738 4.0% Asian alone 82,946 1.6% Two or more races 13,312 0.3% American Indian alone 9,379 0.2% Other race alone 1,913 0.04% Native Hawaiian and Other
2,906,492 47.1% White alone 1,800,914 29.2% Black alone 705,842 11.4% Hispanic 401,818 6.5% Asian alone 291,317 4.7% Two or more races 46,930 0.8% Other race alone 8,930 0.1% American Indian alone 2,417 0.04% Native Hawaiian and Other
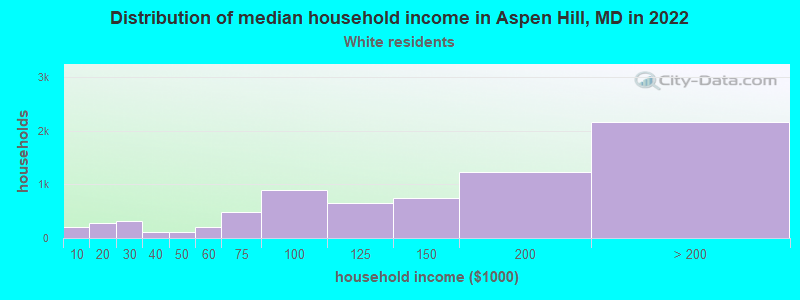
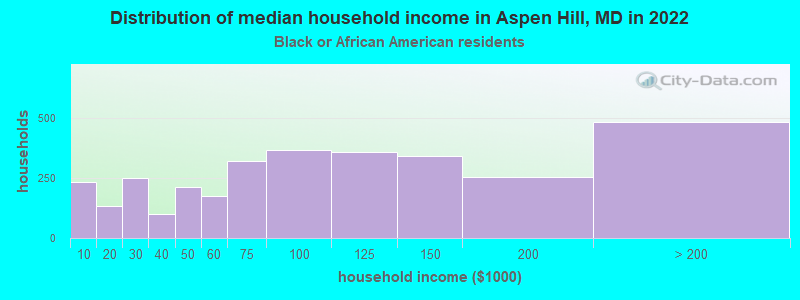
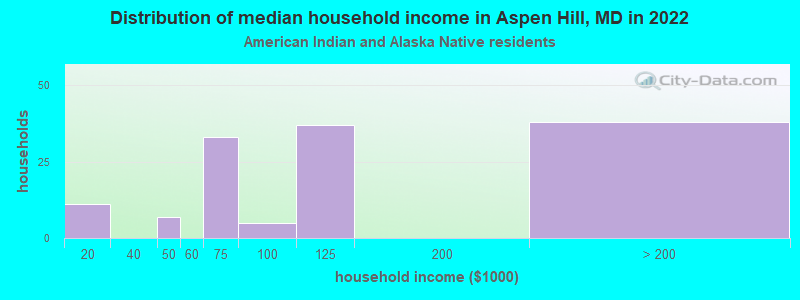
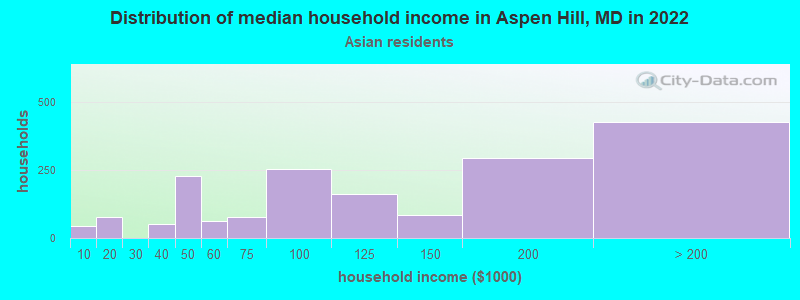
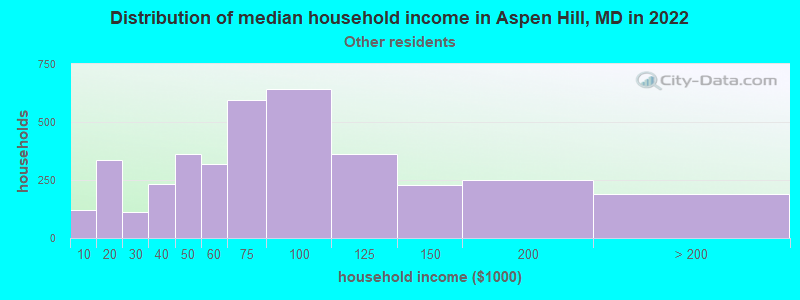
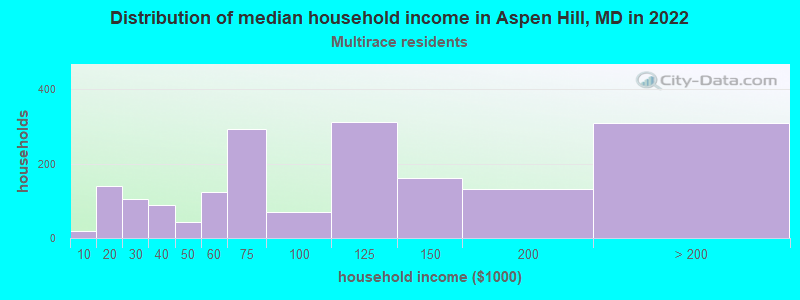
Income and house value in Aspen Hill Median household income in 2022 $138,977 White non-Hispanic householders$87,389 Black householders$98,190 American Indian and Alaska Native householders$112,757 Asian householders$65,204 Some other race householders$91,191 Two or more races householders$72,936 Hispanic or Latino race householdersMedian 2022 house value $567,567 White Non-Hispanic householders$485,214 Black or African American householders$417,329 American Indian or Alaska Native householders $519,157 Asian householdersover $1,000,000 Native Hawaiian and other Pacific Islander householders$435,970 Some other race householders$495,509 Two or more races householders$447,377 Hispanic or Latino householders
Median age by race in Aspen Hill
42.7 Median age for White residents40.8 44.0 41.3 Median age for Black or African American residents41.5 41.6 32.2 Median age for American Indian / Alaska Native residents28.6 35.8 42.8 Median age for Asian residents43.0 42.0 -763,333,332.6 Median age for Native Hawaiian / Pacific Islander residents-720,061,021.4 -760,942,760.2 27.4 Median age for Other race residents27.2 27.9 34.4 Median age for Two or more races residents33.5 34.9 42.7 Median age for White alone residents40.4 43.5 30.4 Median age for Hispanic or Latino residents30.3 30.3
Owner/renter occupied households by race in Aspen Hill
House owners and renters - White residents 5,843 78.2% Owner occupied1,633 21.8% Renter occupiedHouse owners and renters - Black or African American residents 1,851 55.7% Owner occupied1,470 44.3% Renter occupiedHouse owners and renters - American Indian / Alaska Native residents 125 96.1% Owner occupied5 3.9% Renter occupiedHouse owners and renters - Asian residents 1,467 81.3% Owner occupied338 18.7% Renter occupiedHouse owners and renters - Other race residents 1,333 36.4% Owner occupied2,329 63.6% Renter occupiedHouse owners and renters - Two or more races residents 817 43.2% Owner occupied1,072 56.8% Renter occupiedHouse owners and renters - White alone residents 5,494 79.0% Owner occupied1,464 21.0% Renter occupiedHouse owners and renters - Hispanic or Latino residents 2,168 47.6% Owner occupied2,386 52.4% Renter occupied
Language usage in Aspen Hill
English speakers - Total 49.4% of residents of Aspen Hill speak English at home.
29.5% of residents speak Spanish at home 7,647 50.9% Speak English very well7,374 49.1% Speak English less than very well21.2% of residents speak other language at home 7,192 66.6% Speak English very well3,602 33.4% Speak English less than very well
English speakers - Born in the United States 83.8% of residents of Aspen Hill speak English at home.
9.9% of residents speak Spanish at home 1,265 83.9% Speak English very well243 16.1% Speak English less than very well5.8% of residents speak other language at home 868 98.1% Speak English very well17 1.9% Speak English less than very well
English speakers - Native, born elsewhere 36.2% of residents of Aspen Hill speak English at home.
63.1% of residents speak Spanish at home 378 54.2% Speak English very well320 45.8% Speak English less than very well5.7% of residents speak other language at home 53 84.1% Speak English very well10 15.9% Speak English less than very well
English speakers - Foreign-born 13.8% of residents of Aspen Hill speak English at home.
45.8% of residents speak Spanish at home 3,087 32.2% Speak English very well6,511 67.8% Speak English less than very well40.5% of residents speak other language at home 5,158 60.8% Speak English very well3,325 39.2% Speak English less than very well
White (Caucasian) - Speak only English Native:
88.4% (14,008)Foreign-born:
21.4% (648)
White (Caucasian) - Speak another language Native:
10.4% (1,644)Foreign-born:
78.6% (2,386)
Black or African American - Speak only English Native:
84.4% (4,449)Foreign-born:
25.9% (974)
Black or African American - Speak another language Native:
15.9% (836)Foreign-born:
73.0% (2,745)
American Indian / Alaska Native - Speak only English Native:
27.8% (26)Foreign-born:
7.4% (16)
American Indian / Alaska Native - Speak another language Native:
86.6% (80)Foreign-born:
100.0% (216)
Asian - Speak only English Native:
60.4% (997)Foreign-born:
14.7% (507)
Asian - Speak another language Native:
36.9% (610)Foreign-born:
85.4% (2,945)
Other race - Speak only English Native:
23.8% (904)Foreign-born:
5.6% (537)
Other race - Speak another language Native:
76.1% (2,892)Foreign-born:
94.2% (9,019)
Two or more races - Speak only English Native:
53.5% (2,010)Foreign-born:
8.7% (176)
Two or more races - Speak another language Native:
49.1% (1,847)Foreign-born:
91.0% (1,849)
White alone - Speak only English Native:
93.8% (13,829)Foreign-born:
23.2% (573)
White alone - Speak another language Native:
6.1% (904)Foreign-born:
76.8% (1,899)
Hispanic or Latino - Speak only English Native:
24.7% (1,699)Foreign-born:
6.3% (613)
Hispanic or Latino - Speak another language Native:
74.7% (5,136)Foreign-born:
93.5% (9,125)
Foreign-born residents in Aspen Hill 21,228 residents are foreign born (22.3% Latin America , 7.0% Asia , 6.0% Africa ).
This city:
39.3%Maryland:
15.7%
Marital status for residents in Aspen Hill Marital status - White (Caucasian) population 15 years and over
Males 36.1% Never married56.4% Now married0.4% Separated3.1% Widowed3.9% DivorcedFemales 30.8% Never married49.4% Now married0.3% Separated11.0% Widowed8.6% DivorcedWomen who gave birth in the past 12 months Now married:
87.9% (252)Unmarried:
12.1% (35)
Women who did not give birth in the past 12 months Now married:
40.4% (1,699)Unmarried:
59.6% (2,507)
Marital status - Black or African American population 15 years and over
Males 40.4% Never married54.2% Now married0.0% Separated0.5% Widowed4.9% DivorcedFemales 39.4% Never married35.2% Now married2.2% Separated3.3% Widowed20.0% DivorcedWomen who gave birth in the past 12 months Now married:
100.0% (114)Unmarried:
0.0% (0)
Women who did not give birth in the past 12 months Now married:
33.1% (891)Unmarried:
66.9% (1,798)
Marital status - American Indian / Alaska Native population 15 years and over
Males 29.5% Never married70.5% Now married0.0% Separated0.0% Widowed0.0% DivorcedFemales 50.0% Never married44.2% Now married0.0% Separated5.8% Widowed0.0% DivorcedWomen who gave birth in the past 12 months Now married:
100.0% (24)Unmarried:
0.0% (0)
Women who did not give birth in the past 12 months Now married:
46.9% (34)Unmarried:
53.1% (39)
Marital status - Asian population 15 years and over
Males 33.7% Never married59.6% Now married0.5% Separated2.8% Widowed3.5% DivorcedFemales 21.4% Never married62.9% Now married1.9% Separated7.8% Widowed6.0% DivorcedWomen who gave birth in the past 12 months Now married:
100.0% (45)Unmarried:
0.0% (0)
Women who did not give birth in the past 12 months Now married:
58.2% (652)Unmarried:
41.8% (468)
Marital status - Other race population 15 years and over
Males 47.8% Never married46.0% Now married0.4% Separated0.0% Widowed5.8% DivorcedFemales 45.0% Never married37.2% Now married3.3% Separated3.2% Widowed11.3% DivorcedWomen who gave birth in the past 12 months Now married:
53.2% (154)Unmarried:
46.8% (136)
Women who did not give birth in the past 12 months Now married:
41.2% (1,509)Unmarried:
58.8% (2,156)
Marital status - Two or more races population 15 years and over
Males 47.6% Never married41.4% Now married3.3% Separated2.6% Widowed5.0% DivorcedFemales 33.2% Never married34.4% Now married5.7% Separated7.3% Widowed19.4% DivorcedWomen who gave birth in the past 12 months Now married:
64.3% (21)Unmarried:
35.7% (12)
Women who did not give birth in the past 12 months Now married:
37.2% (438)Unmarried:
62.8% (737)
Marital status - White alone, not Hispanic / Latino population 15 years and over
Males 36.6% Never married55.7% Now married0.5% Separated3.6% Widowed3.6% DivorcedFemales 28.4% Never married51.7% Now married0.1% Separated11.4% Widowed8.4% DivorcedWomen who gave birth in the past 12 months Now married:
100.0% (263)Unmarried:
0.0% (0)
Women who did not give birth in the past 12 months Now married:
43.0% (1,566)Unmarried:
57.0% (2,073)
Marital status - Hispanic or Latino population 15 years and over
Males 45.1% Never married46.6% Now married1.2% Separated0.7% Widowed6.4% DivorcedFemales 45.2% Never married35.6% Now married3.3% Separated4.2% Widowed11.7% DivorcedWomen who gave birth in the past 12 months Now married:
41.7% (115)Unmarried:
58.3% (161)
Women who did not give birth in the past 12 months Now married:
37.1% (1,650)Unmarried:
62.9% (2,798)
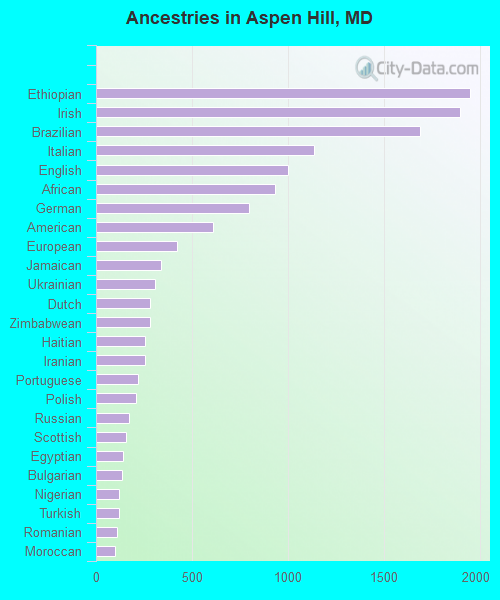
Ancestries in Aspen Hill
1,950 5.7% Ethiopian1,896 5.5% Irish1,686 4.9% Brazilian1,138 3.3% Italian1,001 2.9% English934 2.7% African796 2.3% German609 1.8% American421 1.2% European340 1.0% Jamaican306 0.9% Ukrainian283 0.8% Dutch281 0.8% Zimbabwean256 0.7% Haitian255 0.7% Iranian220 0.6% Portuguese206 0.6% Polish171 0.5% Russian158 0.5% Scottish141 0.4% Egyptian134 0.4% Bulgarian122 0.4% Nigerian118 0.3% Turkish109 0.3% Romanian97 0.3% Moroccan96 0.3% Greek76 0.2% Eastern European75 0.2% Lebanese70 0.2% British West Indian67 0.2% British65 0.2% Ghanaian61 0.2% Hungarian59 0.2% Swedish58 0.2% Palestinian57 0.2% French49 0.1% Trinidadian and Tobagonian41 0.1% Czech40 0.1% Finnish38 0.1% Slovene29 0.08% Swiss29 0.08% Welsh29 0.08% Barbadian27 0.08% Arab27 0.08% Czechoslovakian27 0.08% Yugoslavian26 0.08% Northern European24 0.07% Scotch-Irish23 0.07% Austrian19 0.06% Belizean18 0.05% Scandinavian16 0.05% Celtic16 0.05% Senegalese15 0.04% Lithuanian15 0.04% Cape Verdean14 0.04% Canadian14 0.04% Norwegian12 0.03% Guyanese11 0.03% Liberian10 0.03% Ugandan9 0.03% Croatian8 0.02% West Indian7 0.02% Latvian4 0.01% Israeli
Geographical mobility in Aspen Hill Same house 1 year ago 17,501 89.8% White (Caucasian)8,370 90.8% Black or African American344 92.7% American Indian / Alaska Native4,898 93.2% Asian12,965 88.7% Other race5,411 88.5% Two or more races15,773 89.0% White alone, not Hispanic / Latino16,458 92.4% Hispanic or LatinoMoved within same county 1,047 5.4% White / Caucasian437 4.7% Black or African American23 6.2% American Indian / Alaska Native212 4.0% Asian1,262 8.6% Other race282 4.6% Two or more races1,000 5.6% White alone, not Hispanic / Latino1,078 6.1% Hispanic or LatinoMoved within same state 151 0.8% White / Caucasian41 0.4% Black or African American86 0.6% Other race52 0.9% Two or more races131 0.7% White alone, not Hispanic / Latino175 1.0% Hispanic or LatinoMoved from different state 574 2.9% White / Caucasian142 1.5% Black or African American66 1.2% Asian65 0.4% Other race70 1.1% Two or more races560 3.2% White alone, not Hispanic / Latino125 0.7% Hispanic or LatinoMoved from abroad 206 1.1% White268 2.9% Black or African American34 0.6% Asian248 1.7% Other race421 6.9% Two or more races231 1.3% White alone, not Hispanic / Latino99 0.6% Hispanic or Latino
Children Nativity (place of birth) in Aspen Hill
Children under 6 years - Living with two parents Both parents native 941 100.0% NativeBoth parents foreign-born 870 82.1% Native189 17.9% Foreign-bornOne native, one foreign-born parent 620 100.0% NativeChildren under 6 years - Living with one parent Native parent 29 100.0% NativeForeign-born parent 770 100.0% NativeChildren 6 to 17 years - Living with two parents Both parents native 2,537 99.5% Native13 0.5% Foreign-bornBoth parents foreign-born 2,357 67.6% Native1,129 32.4% Foreign-bornOne native, one foreign-born parent 853 100.0% NativeChildren 6 to 17 years - Living with one parent Native parent 983 100.0% NativeForeign-born parent 1,141 52.9% Native1,014 47.1% Foreign-born
Place of birth for residents in Aspen Hill 12,834 Americas12,595 Latin America6,487 Central America5,107 South America3,961 Asia3,394 Africa1,375 South Eastern Asia1,357 Eastern Africa1,253 Western Africa1,203 South Central Asia1,166 Eastern Asia1,031 Europe1,000 Caribbean596 China477 Eastern Europe363 Middle Africa333 Northern Africa238 Northern America200 Western Europe199 Northern Europe166 Western Asia153 Southern Europe51 Southern Africa7 Oceania7 Australia and New Zealand Subregion3,809 El Salvador1,882 Brazil1,502 Honduras1,178 Peru1,170 Ethiopia744 Guatemala655 Ecuador560 Korea497 Vietnam466 India450 Philippines444 China436 Colombia432 Ghana409 Sierra Leone342 Dominican Republic326 Bolivia299 Cameroon272 Mexico264 Sri Lanka257 Pakistan238 Canada222 Venezuela210 Jamaica192 Morocco167 Guyana152 Thailand141 Egypt130 Zimbabwe128 Iran127 Uruguay125 Haiti122 Nigeria121 Bulgaria115 Cambodia111 Chile101 Germany99 Taiwan98 Trinidad and Tobago92 United Kingdom83 France78 Romania75 England73 Ukraine73 Panama72 Nepal72 Ivory Coast69 Russia62 Malaysia62 Lebanon62 Turkey59 Portugal58 Italy52 Burma (Myanmar)52 Nicaragua51 Hong Kong51 South Africa50 West Indies44 Dominica40 Senegal40 Cuba40 Liberia37 Czechoslovakia36 Greece32 Israel31 Belize31 Barbados29 Uganda25 Togo24 Democratic Republic of Congo (Zaire)22 Grenada19 Indonesia19 Poland18 Scotland15 Switzerland14 St. Lucia13 Bangladesh12 Laos12 Ireland12 Kenya12 Bosnia and Herzegovina11 Singapore9 Japan9 United Arab Emirates7 Australia7 Moldova
Grandparents responsible for own grandchildren in Aspen Hill
Grandparents (30 to 59 years) White / Caucasian 96 100.0% Not responsible for grandchildrenBlack or African American 2 100.0% Not responsible for grandchildrenAsian 11 33.5% Responsible for grandchildren22 66.5% Not responsible for grandchildrenOther race 7 2.1% Responsible for grandchildren332 97.9% Not responsible for grandchildrenTwo or more races 10 100.0% Responsible for grandchildrenWhite alone, not Hispanic / Latino 96 100.0% Not responsible for grandchildrenHispanic or Latino 29 8.0% Responsible for grandchildren331 92.0% Not responsible for grandchildrenGrandparents (60 years and over) White / Caucasian 29 6.8% Responsible for grandchildren398 93.2% Not responsible for grandchildrenBlack or African American 38 81.3% Responsible for grandchildren9 18.7% Not responsible for grandchildrenAsian 57 30.2% Responsible for grandchildren133 69.8% Not responsible for grandchildrenOther race 52 100.0% Not responsible for grandchildrenTwo or more races 31 36.2% Responsible for grandchildren54 63.8% Not responsible for grandchildrenWhite alone, not Hispanic / Latino 2 0.4% Responsible for grandchildren496 99.6% Not responsible for grandchildrenHispanic or Latino 45 41.6% Responsible for grandchildren64 58.4% Not responsible for grandchildren