Races in Ashland, New Jersey (NJ) Detailed Stats
Data:
Races - White alone (%)
Races - White alone (% change since 2000)
Races - Black alone (%)
Races - Black alone (% change since 2000)
Races - American Indian alone (%)
Races - American Indian alone (% change since 2000)
Races - Asian alone (%)
Races - Asian alone (% change since 2000)
Races - Hispanic (%)
Races - Hispanic (% change since 2000)
Races - Native Hawaiian and Other Pacific Islander alone (%)
Races - Native Hawaiian and Other Pacific Islander alone (% change since 2000)
Races - Two or more races(%)
Races - Two or more races(% change since 2000)
Races - Other race alone (%)
Races - Other race alone (% change since 2000)
Racial diversity
Place of birth - Born in state of residence (%)
Place of birth - Born in state of residence (%) - White
Place of birth - Born in state of residence (%) - Black or African American
Place of birth - Born in state of residence (%) - Asian
Place of birth - Born in state of residence (%) - Hispanic or Latino
Place of birth - Born in state of residence (%) - American Indian and Alaska Native
Place of birth - Born in state of residence (%) - Multirace
Place of birth - Born in state of residence (%) - Other Race
Place of birth - Born in other state (%)
Place of birth - Born in other state (%) - White
Place of birth - Born in other state (%) - Black or African American
Place of birth - Born in other state (%) - Asian
Place of birth - Born in other state (%) - Hispanic or Latino
Place of birth - Born in other state (%) - American Indian and Alaska Native
Place of birth - Born in other state (%) - Multirace
Place of birth - Born in other state (%) - Other Race
Place of birth - Native, outside of US (%)
Place of birth - Native, outside of US (%) - White
Place of birth - Native, outside of US (%) - Black or African American
Place of birth - Native, outside of US (%) - Asian
Place of birth - Native, outside of US (%) - Hispanic or Latino
Place of birth - Native, outside of US (%) - American Indian and Alaska Native
Place of birth - Native, outside of US (%) - Multirace
Place of birth - Native, outside of US (%) - Other Race
Place of birth - Foreign born (%)
Place of birth - Foreign born (%) - White
Place of birth - Foreign born (%) - Black or African American
Place of birth - Foreign born (%) - Asian
Place of birth - Foreign born (%) - Hispanic or Latino
Place of birth - Foreign born (%) - American Indian and Alaska Native
Place of birth - Foreign born (%) - Multirace
Place of birth - Foreign born (%) - Other Race
Residents speaking English at home (%)
Residents speaking English at home - Born in the United States (%)
Residents speaking English at home - Native, born elsewhere (%)
Residents speaking English at home - Foreign born (%)
Residents speaking Spanish at home (%)
Residents speaking Spanish at home - Born in the United States (%)
Residents speaking Spanish at home - Native, born elsewhere (%)
Residents speaking Spanish at home - Foreign born (%)
Residents speaking other language at home (%)
Residents speaking other language at home - Born in the United States (%)
Residents speaking other language at home - Native, born elsewhere (%)
Residents speaking other language at home - Foreign born (%)
Marital status - Never married (%)
Marital status - Now married (%)
Marital status - Separated (%)
Marital status - Widowed (%)
Marital status - Divorced (%)
Ancestries Reported - Arab (%)
Ancestries Reported - Czech (%)
Ancestries Reported - Danish (%)
Ancestries Reported - Dutch (%)
Ancestries Reported - English (%)
Ancestries Reported - French (%)
Ancestries Reported - French Canadian (%)
Ancestries Reported - German (%)
Ancestries Reported - Greek (%)
Ancestries Reported - Hungarian (%)
Ancestries Reported - Irish (%)
Ancestries Reported - Italian (%)
Ancestries Reported - Lithuanian (%)
Ancestries Reported - Norwegian (%)
Ancestries Reported - Polish (%)
Ancestries Reported - Portuguese (%)
Ancestries Reported - Russian (%)
Ancestries Reported - Scotch-Irish (%)
Ancestries Reported - Scottish (%)
Ancestries Reported - Slovak (%)
Ancestries Reported - Subsaharan African (%)
Ancestries Reported - Swedish (%)
Ancestries Reported - Swiss (%)
Ancestries Reported - Ukrainian (%)
Ancestries Reported - United States (%)
Ancestries Reported - Welsh (%)
Ancestries Reported - West Indian (%)
Ancestries Reported - Other (%)
Geographical mobility - Same house 1 year ago (%)
Geographical mobility - Same house 1 year ago (%) - White
Geographical mobility - Same house 1 year ago (%) - Black or African American
Geographical mobility - Same house 1 year ago (%) - Asian
Geographical mobility - Same house 1 year ago (%) - Hispanic or Latino
Geographical mobility - Same house 1 year ago (%) - American Indian and Alaska Native
Geographical mobility - Same house 1 year ago (%) - Multirace
Geographical mobility - Same house 1 year ago (%) - Other Race
Geographical mobility - Moved within same county (%)
Geographical mobility - Moved within same county (%) - White
Geographical mobility - Moved within same county (%) - Black or African American
Geographical mobility - Moved within same county (%) - Asian
Geographical mobility - Moved within same county (%) - Hispanic or Latino
Geographical mobility - Moved within same county (%) - American Indian and Alaska Native
Geographical mobility - Moved within same county (%) - Multirace
Geographical mobility - Moved within same county (%) - Other Race
Geographical mobility - Moved from different county within same state (%)
Geographical mobility - Moved from different county within same state (%) - White
Geographical mobility - Moved from different county within same state (%) - Black or African American
Geographical mobility - Moved from different county within same state (%) - Asian
Geographical mobility - Moved from different county within same state (%) - Hispanic or Latino
Geographical mobility - Moved from different county within same state (%) - American Indian and Alaska Native
Geographical mobility - Moved from different county within same state (%) - Multirace
Geographical mobility - Moved from different county within same state (%) - Other Race
Geographical mobility - Moved from different state (%)
Geographical mobility - Moved from different state (%) - White
Geographical mobility - Moved from different state (%) - Black or African American
Geographical mobility - Moved from different state (%) - Asian
Geographical mobility - Moved from different state (%) - Hispanic or Latino
Geographical mobility - Moved from different state (%) - American Indian and Alaska Native
Geographical mobility - Moved from different state (%) - Multirace
Geographical mobility - Moved from different state (%) - Other Race
Geographical mobility - Moved from abroad (%)
Geographical mobility - Moved from abroad (%) - White
Geographical mobility - Moved from abroad (%) - Black or African American
Geographical mobility - Moved from abroad (%) - Asian
Geographical mobility - Moved from abroad (%) - Hispanic or Latino
Geographical mobility - Moved from abroad (%) - American Indian and Alaska Native
Geographical mobility - Moved from abroad (%) - Multirace
Geographical mobility - Moved from abroad (%) - Other Race
Place of birth for the foreign-born population - Ireland (%)
Place of birth for the foreign-born population - Denmark (%)
Place of birth for the foreign-born population - Norway (%)
Place of birth for the foreign-born population - Sweden (%)
Place of birth for the foreign-born population - United Kingdom (%)
Place of birth for the foreign-born population - England (%)
Place of birth for the foreign-born population - Scotland (%)
Place of birth for the foreign-born population - Other Northern Europe (%)
Place of birth for the foreign-born population - Austria (%)
Place of birth for the foreign-born population - Belgium (%)
Place of birth for the foreign-born population - France (%)
Place of birth for the foreign-born population - Germany (%)
Place of birth for the foreign-born population - Netherlands (%)
Place of birth for the foreign-born population - Switzerland (%)
Place of birth for the foreign-born population - Other Western Europe (%)
Place of birth for the foreign-born population - Greece (%)
Place of birth for the foreign-born population - Italy (%)
Place of birth for the foreign-born population - Portugal (%)
Place of birth for the foreign-born population - Spain (%)
Place of birth for the foreign-born population - Other Southern Europe (%)
Place of birth for the foreign-born population - Albania (%)
Place of birth for the foreign-born population - Belarus (%)
Place of birth for the foreign-born population - Bosnia and Herzegovina (%)
Place of birth for the foreign-born population - Bulgaria (%)
Place of birth for the foreign-born population - Croatia (%)
Place of birth for the foreign-born population - Czechoslovakia (%)
Place of birth for the foreign-born population - Hungary (%)
Place of birth for the foreign-born population - Latvia (%)
Place of birth for the foreign-born population - Lithuania (%)
Place of birth for the foreign-born population - North Macedonia (Macedonia) (%)
Place of birth for the foreign-born population - Moldova (%)
Place of birth for the foreign-born population - Poland (%)
Place of birth for the foreign-born population - Romania (%)
Place of birth for the foreign-born population - Russia (%)
Place of birth for the foreign-born population - Serbia (%)
Place of birth for the foreign-born population - Ukraine (%)
Place of birth for the foreign-born population - Other Eastern Europe (%)
Place of birth for the foreign-born population - China (%)
Place of birth for the foreign-born population - Hong Kong (%)
Place of birth for the foreign-born population - Taiwan (%)
Place of birth for the foreign-born population - Japan (%)
Place of birth for the foreign-born population - Korea (%)
Place of birth for the foreign-born population - Other Eastern Asia (%)
Place of birth for the foreign-born population - Afghanistan (%)
Place of birth for the foreign-born population - Bangladesh (%)
Place of birth for the foreign-born population - India (%)
Place of birth for the foreign-born population - Iran (%)
Place of birth for the foreign-born population - Kazakhstan (%)
Place of birth for the foreign-born population - Nepal (%)
Place of birth for the foreign-born population - Pakistan (%)
Place of birth for the foreign-born population - Sri Lanka (%)
Place of birth for the foreign-born population - Uzbekistan (%)
Place of birth for the foreign-born population - Other South Central Asia (%)
Place of birth for the foreign-born population - Burma (%)
Place of birth for the foreign-born population - Cambodia (%)
Place of birth for the foreign-born population - Indonesia (%)
Place of birth for the foreign-born population - Laos (%)
Place of birth for the foreign-born population - Malaysia (%)
Place of birth for the foreign-born population - Philippines (%)
Place of birth for the foreign-born population - Singapore (%)
Place of birth for the foreign-born population - Thailand (%)
Place of birth for the foreign-born population - Vietnam (%)
Place of birth for the foreign-born population - Other South Eastern Asia (%)
Place of birth for the foreign-born population - Armenia (%)
Place of birth for the foreign-born population - Iraq (%)
Place of birth for the foreign-born population - Israel (%)
Place of birth for the foreign-born population - Jordan (%)
Place of birth for the foreign-born population - Kuwait (%)
Place of birth for the foreign-born population - Lebanon (%)
Place of birth for the foreign-born population - Saudi Arabia (%)
Place of birth for the foreign-born population - Syria (%)
Place of birth for the foreign-born population - Turkey (%)
Place of birth for the foreign-born population - Yemen (%)
Place of birth for the foreign-born population - Other Western Asia (%)
Place of birth for the foreign-born population - Eritrea (%)
Place of birth for the foreign-born population - Ethiopia (%)
Place of birth for the foreign-born population - Kenya (%)
Place of birth for the foreign-born population - Somalia (%)
Place of birth for the foreign-born population - Uganda (%)
Place of birth for the foreign-born population - Zimbabwe (%)
Place of birth for the foreign-born population - Other Eastern Africa (%)
Place of birth for the foreign-born population - Cameroon (%)
Place of birth for the foreign-born population - Congo (%)
Place of birth for the foreign-born population - Democratic Republic of Congo (Zaire) (%)
Place of birth for the foreign-born population - Other Middle Africa (%)
Place of birth for the foreign-born population - Egypt (%)
Place of birth for the foreign-born population - Morocco (%)
Place of birth for the foreign-born population - Sudan (%)
Place of birth for the foreign-born population - Other Northern Africa (%)
Place of birth for the foreign-born population - South Africa (%)
Place of birth for the foreign-born population - Other Southern Africa (%)
Place of birth for the foreign-born population - Cabo Verde (%)
Place of birth for the foreign-born population - Ghana (%)
Place of birth for the foreign-born population - Liberia (%)
Place of birth for the foreign-born population - Nigeria (%)
Place of birth for the foreign-born population - Senegal (%)
Place of birth for the foreign-born population - Sierra Leone (%)
Place of birth for the foreign-born population - Other Western Africa (%)
Place of birth for the foreign-born population - Australia (%)
Place of birth for the foreign-born population - New Zealand (%)
Place of birth for the foreign-born population - Fiji (%)
Place of birth for the foreign-born population - Micronesia (%)
Place of birth for the foreign-born population - Bahamas (%)
Place of birth for the foreign-born population - Barbados (%)
Place of birth for the foreign-born population - Cuba (%)
Place of birth for the foreign-born population - Dominica (%)
Place of birth for the foreign-born population - Dominican Republic (%)
Place of birth for the foreign-born population - Grenada (%)
Place of birth for the foreign-born population - Haiti (%)
Place of birth for the foreign-born population - Jamaica (%)
Place of birth for the foreign-born population - St. Vincent and the Grenadines (%)
Place of birth for the foreign-born population - Trinidad and Tobago (%)
Place of birth for the foreign-born population - West Indies (%)
Place of birth for the foreign-born population - Other Caribbean (%)
Place of birth for the foreign-born population - Belize (%)
Place of birth for the foreign-born population - Costa Rica (%)
Place of birth for the foreign-born population - El Salvador (%)
Place of birth for the foreign-born population - Guatemala (%)
Place of birth for the foreign-born population - Honduras (%)
Place of birth for the foreign-born population - Mexico (%)
Place of birth for the foreign-born population - Nicaragua (%)
Place of birth for the foreign-born population - Panama (%)
Place of birth for the foreign-born population - Other Central America (%)
Place of birth for the foreign-born population - Argentina (%)
Place of birth for the foreign-born population - Bolivia (%)
Place of birth for the foreign-born population - Brazil (%)
Place of birth for the foreign-born population - Chile (%)
Place of birth for the foreign-born population - Colombia (%)
Place of birth for the foreign-born population - Ecuador (%)
Place of birth for the foreign-born population - Guyana (%)
Place of birth for the foreign-born population - Peru (%)
Place of birth for the foreign-born population - Uruguay (%)
Place of birth for the foreign-born population - Venezuela (%)
Place of birth for the foreign-born population - Other South America (%)
Place of birth for the foreign-born population - Canada (%)
Place of birth for the foreign-born population - Other Northern America (%)
Place of birth for the foreign-born population - Other (%)
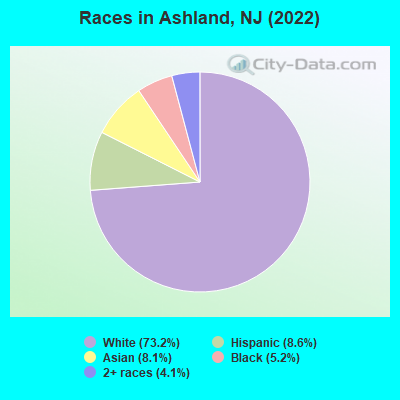
According to 2022 data, the most numerous races in Ashland, NJ are White alone (6,896 residents), Hispanic (806 residents), and Black alone (487 residents). 84.9% of Ashland residents speak English at home. 11.7% of Ashland, NJ residents are foreign-born (6.7% born in Asia, 2.5% born in Europe, 1.8% born in Latin America), which is 97.1% less than the foreign-born rate of 23.0% across the entire state of New Jersey.
Race distribution in Ashland
2000 2022
5,557,209 66.0% White alone 1,117,191 13.3% Hispanic 1,096,171 13.0% Black alone 477,012 5.7% Asian alone 133,689 1.6% Two or more races 19,565 0.2% Other race alone 11,338 0.1% American Indian alone 2,175 0.03% Native Hawaiian and Other
4,766,476 51.5% White alone 2,028,470 21.9% Hispanic 1,111,632 12.0% Black alone 923,546 10.0% Asian alone 332,237 3.6% Two or more races 89,847 1.0% Other race alone 8,557 0.09% American Indian alone 934 0.01% Native Hawaiian and Other
Income and house value in Ashland Median household income in 2022 $111,119 White non-Hispanic householders$98,736 Asian householdersover $200,000 Some other race householders$165,401 Two or more races householdersover $200,000 Hispanic or Latino race householdersMedian 2022 house value $319,807 White Non-Hispanic householders$340,649 Black or African American householders $317,651 Asian householders$203,622 Some other race householders$203,622 Two or more races householders$324,838 Hispanic or Latino householders
Median age by race in Ashland
51.9 Median age for White residents51.0 53.1 26.8 Median age for Black or African American residents11.5 41.3 -676,272,813.9 Median age for American Indian / Alaska Native residents-670,465,336.5 -688,298,917.7 54.0 Median age for Asian residents46.5 55.2 -701,509,871.5 Median age for Native Hawaiian / Pacific Islander residents-860,335,194.7 -668,881,505.4 27.2 Median age for Other race residents28.4 17.5 50.8 Median age for Two or more races residents48.2 52.1 52.6 Median age for White alone residents51.9 55.4 22.7 Median age for Hispanic or Latino residents14.6 36.5
Owner/renter occupied households by race in Ashland
House owners and renters - White residents 2,861 92.5% Owner occupied233 7.5% Renter occupiedHouse owners and renters - Black or African American residents 74 54.5% Owner occupied62 45.5% Renter occupiedHouse owners and renters - Asian residents 292 93.3% Owner occupied21 6.7% Renter occupiedHouse owners and renters - Other race residents 56 92.4% Owner occupied5 7.6% Renter occupiedHouse owners and renters - Two or more races residents 125 100.0% Owner occupiedHouse owners and renters - White alone residents 2,835 91.9% Owner occupied248 8.1% Renter occupiedHouse owners and renters - Hispanic or Latino residents 146 97.3% Owner occupied4 2.7% Renter occupied
Language usage in Ashland
English speakers - Total 84.9% of residents of Ashland speak English at home.
3.4% of residents speak Spanish at home 208 68.0% Speak English very well98 32.0% Speak English less than very well10.1% of residents speak other language at home 523 58.2% Speak English very well375 41.8% Speak English less than very well
English speakers - Born in the United States 96.2% of residents of Ashland speak English at home.
0.6% of residents speak Spanish at home 17 81.0% Speak English very well4 19.0% Speak English less than very well4.0% of residents speak other language at home 108 75.0% Speak English very well36 25.0% Speak English less than very well
English speakers - Native, born elsewhere 42.2% of residents of Ashland speak English at home.
59.5% of residents speak Spanish at home 52 75.4% Speak English very well17 24.6% Speak English less than very well
English speakers - Foreign-born 18.8% of residents of Ashland speak English at home.
9.9% of residents speak Spanish at home 56 50.5% Speak English very well55 49.5% Speak English less than very well60.7% of residents speak other language at home 341 49.9% Speak English very well343 50.1% Speak English less than very well
White (Caucasian) - Speak only English Native:
96.7% (6,264)Foreign-born:
23.0% (59)
White (Caucasian) - Speak another language Native:
3.4% (223)Foreign-born:
77.2% (199)
Black or African American - Speak only English Native:
97.6% (484)Foreign-born:
100.0% (33)
Asian - Speak only English Native:
81.0% (160)Foreign-born:
9.9% (55)
Asian - Speak another language Native:
26.1% (51)Foreign-born:
90.0% (498)
Other race - Speak only English Native:
13.5% (11)Foreign-born:
81.4% (63)
Other race - Speak another language Native:
84.5% (68)Foreign-born:
20.9% (16)
Two or more races - Speak another language Native:
7.6% (27)Foreign-born:
100.0% (81)
White alone - Speak only English Native:
96.9% (6,084)Foreign-born:
24.6% (62)
White alone - Speak another language Native:
3.0% (191)Foreign-born:
76.1% (191)
Hispanic or Latino - Speak only English Native:
63.7% (339)Foreign-born:
25.2% (51)
Hispanic or Latino - Speak another language Native:
35.4% (188)Foreign-born:
67.0% (135)
Foreign-born residents in Ashland 1,100 residents are foreign born (6.7% Asia , 2.5% Europe , 1.8% Latin America ).
This city:
11.7%New Jersey:
23.2%
Marital status for residents in Ashland Marital status - White (Caucasian) population 15 years and over
Males 24.1% Never married68.7% Now married1.4% Separated2.2% Widowed3.6% DivorcedFemales 21.2% Never married59.6% Now married0.2% Separated11.0% Widowed8.1% DivorcedWomen who gave birth in the past 12 months Now married:
79.0% (91)Unmarried:
21.0% (24)
Women who did not give birth in the past 12 months Now married:
53.9% (634)Unmarried:
46.1% (543)
Marital status - Black or African American population 15 years and over
Males 37.9% Never married50.0% Now married0.0% Separated6.9% Widowed5.2% DivorcedFemales 36.6% Never married1.7% Now married0.0% Separated27.7% Widowed34.0% DivorcedWomen who did not give birth in the past 12 months Now married:
0.0% (0)Unmarried:
100.0% (92)
Marital status - Asian population 15 years and over
Males 32.8% Never married67.2% Now married0.0% Separated0.0% Widowed0.0% DivorcedFemales 27.8% Never married64.3% Now married0.0% Separated3.2% Widowed4.7% DivorcedWomen who did not give birth in the past 12 months Now married:
50.3% (99)Unmarried:
49.7% (98)
Marital status - Other race population 15 years and over
Males 0.0% Never married90.0% Now married0.0% Separated0.0% Widowed10.0% DivorcedFemales 31.0% Never married69.0% Now married0.0% Separated0.0% Widowed0.0% DivorcedWomen who did not give birth in the past 12 months Now married:
65.4% (19)Unmarried:
34.6% (10)
Marital status - Two or more races population 15 years and over
Males 6.8% Never married76.9% Now married0.0% Separated0.0% Widowed16.3% DivorcedFemales 19.0% Never married61.0% Now married0.0% Separated0.0% Widowed20.0% DivorcedWomen who did not give birth in the past 12 months Now married:
53.5% (31)Unmarried:
46.5% (27)
Marital status - White alone, not Hispanic / Latino population 15 years and over
Males 23.3% Never married69.8% Now married1.4% Separated2.2% Widowed3.3% DivorcedFemales 19.2% Never married60.9% Now married0.0% Separated11.5% Widowed8.4% DivorcedWomen who gave birth in the past 12 months Now married:
79.0% (95)Unmarried:
21.0% (25)
Women who did not give birth in the past 12 months Now married:
56.4% (570)Unmarried:
43.6% (440)
Marital status - Hispanic or Latino population 15 years and over
Males 28.6% Never married60.8% Now married0.0% Separated0.0% Widowed10.6% DivorcedFemales 40.5% Never married51.3% Now married2.2% Separated1.9% Widowed4.1% DivorcedWomen who did not give birth in the past 12 months Now married:
46.2% (120)Unmarried:
53.8% (140)
Ancestries in Ashland
605 15.1% Italian402 10.0% Irish266 6.6% American197 4.9% Russian197 4.9% Scandinavian173 4.3% German125 3.1% English98 2.4% Greek81 2.0% Polish64 1.6% Turkish48 1.2% British48 1.2% Ukrainian39 1.0% European32 0.8% Lithuanian29 0.7% Eastern European27 0.7% Jamaican23 0.6% Croatian19 0.5% Estonian12 0.3% Armenian12 0.3% Dutch12 0.3% Scotch-Irish10 0.2% Albanian10 0.2% Liberian9 0.2% Czechoslovakian9 0.2% Danish9 0.2% Scottish9 0.2% Swedish7 0.2% Northern European6 0.1% Israeli
Children Nativity (place of birth) in Ashland
Children under 6 years - Living with two parents Both parents native 361 100.0% NativeBoth parents foreign-born 131 100.0% NativeOne native, one foreign-born parent 31 100.0% NativeChildren under 6 years - Living with one parent Native parent 90 100.0% NativeChildren 6 to 17 years - Living with two parents Both parents native 502 98.9% Native5 1.1% Foreign-bornBoth parents foreign-born 145 100.0% NativeOne native, one foreign-born parent 99 100.0% NativeChildren 6 to 17 years - Living with one parent Native parent 228 100.0% NativeForeign-born parent 26 51.5% Native24 48.5% Foreign-born
Grandparents responsible for own grandchildren in Ashland
Grandparents (30 to 59 years) White / Caucasian 42 100.0% Not responsible for grandchildrenWhite alone, not Hispanic / Latino 40 100.0% Not responsible for grandchildrenGrandparents (60 years and over) White / Caucasian 12 16.9% Responsible for grandchildren60 83.1% Not responsible for grandchildrenWhite alone, not Hispanic / Latino 13 15.6% Responsible for grandchildren70 84.4% Not responsible for grandchildren