Races in Asheboro, North Carolina (NC) Detailed Stats
Data:
Races - White alone (%)
Races - White alone (% change since 2000)
Races - Black alone (%)
Races - Black alone (% change since 2000)
Races - American Indian alone (%)
Races - American Indian alone (% change since 2000)
Races - Asian alone (%)
Races - Asian alone (% change since 2000)
Races - Hispanic (%)
Races - Hispanic (% change since 2000)
Races - Native Hawaiian and Other Pacific Islander alone (%)
Races - Native Hawaiian and Other Pacific Islander alone (% change since 2000)
Races - Two or more races(%)
Races - Two or more races(% change since 2000)
Races - Other race alone (%)
Races - Other race alone (% change since 2000)
Racial diversity
Place of birth - Born in state of residence (%)
Place of birth - Born in state of residence (%) - White
Place of birth - Born in state of residence (%) - Black or African American
Place of birth - Born in state of residence (%) - Asian
Place of birth - Born in state of residence (%) - Hispanic or Latino
Place of birth - Born in state of residence (%) - American Indian and Alaska Native
Place of birth - Born in state of residence (%) - Multirace
Place of birth - Born in state of residence (%) - Other Race
Place of birth - Born in other state (%)
Place of birth - Born in other state (%) - White
Place of birth - Born in other state (%) - Black or African American
Place of birth - Born in other state (%) - Asian
Place of birth - Born in other state (%) - Hispanic or Latino
Place of birth - Born in other state (%) - American Indian and Alaska Native
Place of birth - Born in other state (%) - Multirace
Place of birth - Born in other state (%) - Other Race
Place of birth - Native, outside of US (%)
Place of birth - Native, outside of US (%) - White
Place of birth - Native, outside of US (%) - Black or African American
Place of birth - Native, outside of US (%) - Asian
Place of birth - Native, outside of US (%) - Hispanic or Latino
Place of birth - Native, outside of US (%) - American Indian and Alaska Native
Place of birth - Native, outside of US (%) - Multirace
Place of birth - Native, outside of US (%) - Other Race
Place of birth - Foreign born (%)
Place of birth - Foreign born (%) - White
Place of birth - Foreign born (%) - Black or African American
Place of birth - Foreign born (%) - Asian
Place of birth - Foreign born (%) - Hispanic or Latino
Place of birth - Foreign born (%) - American Indian and Alaska Native
Place of birth - Foreign born (%) - Multirace
Place of birth - Foreign born (%) - Other Race
Residents speaking English at home (%)
Residents speaking English at home - Born in the United States (%)
Residents speaking English at home - Native, born elsewhere (%)
Residents speaking English at home - Foreign born (%)
Residents speaking Spanish at home (%)
Residents speaking Spanish at home - Born in the United States (%)
Residents speaking Spanish at home - Native, born elsewhere (%)
Residents speaking Spanish at home - Foreign born (%)
Residents speaking other language at home (%)
Residents speaking other language at home - Born in the United States (%)
Residents speaking other language at home - Native, born elsewhere (%)
Residents speaking other language at home - Foreign born (%)
Marital status - Never married (%)
Marital status - Now married (%)
Marital status - Separated (%)
Marital status - Widowed (%)
Marital status - Divorced (%)
Ancestries Reported - Arab (%)
Ancestries Reported - Czech (%)
Ancestries Reported - Danish (%)
Ancestries Reported - Dutch (%)
Ancestries Reported - English (%)
Ancestries Reported - French (%)
Ancestries Reported - French Canadian (%)
Ancestries Reported - German (%)
Ancestries Reported - Greek (%)
Ancestries Reported - Hungarian (%)
Ancestries Reported - Irish (%)
Ancestries Reported - Italian (%)
Ancestries Reported - Lithuanian (%)
Ancestries Reported - Norwegian (%)
Ancestries Reported - Polish (%)
Ancestries Reported - Portuguese (%)
Ancestries Reported - Russian (%)
Ancestries Reported - Scotch-Irish (%)
Ancestries Reported - Scottish (%)
Ancestries Reported - Slovak (%)
Ancestries Reported - Subsaharan African (%)
Ancestries Reported - Swedish (%)
Ancestries Reported - Swiss (%)
Ancestries Reported - Ukrainian (%)
Ancestries Reported - United States (%)
Ancestries Reported - Welsh (%)
Ancestries Reported - West Indian (%)
Ancestries Reported - Other (%)
Geographical mobility - Same house 1 year ago (%)
Geographical mobility - Same house 1 year ago (%) - White
Geographical mobility - Same house 1 year ago (%) - Black or African American
Geographical mobility - Same house 1 year ago (%) - Asian
Geographical mobility - Same house 1 year ago (%) - Hispanic or Latino
Geographical mobility - Same house 1 year ago (%) - American Indian and Alaska Native
Geographical mobility - Same house 1 year ago (%) - Multirace
Geographical mobility - Same house 1 year ago (%) - Other Race
Geographical mobility - Moved within same county (%)
Geographical mobility - Moved within same county (%) - White
Geographical mobility - Moved within same county (%) - Black or African American
Geographical mobility - Moved within same county (%) - Asian
Geographical mobility - Moved within same county (%) - Hispanic or Latino
Geographical mobility - Moved within same county (%) - American Indian and Alaska Native
Geographical mobility - Moved within same county (%) - Multirace
Geographical mobility - Moved within same county (%) - Other Race
Geographical mobility - Moved from different county within same state (%)
Geographical mobility - Moved from different county within same state (%) - White
Geographical mobility - Moved from different county within same state (%) - Black or African American
Geographical mobility - Moved from different county within same state (%) - Asian
Geographical mobility - Moved from different county within same state (%) - Hispanic or Latino
Geographical mobility - Moved from different county within same state (%) - American Indian and Alaska Native
Geographical mobility - Moved from different county within same state (%) - Multirace
Geographical mobility - Moved from different county within same state (%) - Other Race
Geographical mobility - Moved from different state (%)
Geographical mobility - Moved from different state (%) - White
Geographical mobility - Moved from different state (%) - Black or African American
Geographical mobility - Moved from different state (%) - Asian
Geographical mobility - Moved from different state (%) - Hispanic or Latino
Geographical mobility - Moved from different state (%) - American Indian and Alaska Native
Geographical mobility - Moved from different state (%) - Multirace
Geographical mobility - Moved from different state (%) - Other Race
Geographical mobility - Moved from abroad (%)
Geographical mobility - Moved from abroad (%) - White
Geographical mobility - Moved from abroad (%) - Black or African American
Geographical mobility - Moved from abroad (%) - Asian
Geographical mobility - Moved from abroad (%) - Hispanic or Latino
Geographical mobility - Moved from abroad (%) - American Indian and Alaska Native
Geographical mobility - Moved from abroad (%) - Multirace
Geographical mobility - Moved from abroad (%) - Other Race
Place of birth for the foreign-born population - Ireland (%)
Place of birth for the foreign-born population - Denmark (%)
Place of birth for the foreign-born population - Norway (%)
Place of birth for the foreign-born population - Sweden (%)
Place of birth for the foreign-born population - United Kingdom (%)
Place of birth for the foreign-born population - England (%)
Place of birth for the foreign-born population - Scotland (%)
Place of birth for the foreign-born population - Other Northern Europe (%)
Place of birth for the foreign-born population - Austria (%)
Place of birth for the foreign-born population - Belgium (%)
Place of birth for the foreign-born population - France (%)
Place of birth for the foreign-born population - Germany (%)
Place of birth for the foreign-born population - Netherlands (%)
Place of birth for the foreign-born population - Switzerland (%)
Place of birth for the foreign-born population - Other Western Europe (%)
Place of birth for the foreign-born population - Greece (%)
Place of birth for the foreign-born population - Italy (%)
Place of birth for the foreign-born population - Portugal (%)
Place of birth for the foreign-born population - Spain (%)
Place of birth for the foreign-born population - Other Southern Europe (%)
Place of birth for the foreign-born population - Albania (%)
Place of birth for the foreign-born population - Belarus (%)
Place of birth for the foreign-born population - Bosnia and Herzegovina (%)
Place of birth for the foreign-born population - Bulgaria (%)
Place of birth for the foreign-born population - Croatia (%)
Place of birth for the foreign-born population - Czechoslovakia (%)
Place of birth for the foreign-born population - Hungary (%)
Place of birth for the foreign-born population - Latvia (%)
Place of birth for the foreign-born population - Lithuania (%)
Place of birth for the foreign-born population - North Macedonia (Macedonia) (%)
Place of birth for the foreign-born population - Moldova (%)
Place of birth for the foreign-born population - Poland (%)
Place of birth for the foreign-born population - Romania (%)
Place of birth for the foreign-born population - Russia (%)
Place of birth for the foreign-born population - Serbia (%)
Place of birth for the foreign-born population - Ukraine (%)
Place of birth for the foreign-born population - Other Eastern Europe (%)
Place of birth for the foreign-born population - China (%)
Place of birth for the foreign-born population - Hong Kong (%)
Place of birth for the foreign-born population - Taiwan (%)
Place of birth for the foreign-born population - Japan (%)
Place of birth for the foreign-born population - Korea (%)
Place of birth for the foreign-born population - Other Eastern Asia (%)
Place of birth for the foreign-born population - Afghanistan (%)
Place of birth for the foreign-born population - Bangladesh (%)
Place of birth for the foreign-born population - India (%)
Place of birth for the foreign-born population - Iran (%)
Place of birth for the foreign-born population - Kazakhstan (%)
Place of birth for the foreign-born population - Nepal (%)
Place of birth for the foreign-born population - Pakistan (%)
Place of birth for the foreign-born population - Sri Lanka (%)
Place of birth for the foreign-born population - Uzbekistan (%)
Place of birth for the foreign-born population - Other South Central Asia (%)
Place of birth for the foreign-born population - Burma (%)
Place of birth for the foreign-born population - Cambodia (%)
Place of birth for the foreign-born population - Indonesia (%)
Place of birth for the foreign-born population - Laos (%)
Place of birth for the foreign-born population - Malaysia (%)
Place of birth for the foreign-born population - Philippines (%)
Place of birth for the foreign-born population - Singapore (%)
Place of birth for the foreign-born population - Thailand (%)
Place of birth for the foreign-born population - Vietnam (%)
Place of birth for the foreign-born population - Other South Eastern Asia (%)
Place of birth for the foreign-born population - Armenia (%)
Place of birth for the foreign-born population - Iraq (%)
Place of birth for the foreign-born population - Israel (%)
Place of birth for the foreign-born population - Jordan (%)
Place of birth for the foreign-born population - Kuwait (%)
Place of birth for the foreign-born population - Lebanon (%)
Place of birth for the foreign-born population - Saudi Arabia (%)
Place of birth for the foreign-born population - Syria (%)
Place of birth for the foreign-born population - Turkey (%)
Place of birth for the foreign-born population - Yemen (%)
Place of birth for the foreign-born population - Other Western Asia (%)
Place of birth for the foreign-born population - Eritrea (%)
Place of birth for the foreign-born population - Ethiopia (%)
Place of birth for the foreign-born population - Kenya (%)
Place of birth for the foreign-born population - Somalia (%)
Place of birth for the foreign-born population - Uganda (%)
Place of birth for the foreign-born population - Zimbabwe (%)
Place of birth for the foreign-born population - Other Eastern Africa (%)
Place of birth for the foreign-born population - Cameroon (%)
Place of birth for the foreign-born population - Congo (%)
Place of birth for the foreign-born population - Democratic Republic of Congo (Zaire) (%)
Place of birth for the foreign-born population - Other Middle Africa (%)
Place of birth for the foreign-born population - Egypt (%)
Place of birth for the foreign-born population - Morocco (%)
Place of birth for the foreign-born population - Sudan (%)
Place of birth for the foreign-born population - Other Northern Africa (%)
Place of birth for the foreign-born population - South Africa (%)
Place of birth for the foreign-born population - Other Southern Africa (%)
Place of birth for the foreign-born population - Cabo Verde (%)
Place of birth for the foreign-born population - Ghana (%)
Place of birth for the foreign-born population - Liberia (%)
Place of birth for the foreign-born population - Nigeria (%)
Place of birth for the foreign-born population - Senegal (%)
Place of birth for the foreign-born population - Sierra Leone (%)
Place of birth for the foreign-born population - Other Western Africa (%)
Place of birth for the foreign-born population - Australia (%)
Place of birth for the foreign-born population - New Zealand (%)
Place of birth for the foreign-born population - Fiji (%)
Place of birth for the foreign-born population - Micronesia (%)
Place of birth for the foreign-born population - Bahamas (%)
Place of birth for the foreign-born population - Barbados (%)
Place of birth for the foreign-born population - Cuba (%)
Place of birth for the foreign-born population - Dominica (%)
Place of birth for the foreign-born population - Dominican Republic (%)
Place of birth for the foreign-born population - Grenada (%)
Place of birth for the foreign-born population - Haiti (%)
Place of birth for the foreign-born population - Jamaica (%)
Place of birth for the foreign-born population - St. Vincent and the Grenadines (%)
Place of birth for the foreign-born population - Trinidad and Tobago (%)
Place of birth for the foreign-born population - West Indies (%)
Place of birth for the foreign-born population - Other Caribbean (%)
Place of birth for the foreign-born population - Belize (%)
Place of birth for the foreign-born population - Costa Rica (%)
Place of birth for the foreign-born population - El Salvador (%)
Place of birth for the foreign-born population - Guatemala (%)
Place of birth for the foreign-born population - Honduras (%)
Place of birth for the foreign-born population - Mexico (%)
Place of birth for the foreign-born population - Nicaragua (%)
Place of birth for the foreign-born population - Panama (%)
Place of birth for the foreign-born population - Other Central America (%)
Place of birth for the foreign-born population - Argentina (%)
Place of birth for the foreign-born population - Bolivia (%)
Place of birth for the foreign-born population - Brazil (%)
Place of birth for the foreign-born population - Chile (%)
Place of birth for the foreign-born population - Colombia (%)
Place of birth for the foreign-born population - Ecuador (%)
Place of birth for the foreign-born population - Guyana (%)
Place of birth for the foreign-born population - Peru (%)
Place of birth for the foreign-born population - Uruguay (%)
Place of birth for the foreign-born population - Venezuela (%)
Place of birth for the foreign-born population - Other South America (%)
Place of birth for the foreign-born population - Canada (%)
Place of birth for the foreign-born population - Other Northern America (%)
Place of birth for the foreign-born population - Other (%)
Latest news about races in Asheboro, NC collected exclusively by city-data.com from local newspapers, TV, and radio stations
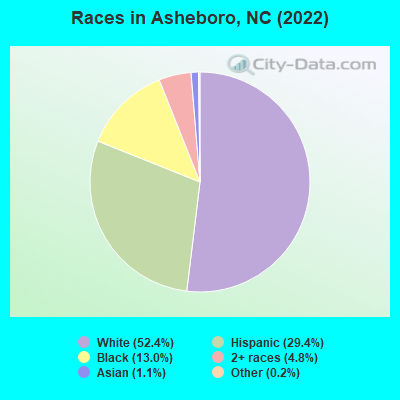
According to 2022 data, the most numerous races in Asheboro, NC are White alone (14,529 residents), Black alone (3,608 residents), and Hispanic (8,146 residents). 70.7% of Asheboro residents speak English at home. 12.8% of Asheboro, NC residents are foreign-born (11.1% born in Latin America), which is 37.6% greater than the foreign-born rate of 8.0% across the entire state of North Carolina.
Race distribution in Asheboro
2000 2022
5,647,155 70.2% White alone 1,723,301 21.4% Black alone 378,963 4.7% Hispanic 112,416 1.4% Asian alone 95,333 1.2% American Indian alone 79,965 1.0% Two or more races 9,015 0.1% Other race alone 3,165 0.04% Native Hawaiian and Other
6,497,519 60.7% White alone 2,155,650 20.1% Black alone 1,114,799 10.4% Hispanic 438,061 4.1% Two or more races 341,052 3.2% Asian alone 91,758 0.9% American Indian alone 50,180 0.5% Other race alone 9,954 0.09% Native Hawaiian and Other
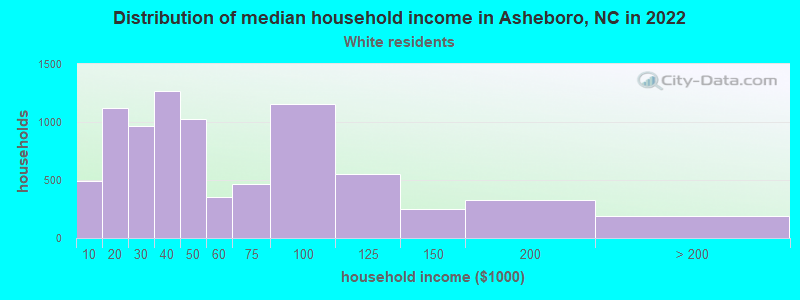
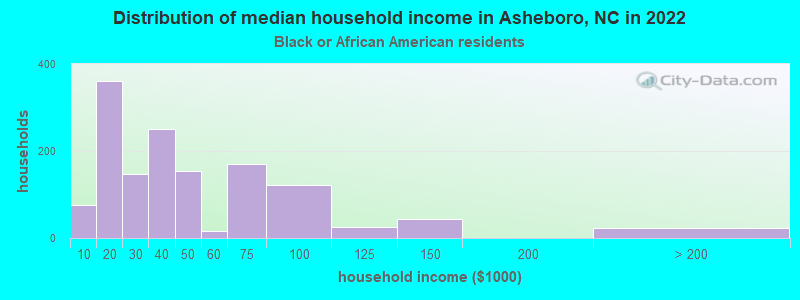
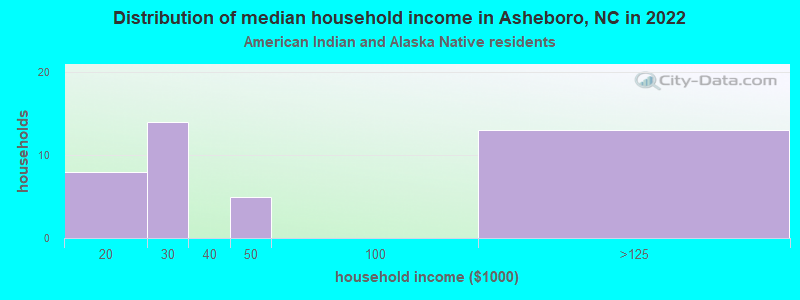
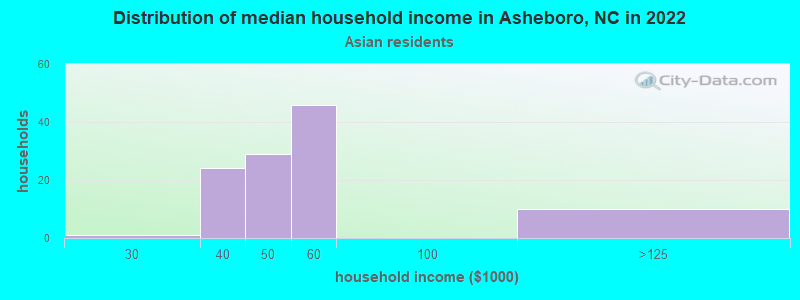
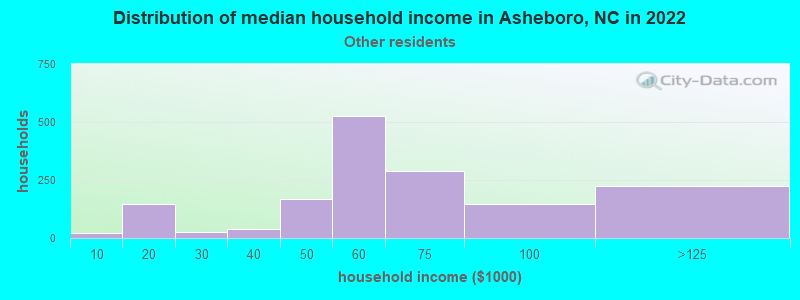
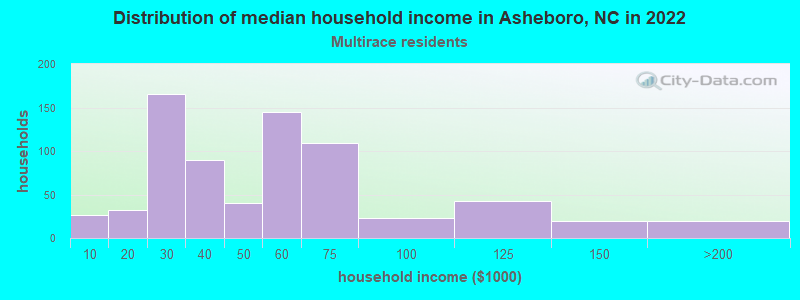
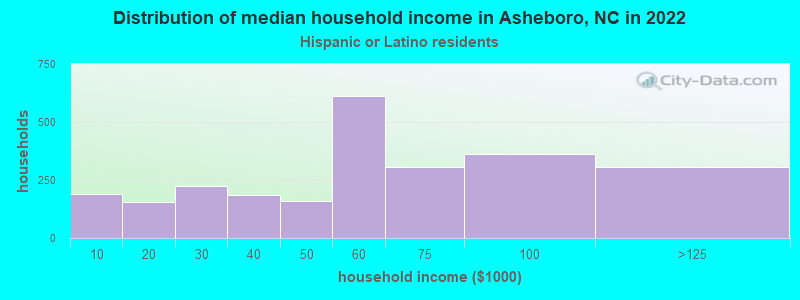
Income and house value in Asheboro Median household income in 2022 $41,028 White non-Hispanic householders$35,211 Black householders$56,108 Asian householders$69,696 Some other race householders$41,091 Two or more races householders$68,068 Hispanic or Latino race householdersMedian 2022 house value $174,838 White Non-Hispanic householders$150,533 Black or African American householders $93,495 Asian householders$107,804 Some other race householders$121,916 Two or more races householders$161,706 Hispanic or Latino householders
Median age by race in Asheboro
43.3 Median age for White residents43.2 43.4 35.1 Median age for Black or African American residents38.7 31.3 26.6 Median age for American Indian / Alaska Native residents66.2 30.2 31.4 Median age for Asian residents2.6 38.0 -609,884,331.7 Median age for Native Hawaiian / Pacific Islander residents-666,666,666.0 -612,403,100.2 23.4 Median age for Other race residents24.7 25.7 29.8 Median age for Two or more races residents27.5 35.3 47.3 Median age for White alone residents44.8 50.1 26.4 Median age for Hispanic or Latino residents27.3 24.8
Owner/renter occupied households by race in Asheboro
House owners and renters - White residents 4,208 52.4% Owner occupied3,821 47.6% Renter occupiedHouse owners and renters - Black or African American residents 500 39.3% Owner occupied771 60.7% Renter occupiedHouse owners and renters - American Indian / Alaska Native residents 13 31.8% Owner occupied28 68.2% Renter occupiedHouse owners and renters - Asian residents 86 72.7% Owner occupied32 27.3% Renter occupiedHouse owners and renters - Native Hawaiian / Pacific Islander residents 28 100.0% Owner occupiedHouse owners and renters - Other race residents 791 55.9% Owner occupied624 44.1% Renter occupiedHouse owners and renters - Two or more races residents 275 37.5% Owner occupied458 62.5% Renter occupiedHouse owners and renters - White alone residents 3,900 52.7% Owner occupied3,495 47.3% Renter occupiedHouse owners and renters - Hispanic or Latino residents 1,151 52.5% Owner occupied1,043 47.5% Renter occupied
Language usage in Asheboro
English speakers - Total 70.7% of residents of Asheboro speak English at home.
27.8% of residents speak Spanish at home 4,728 66.5% Speak English very well2,385 33.5% Speak English less than very well1.9% of residents speak other language at home 281 58.3% Speak English very well201 41.7% Speak English less than very well
English speakers - Born in the United States 84.1% of residents of Asheboro speak English at home.
14.8% of residents speak Spanish at home 894 90.6% Speak English very well93 9.4% Speak English less than very well1.1% of residents speak other language at home 72 100.0% Speak English very well
English speakers - Native, born elsewhere 21.4% of residents of Asheboro speak English at home.
115.0% of residents speak Spanish at home 234 50.0% Speak English very well234 50.0% Speak English less than very well0.5% of residents speak other language at home 2 100.0% Speak English very well
English speakers - Foreign-born 4.8% of residents of Asheboro speak English at home.
86.0% of residents speak Spanish at home 1,194 42.7% Speak English very well1,605 57.3% Speak English less than very well8.7% of residents speak other language at home 119 42.2% Speak English very well163 57.8% Speak English less than very well
White (Caucasian) - Speak only English Native:
89.5% (13,496)Foreign-born:
5.1% (36)
White (Caucasian) - Speak another language Native:
6.5% (981)Foreign-born:
89.8% (630)
Black or African American - Speak another language Native:
5.1% (170)Foreign-born:
99.2% (99)
American Indian / Alaska Native - Speak another language Native:
100.0% (86)Foreign-born:
100.0% (42)
Asian - Speak only English Native:
50.8% (25)Foreign-born:
29.3% (44)
Asian - Speak another language Native:
49.2% (24)Foreign-born:
70.4% (106)
Other race - Speak only English Native:
16.4% (573)Foreign-born:
5.3% (90)
Other race - Speak another language Native:
83.6% (2,917)Foreign-born:
94.5% (1,603)
Two or more races - Speak another language Native:
22.9% (295)Foreign-born:
100.0% (365)
White alone - Speak only English Native:
97.8% (13,441)Foreign-born:
26.5% (45)
White alone - Speak another language Native:
1.9% (258)Foreign-born:
82.8% (139)
Hispanic or Latino - Speak only English Native:
8.6% (401)Foreign-born:
2.1% (59)
Hispanic or Latino - Speak another language Native:
92.1% (4,288)Foreign-born:
98.0% (2,757)
Foreign-born residents in Asheboro 3,515 residents are foreign born (11.1% Latin America ).
This city:
12.8%North Carolina:
8.3%
Marital status for residents in Asheboro Marital status - White (Caucasian) population 15 years and over
Males 30.4% Never married44.8% Now married3.5% Separated5.0% Widowed16.3% DivorcedFemales 26.1% Never married42.0% Now married3.1% Separated14.2% Widowed14.7% DivorcedWomen who gave birth in the past 12 months Now married:
40.1% (105)Unmarried:
59.9% (157)
Women who did not give birth in the past 12 months Now married:
45.6% (1,564)Unmarried:
54.4% (1,863)
Marital status - Black or African American population 15 years and over
Males 55.1% Never married25.6% Now married8.7% Separated3.9% Widowed6.7% DivorcedFemales 49.3% Never married26.8% Now married3.3% Separated11.0% Widowed9.6% DivorcedWomen who gave birth in the past 12 months Now married:
23.0% (17)Unmarried:
77.0% (57)
Women who did not give birth in the past 12 months Now married:
30.9% (292)Unmarried:
69.1% (654)
Marital status - American Indian / Alaska Native population 15 years and over
Males 14.8% Never married29.6% Now married0.0% Separated0.0% Widowed55.6% DivorcedFemales 82.1% Never married17.9% Now married0.0% Separated0.0% Widowed0.0% DivorcedWomen who did not give birth in the past 12 months Now married:
17.9% (5)Unmarried:
82.1% (24)
Marital status - Asian population 15 years and over
Males 0.0% Never married47.6% Now married0.0% Separated52.4% Widowed0.0% DivorcedFemales 23.8% Never married75.5% Now married0.0% Separated0.0% Widowed0.7% DivorcedWomen who gave birth in the past 12 months Now married:
100.0% (46)Unmarried:
0.0% (0)
Women who did not give birth in the past 12 months Now married:
39.7% (24)Unmarried:
60.3% (37)
Marital status - Native Hawaiian / Pacific Islander population 15 years and over
Males 0.0% Never married100.0% Now married0.0% Separated0.0% Widowed0.0% DivorcedFemales 0.0% Never married100.0% Now married0.0% Separated0.0% Widowed0.0% DivorcedWomen who did not give birth in the past 12 months Now married:
100.0% (43)Unmarried:
0.0% (0)
Marital status - Other race population 15 years and over
Males 39.7% Never married40.9% Now married9.4% Separated0.0% Widowed10.0% DivorcedFemales 52.1% Never married46.2% Now married0.0% Separated0.8% Widowed0.9% DivorcedWomen who did not give birth in the past 12 months Now married:
42.6% (579)Unmarried:
57.4% (779)
Marital status - Two or more races population 15 years and over
Males 40.5% Never married37.0% Now married1.4% Separated16.4% Widowed4.7% DivorcedFemales 31.1% Never married33.7% Now married1.3% Separated16.7% Widowed17.2% DivorcedWomen who gave birth in the past 12 months Now married:
100.0% (45)Unmarried:
0.0% (0)
Women who did not give birth in the past 12 months Now married:
28.5% (81)Unmarried:
71.5% (203)
Marital status - White alone, not Hispanic / Latino population 15 years and over
Males 30.3% Never married42.2% Now married3.9% Separated5.8% Widowed17.8% DivorcedFemales 22.7% Never married41.1% Now married3.3% Separated16.3% Widowed16.6% DivorcedWomen who gave birth in the past 12 months Now married:
51.8% (59)Unmarried:
48.2% (55)
Women who did not give birth in the past 12 months Now married:
45.5% (1,287)Unmarried:
54.5% (1,539)
Marital status - Hispanic or Latino population 15 years and over
Males 36.7% Never married48.7% Now married5.6% Separated0.0% Widowed9.0% DivorcedFemales 46.1% Never married48.7% Now married0.6% Separated0.4% Widowed4.2% DivorcedWomen who gave birth in the past 12 months Now married:
34.4% (75)Unmarried:
65.6% (143)
Women who did not give birth in the past 12 months Now married:
46.2% (1,024)Unmarried:
53.8% (1,190)
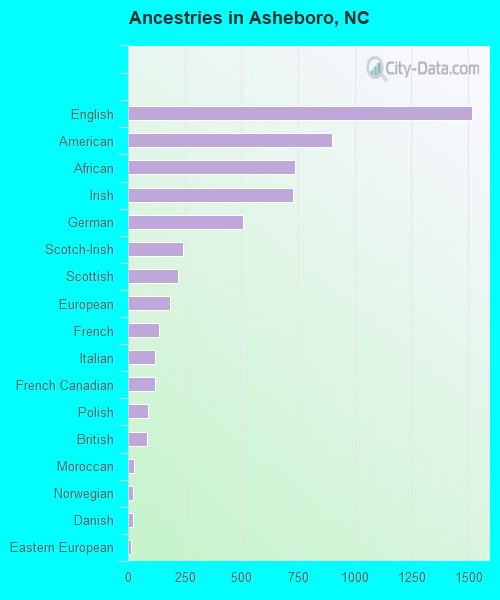
Ancestries in Asheboro
1,516 8.8% English901 5.2% American735 4.3% African727 4.2% Irish508 2.9% German243 1.4% Scotch-Irish222 1.3% Scottish186 1.1% European138 0.8% French118 0.7% Italian117 0.7% French Canadian87 0.5% Polish82 0.5% British28 0.2% Moroccan24 0.1% Norwegian20 0.1% Danish15 0.09% Eastern European12 0.07% Hungarian12 0.07% Welsh10 0.06% Canadian9 0.05% Cajun8 0.05% Brazilian3 0.02% Egyptian
Geographical mobility in Asheboro Same house 1 year ago 14,454 86.1% White (Caucasian)2,932 79.7% Black or African American123 100.0% American Indian / Alaska Native119 39.2% Asian98 100.0% Native Hawaiian / Pacific Islander4,481 90.2% Other race1,456 78.6% Two or more races12,164 85.4% White alone, not Hispanic / Latino7,200 90.9% Hispanic or LatinoMoved within same county 1,316 7.8% White / Caucasian513 13.9% Black or African American163 53.6% Asian339 6.8% Other race149 8.0% Two or more races1,134 8.0% White alone, not Hispanic / Latino587 7.4% Hispanic or LatinoMoved within same state 624 3.7% White / Caucasian171 4.6% Black or African American21 0.4% Other race22 1.2% Two or more races638 4.5% White alone, not Hispanic / Latino24 0.3% Hispanic or LatinoMoved from different state 100 0.6% White / Caucasian5 0.1% Black or African American31 1.7% Two or more races91 0.6% White alone, not Hispanic / Latino18 0.2% Hispanic or LatinoMoved from abroad 34 0.2% White120 2.4% Other race34 0.2% White alone, not Hispanic / Latino77 1.0% Hispanic or Latino
Children Nativity (place of birth) in Asheboro
Children under 6 years - Living with two parents Both parents native 621 100.0% Native0 0.0% Foreign-bornBoth parents foreign-born 164 88.6% Native21 11.4% Foreign-bornOne native, one foreign-born parent 345 100.0% NativeChildren under 6 years - Living with one parent Native parent 812 98.4% Native13 1.6% Foreign-bornForeign-born parent 234 100.0% NativeChildren 6 to 17 years - Living with two parents Both parents native 1,506 100.0% NativeBoth parents foreign-born 651 91.4% Native61 8.6% Foreign-bornOne native, one foreign-born parent 602 100.0% NativeChildren 6 to 17 years - Living with one parent Native parent 1,067 100.0% NativeForeign-born parent 456 52.3% Native415 47.7% Foreign-born
Grandparents responsible for own grandchildren in Asheboro
Grandparents (30 to 59 years) White / Caucasian 26 44.1% Responsible for grandchildren33 55.9% Not responsible for grandchildrenBlack or African American 29 100.0% Responsible for grandchildrenAmerican Indian / Alaska Native 38 100.0% Not responsible for grandchildrenOther race 38 100.0% Responsible for grandchildrenWhite alone, not Hispanic / Latino 16 69.5% Responsible for grandchildren7 30.5% Not responsible for grandchildrenHispanic or Latino 43 30.5% Responsible for grandchildren97 69.5% Not responsible for grandchildrenGrandparents (60 years and over) White / Caucasian 91 67.5% Responsible for grandchildren44 32.5% Not responsible for grandchildrenBlack or African American 43 100.0% Not responsible for grandchildrenOther race 47 78.2% Responsible for grandchildren13 21.8% Not responsible for grandchildrenWhite alone, not Hispanic / Latino 63 59.0% Responsible for grandchildren44 41.0% Not responsible for grandchildrenHispanic or Latino 45 70.5% Responsible for grandchildren19 29.5% Not responsible for grandchildren