Races in Asbury Park, New Jersey (NJ) Detailed Stats
Data:
Races - White alone (%)
Races - White alone (% change since 2000)
Races - Black alone (%)
Races - Black alone (% change since 2000)
Races - American Indian alone (%)
Races - American Indian alone (% change since 2000)
Races - Asian alone (%)
Races - Asian alone (% change since 2000)
Races - Hispanic (%)
Races - Hispanic (% change since 2000)
Races - Native Hawaiian and Other Pacific Islander alone (%)
Races - Native Hawaiian and Other Pacific Islander alone (% change since 2000)
Races - Two or more races(%)
Races - Two or more races(% change since 2000)
Races - Other race alone (%)
Races - Other race alone (% change since 2000)
Racial diversity
Place of birth - Born in state of residence (%)
Place of birth - Born in state of residence (%) - White
Place of birth - Born in state of residence (%) - Black or African American
Place of birth - Born in state of residence (%) - Asian
Place of birth - Born in state of residence (%) - Hispanic or Latino
Place of birth - Born in state of residence (%) - American Indian and Alaska Native
Place of birth - Born in state of residence (%) - Multirace
Place of birth - Born in state of residence (%) - Other Race
Place of birth - Born in other state (%)
Place of birth - Born in other state (%) - White
Place of birth - Born in other state (%) - Black or African American
Place of birth - Born in other state (%) - Asian
Place of birth - Born in other state (%) - Hispanic or Latino
Place of birth - Born in other state (%) - American Indian and Alaska Native
Place of birth - Born in other state (%) - Multirace
Place of birth - Born in other state (%) - Other Race
Place of birth - Native, outside of US (%)
Place of birth - Native, outside of US (%) - White
Place of birth - Native, outside of US (%) - Black or African American
Place of birth - Native, outside of US (%) - Asian
Place of birth - Native, outside of US (%) - Hispanic or Latino
Place of birth - Native, outside of US (%) - American Indian and Alaska Native
Place of birth - Native, outside of US (%) - Multirace
Place of birth - Native, outside of US (%) - Other Race
Place of birth - Foreign born (%)
Place of birth - Foreign born (%) - White
Place of birth - Foreign born (%) - Black or African American
Place of birth - Foreign born (%) - Asian
Place of birth - Foreign born (%) - Hispanic or Latino
Place of birth - Foreign born (%) - American Indian and Alaska Native
Place of birth - Foreign born (%) - Multirace
Place of birth - Foreign born (%) - Other Race
Residents speaking English at home (%)
Residents speaking English at home - Born in the United States (%)
Residents speaking English at home - Native, born elsewhere (%)
Residents speaking English at home - Foreign born (%)
Residents speaking Spanish at home (%)
Residents speaking Spanish at home - Born in the United States (%)
Residents speaking Spanish at home - Native, born elsewhere (%)
Residents speaking Spanish at home - Foreign born (%)
Residents speaking other language at home (%)
Residents speaking other language at home - Born in the United States (%)
Residents speaking other language at home - Native, born elsewhere (%)
Residents speaking other language at home - Foreign born (%)
Marital status - Never married (%)
Marital status - Now married (%)
Marital status - Separated (%)
Marital status - Widowed (%)
Marital status - Divorced (%)
Ancestries Reported - Arab (%)
Ancestries Reported - Czech (%)
Ancestries Reported - Danish (%)
Ancestries Reported - Dutch (%)
Ancestries Reported - English (%)
Ancestries Reported - French (%)
Ancestries Reported - French Canadian (%)
Ancestries Reported - German (%)
Ancestries Reported - Greek (%)
Ancestries Reported - Hungarian (%)
Ancestries Reported - Irish (%)
Ancestries Reported - Italian (%)
Ancestries Reported - Lithuanian (%)
Ancestries Reported - Norwegian (%)
Ancestries Reported - Polish (%)
Ancestries Reported - Portuguese (%)
Ancestries Reported - Russian (%)
Ancestries Reported - Scotch-Irish (%)
Ancestries Reported - Scottish (%)
Ancestries Reported - Slovak (%)
Ancestries Reported - Subsaharan African (%)
Ancestries Reported - Swedish (%)
Ancestries Reported - Swiss (%)
Ancestries Reported - Ukrainian (%)
Ancestries Reported - United States (%)
Ancestries Reported - Welsh (%)
Ancestries Reported - West Indian (%)
Ancestries Reported - Other (%)
Geographical mobility - Same house 1 year ago (%)
Geographical mobility - Same house 1 year ago (%) - White
Geographical mobility - Same house 1 year ago (%) - Black or African American
Geographical mobility - Same house 1 year ago (%) - Asian
Geographical mobility - Same house 1 year ago (%) - Hispanic or Latino
Geographical mobility - Same house 1 year ago (%) - American Indian and Alaska Native
Geographical mobility - Same house 1 year ago (%) - Multirace
Geographical mobility - Same house 1 year ago (%) - Other Race
Geographical mobility - Moved within same county (%)
Geographical mobility - Moved within same county (%) - White
Geographical mobility - Moved within same county (%) - Black or African American
Geographical mobility - Moved within same county (%) - Asian
Geographical mobility - Moved within same county (%) - Hispanic or Latino
Geographical mobility - Moved within same county (%) - American Indian and Alaska Native
Geographical mobility - Moved within same county (%) - Multirace
Geographical mobility - Moved within same county (%) - Other Race
Geographical mobility - Moved from different county within same state (%)
Geographical mobility - Moved from different county within same state (%) - White
Geographical mobility - Moved from different county within same state (%) - Black or African American
Geographical mobility - Moved from different county within same state (%) - Asian
Geographical mobility - Moved from different county within same state (%) - Hispanic or Latino
Geographical mobility - Moved from different county within same state (%) - American Indian and Alaska Native
Geographical mobility - Moved from different county within same state (%) - Multirace
Geographical mobility - Moved from different county within same state (%) - Other Race
Geographical mobility - Moved from different state (%)
Geographical mobility - Moved from different state (%) - White
Geographical mobility - Moved from different state (%) - Black or African American
Geographical mobility - Moved from different state (%) - Asian
Geographical mobility - Moved from different state (%) - Hispanic or Latino
Geographical mobility - Moved from different state (%) - American Indian and Alaska Native
Geographical mobility - Moved from different state (%) - Multirace
Geographical mobility - Moved from different state (%) - Other Race
Geographical mobility - Moved from abroad (%)
Geographical mobility - Moved from abroad (%) - White
Geographical mobility - Moved from abroad (%) - Black or African American
Geographical mobility - Moved from abroad (%) - Asian
Geographical mobility - Moved from abroad (%) - Hispanic or Latino
Geographical mobility - Moved from abroad (%) - American Indian and Alaska Native
Geographical mobility - Moved from abroad (%) - Multirace
Geographical mobility - Moved from abroad (%) - Other Race
Place of birth for the foreign-born population - Ireland (%)
Place of birth for the foreign-born population - Denmark (%)
Place of birth for the foreign-born population - Norway (%)
Place of birth for the foreign-born population - Sweden (%)
Place of birth for the foreign-born population - United Kingdom (%)
Place of birth for the foreign-born population - England (%)
Place of birth for the foreign-born population - Scotland (%)
Place of birth for the foreign-born population - Other Northern Europe (%)
Place of birth for the foreign-born population - Austria (%)
Place of birth for the foreign-born population - Belgium (%)
Place of birth for the foreign-born population - France (%)
Place of birth for the foreign-born population - Germany (%)
Place of birth for the foreign-born population - Netherlands (%)
Place of birth for the foreign-born population - Switzerland (%)
Place of birth for the foreign-born population - Other Western Europe (%)
Place of birth for the foreign-born population - Greece (%)
Place of birth for the foreign-born population - Italy (%)
Place of birth for the foreign-born population - Portugal (%)
Place of birth for the foreign-born population - Spain (%)
Place of birth for the foreign-born population - Other Southern Europe (%)
Place of birth for the foreign-born population - Albania (%)
Place of birth for the foreign-born population - Belarus (%)
Place of birth for the foreign-born population - Bosnia and Herzegovina (%)
Place of birth for the foreign-born population - Bulgaria (%)
Place of birth for the foreign-born population - Croatia (%)
Place of birth for the foreign-born population - Czechoslovakia (%)
Place of birth for the foreign-born population - Hungary (%)
Place of birth for the foreign-born population - Latvia (%)
Place of birth for the foreign-born population - Lithuania (%)
Place of birth for the foreign-born population - North Macedonia (Macedonia) (%)
Place of birth for the foreign-born population - Moldova (%)
Place of birth for the foreign-born population - Poland (%)
Place of birth for the foreign-born population - Romania (%)
Place of birth for the foreign-born population - Russia (%)
Place of birth for the foreign-born population - Serbia (%)
Place of birth for the foreign-born population - Ukraine (%)
Place of birth for the foreign-born population - Other Eastern Europe (%)
Place of birth for the foreign-born population - China (%)
Place of birth for the foreign-born population - Hong Kong (%)
Place of birth for the foreign-born population - Taiwan (%)
Place of birth for the foreign-born population - Japan (%)
Place of birth for the foreign-born population - Korea (%)
Place of birth for the foreign-born population - Other Eastern Asia (%)
Place of birth for the foreign-born population - Afghanistan (%)
Place of birth for the foreign-born population - Bangladesh (%)
Place of birth for the foreign-born population - India (%)
Place of birth for the foreign-born population - Iran (%)
Place of birth for the foreign-born population - Kazakhstan (%)
Place of birth for the foreign-born population - Nepal (%)
Place of birth for the foreign-born population - Pakistan (%)
Place of birth for the foreign-born population - Sri Lanka (%)
Place of birth for the foreign-born population - Uzbekistan (%)
Place of birth for the foreign-born population - Other South Central Asia (%)
Place of birth for the foreign-born population - Burma (%)
Place of birth for the foreign-born population - Cambodia (%)
Place of birth for the foreign-born population - Indonesia (%)
Place of birth for the foreign-born population - Laos (%)
Place of birth for the foreign-born population - Malaysia (%)
Place of birth for the foreign-born population - Philippines (%)
Place of birth for the foreign-born population - Singapore (%)
Place of birth for the foreign-born population - Thailand (%)
Place of birth for the foreign-born population - Vietnam (%)
Place of birth for the foreign-born population - Other South Eastern Asia (%)
Place of birth for the foreign-born population - Armenia (%)
Place of birth for the foreign-born population - Iraq (%)
Place of birth for the foreign-born population - Israel (%)
Place of birth for the foreign-born population - Jordan (%)
Place of birth for the foreign-born population - Kuwait (%)
Place of birth for the foreign-born population - Lebanon (%)
Place of birth for the foreign-born population - Saudi Arabia (%)
Place of birth for the foreign-born population - Syria (%)
Place of birth for the foreign-born population - Turkey (%)
Place of birth for the foreign-born population - Yemen (%)
Place of birth for the foreign-born population - Other Western Asia (%)
Place of birth for the foreign-born population - Eritrea (%)
Place of birth for the foreign-born population - Ethiopia (%)
Place of birth for the foreign-born population - Kenya (%)
Place of birth for the foreign-born population - Somalia (%)
Place of birth for the foreign-born population - Uganda (%)
Place of birth for the foreign-born population - Zimbabwe (%)
Place of birth for the foreign-born population - Other Eastern Africa (%)
Place of birth for the foreign-born population - Cameroon (%)
Place of birth for the foreign-born population - Congo (%)
Place of birth for the foreign-born population - Democratic Republic of Congo (Zaire) (%)
Place of birth for the foreign-born population - Other Middle Africa (%)
Place of birth for the foreign-born population - Egypt (%)
Place of birth for the foreign-born population - Morocco (%)
Place of birth for the foreign-born population - Sudan (%)
Place of birth for the foreign-born population - Other Northern Africa (%)
Place of birth for the foreign-born population - South Africa (%)
Place of birth for the foreign-born population - Other Southern Africa (%)
Place of birth for the foreign-born population - Cabo Verde (%)
Place of birth for the foreign-born population - Ghana (%)
Place of birth for the foreign-born population - Liberia (%)
Place of birth for the foreign-born population - Nigeria (%)
Place of birth for the foreign-born population - Senegal (%)
Place of birth for the foreign-born population - Sierra Leone (%)
Place of birth for the foreign-born population - Other Western Africa (%)
Place of birth for the foreign-born population - Australia (%)
Place of birth for the foreign-born population - New Zealand (%)
Place of birth for the foreign-born population - Fiji (%)
Place of birth for the foreign-born population - Micronesia (%)
Place of birth for the foreign-born population - Bahamas (%)
Place of birth for the foreign-born population - Barbados (%)
Place of birth for the foreign-born population - Cuba (%)
Place of birth for the foreign-born population - Dominica (%)
Place of birth for the foreign-born population - Dominican Republic (%)
Place of birth for the foreign-born population - Grenada (%)
Place of birth for the foreign-born population - Haiti (%)
Place of birth for the foreign-born population - Jamaica (%)
Place of birth for the foreign-born population - St. Vincent and the Grenadines (%)
Place of birth for the foreign-born population - Trinidad and Tobago (%)
Place of birth for the foreign-born population - West Indies (%)
Place of birth for the foreign-born population - Other Caribbean (%)
Place of birth for the foreign-born population - Belize (%)
Place of birth for the foreign-born population - Costa Rica (%)
Place of birth for the foreign-born population - El Salvador (%)
Place of birth for the foreign-born population - Guatemala (%)
Place of birth for the foreign-born population - Honduras (%)
Place of birth for the foreign-born population - Mexico (%)
Place of birth for the foreign-born population - Nicaragua (%)
Place of birth for the foreign-born population - Panama (%)
Place of birth for the foreign-born population - Other Central America (%)
Place of birth for the foreign-born population - Argentina (%)
Place of birth for the foreign-born population - Bolivia (%)
Place of birth for the foreign-born population - Brazil (%)
Place of birth for the foreign-born population - Chile (%)
Place of birth for the foreign-born population - Colombia (%)
Place of birth for the foreign-born population - Ecuador (%)
Place of birth for the foreign-born population - Guyana (%)
Place of birth for the foreign-born population - Peru (%)
Place of birth for the foreign-born population - Uruguay (%)
Place of birth for the foreign-born population - Venezuela (%)
Place of birth for the foreign-born population - Other South America (%)
Place of birth for the foreign-born population - Canada (%)
Place of birth for the foreign-born population - Other Northern America (%)
Place of birth for the foreign-born population - Other (%)
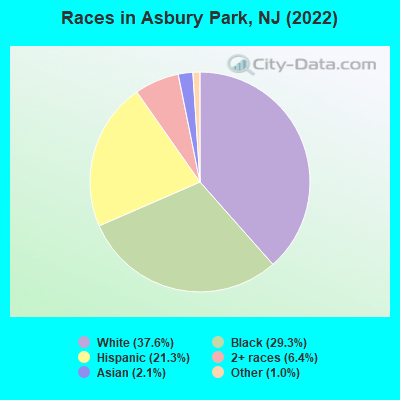
According to 2022 data, the most numerous races in Asbury Park, NJ are White alone (5,738 residents), Hispanic (3,256 residents), and Black alone (4,479 residents). 72.8% of Asbury Park residents speak English at home. 15.5% of Asbury Park, NJ residents are foreign-born (12.0% born in Latin America, 1.6% born in Europe), which is 48.1% less than the foreign-born rate of 23.0% across the entire state of New Jersey.
Race distribution in Asbury Park
2000 2022
5,557,209 66.0% White alone 1,117,191 13.3% Hispanic 1,096,171 13.0% Black alone 477,012 5.7% Asian alone 133,689 1.6% Two or more races 19,565 0.2% Other race alone 11,338 0.1% American Indian alone 2,175 0.03% Native Hawaiian and Other
4,766,476 51.5% White alone 2,028,470 21.9% Hispanic 1,111,632 12.0% Black alone 923,546 10.0% Asian alone 332,237 3.6% Two or more races 89,847 1.0% Other race alone 8,557 0.09% American Indian alone 934 0.01% Native Hawaiian and Other
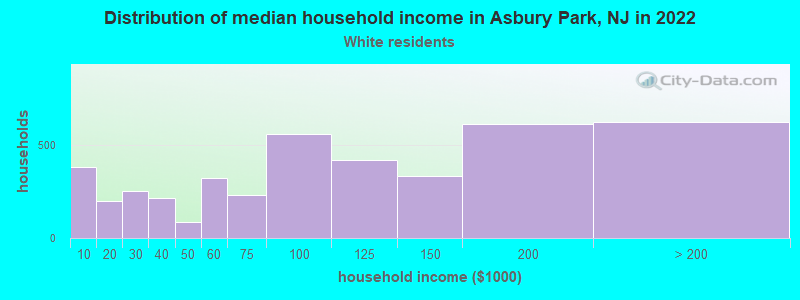
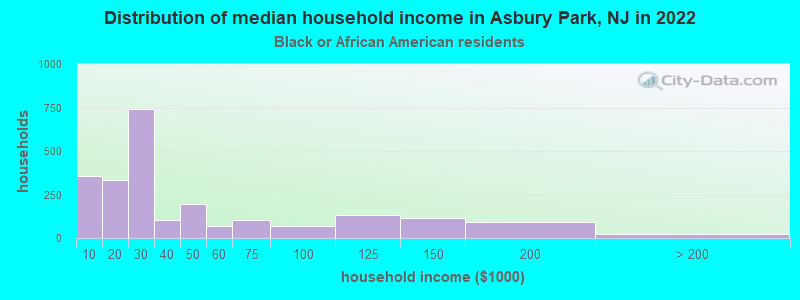
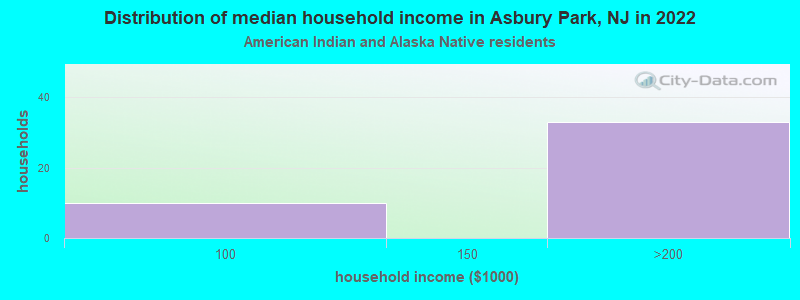
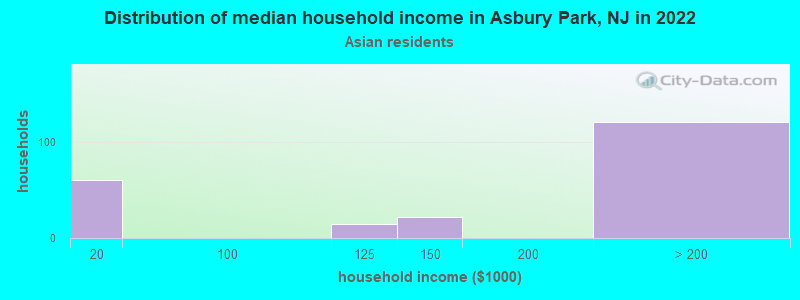
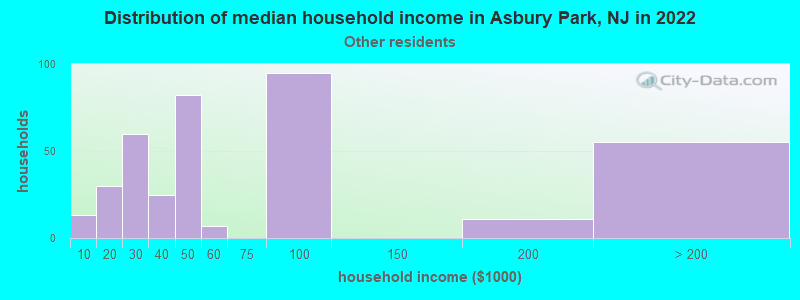
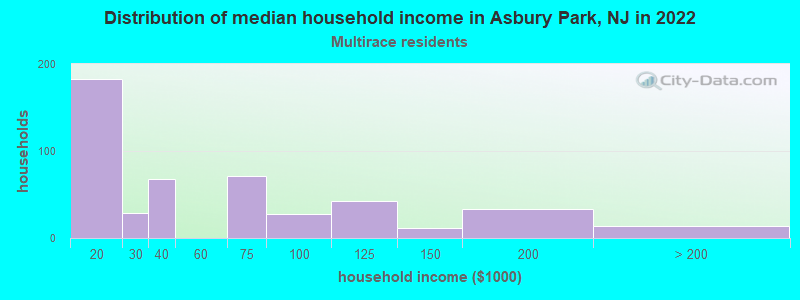
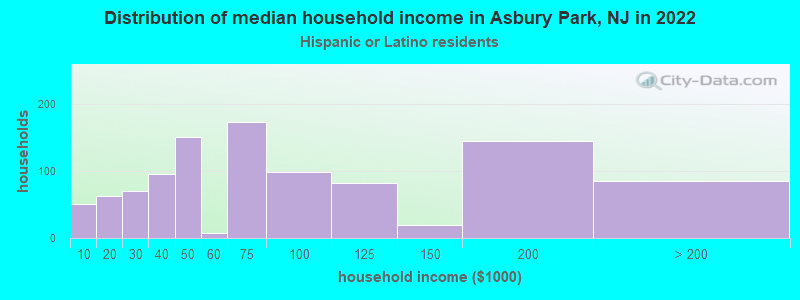
Income and house value in Asbury Park Median household income in 2022 $92,461 White non-Hispanic householders$21,478 Black householders$199,847 Asian householders$50,710 Some other race householders$72,176 Hispanic or Latino race householdersMedian 2022 house value $639,157 White Non-Hispanic householders$471,798 Black or African American householders $619,338 Asian householders$547,220 Some other race householders$688,154 Two or more races householders$547,220 Hispanic or Latino householders
Median age by race in Asbury Park
42.4 Median age for White residents38.9 45.9 43.1 Median age for Black or African American residents38.5 40.8 16.0 Median age for American Indian / Alaska Native residents12.2 19.1 33.9 Median age for Asian residents33.0 48.6 -804,177,544.9 Median age for Native Hawaiian / Pacific Islander residents-860,335,194.7 -713,070,378.3 32.8 Median age for Other race residents31.7 35.9 20.8 Median age for Two or more races residents21.0 27.7 43.1 Median age for White alone residents40.3 46.6 30.4 Median age for Hispanic or Latino residents30.2 31.4
Owner/renter occupied households by race in Asbury Park
House owners and renters - White residents 1,641 39.8% Owner occupied2,483 60.2% Renter occupiedHouse owners and renters - Black or African American residents 436 21.0% Owner occupied1,640 79.0% Renter occupiedHouse owners and renters - American Indian / Alaska Native residents 49 100.0% Renter occupiedHouse owners and renters - Asian residents 59 26.6% Owner occupied161 73.4% Renter occupiedHouse owners and renters - Other race residents 123 24.2% Owner occupied386 75.8% Renter occupiedHouse owners and renters - Two or more races residents 95 21.6% Owner occupied344 78.4% Renter occupiedHouse owners and renters - White alone residents 1,554 39.8% Owner occupied2,349 60.2% Renter occupiedHouse owners and renters - Hispanic or Latino residents 261 25.1% Owner occupied781 74.9% Renter occupied
Language usage in Asbury Park
English speakers - Total 72.8% of residents of Asbury Park speak English at home.
15.3% of residents speak Spanish at home 1,028 45.6% Speak English very well1,227 54.4% Speak English less than very well11.2% of residents speak other language at home 1,221 73.8% Speak English very well434 26.2% Speak English less than very well
English speakers - Born in the United States 89.9% of residents of Asbury Park speak English at home.
7.5% of residents speak Spanish at home 178 70.4% Speak English very well75 29.6% Speak English less than very well2.1% of residents speak other language at home 55 78.6% Speak English very well15 21.4% Speak English less than very well
English speakers - Native, born elsewhere 15.8% of residents of Asbury Park speak English at home.
82.2% of residents speak Spanish at home 161 49.8% Speak English very well162 50.2% Speak English less than very well
English speakers - Foreign-born 15.4% of residents of Asbury Park speak English at home.
43.6% of residents speak Spanish at home 154 15.0% Speak English very well873 85.0% Speak English less than very well40.9% of residents speak other language at home 556 57.7% Speak English very well408 42.3% Speak English less than very well
White (Caucasian) - Speak only English Native:
94.4% (5,446)Foreign-born:
20.3% (120)
White (Caucasian) - Speak another language Native:
5.3% (307)Foreign-born:
80.1% (473)
Black or African American - Speak only English Native:
87.7% (3,610)Foreign-born:
21.1% (119)
Black or African American - Speak another language Native:
13.5% (555)Foreign-born:
78.8% (444)
American Indian / Alaska Native - Speak another language Native:
78.2% (175)Foreign-born:
97.6% (20)
Asian - Speak only English Native:
86.9% (128)Foreign-born:
37.7% (62)
Other race - Speak only English Native:
12.5% (110)Foreign-born:
6.4% (59)
Other race - Speak another language Native:
73.2% (643)Foreign-born:
91.5% (853)
Two or more races - Speak only English Native:
43.7% (600)Foreign-born:
3.7% (4)
Two or more races - Speak another language Native:
46.8% (642)Foreign-born:
100.0% (112)
White alone - Speak only English Native:
97.8% (5,261)Foreign-born:
33.4% (119)
White alone - Speak another language Native:
2.3% (122)Foreign-born:
65.8% (234)
Hispanic or Latino - Speak only English Native:
32.2% (598)Foreign-born:
4.5% (47)
Hispanic or Latino - Speak another language Native:
62.8% (1,168)Foreign-born:
93.1% (978)
Foreign-born residents in Asbury Park 2,372 residents are foreign born (12.0% Latin America , 1.6% Europe ).
This city:
15.5%New Jersey:
23.2%
Marital status for residents in Asbury Park Marital status - White (Caucasian) population 15 years and over
Males 59.6% Never married27.8% Now married1.0% Separated2.1% Widowed9.6% DivorcedFemales 49.0% Never married31.1% Now married1.8% Separated6.1% Widowed12.0% DivorcedWomen who gave birth in the past 12 months Now married:
48.0% (44)Unmarried:
52.0% (48)
Women who did not give birth in the past 12 months Now married:
24.6% (418)Unmarried:
75.4% (1,278)
Marital status - Black or African American population 15 years and over
Males 60.1% Never married26.1% Now married2.7% Separated3.0% Widowed8.1% DivorcedFemales 56.3% Never married16.0% Now married5.5% Separated11.2% Widowed11.0% DivorcedWomen who gave birth in the past 12 months Now married:
0.0% (0)Unmarried:
100.0% (20)
Women who did not give birth in the past 12 months Now married:
21.4% (233)Unmarried:
78.6% (859)
Marital status - American Indian / Alaska Native population 15 years and over
Males 63.0% Never married37.0% Now married0.0% Separated0.0% Widowed0.0% DivorcedFemales 66.2% Never married33.8% Now married0.0% Separated0.0% Widowed0.0% DivorcedWomen who gave birth in the past 12 months Now married:
0.0% (0)Unmarried:
100.0% (31)
Women who did not give birth in the past 12 months Now married:
48.9% (34)Unmarried:
51.1% (36)
Marital status - Asian population 15 years and over
Males 69.6% Never married30.4% Now married0.0% Separated0.0% Widowed0.0% DivorcedFemales 34.2% Never married41.0% Now married0.0% Separated24.8% Widowed0.0% DivorcedWomen who gave birth in the past 12 months Now married:
100.0% (10)Unmarried:
0.0% (0)
Women who did not give birth in the past 12 months Now married:
21.6% (11)Unmarried:
78.4% (41)
Marital status - Other race population 15 years and over
Males 53.3% Never married39.3% Now married0.0% Separated5.0% Widowed2.4% DivorcedFemales 58.6% Never married31.6% Now married3.1% Separated0.0% Widowed6.7% DivorcedWomen who gave birth in the past 12 months Now married:
48.4% (23)Unmarried:
51.6% (25)
Women who did not give birth in the past 12 months Now married:
33.9% (232)Unmarried:
66.1% (452)
Marital status - Two or more races population 15 years and over
Males 73.1% Never married19.8% Now married0.0% Separated2.4% Widowed4.7% DivorcedFemales 74.2% Never married5.2% Now married3.8% Separated2.9% Widowed13.9% DivorcedWomen who gave birth in the past 12 months Now married:
0.0% (0)Unmarried:
100.0% (37)
Women who did not give birth in the past 12 months Now married:
7.2% (30)Unmarried:
92.8% (385)
Marital status - White alone, not Hispanic / Latino population 15 years and over
Males 58.7% Never married27.1% Now married1.1% Separated2.4% Widowed10.6% DivorcedFemales 47.8% Never married32.1% Now married0.8% Separated6.3% Widowed13.0% DivorcedWomen who gave birth in the past 12 months Now married:
78.3% (46)Unmarried:
21.7% (13)
Women who did not give birth in the past 12 months Now married:
21.1% (330)Unmarried:
78.9% (1,230)
Marital status - Hispanic or Latino population 15 years and over
Males 60.1% Never married34.0% Now married2.0% Separated2.0% Widowed1.8% DivorcedFemales 58.5% Never married25.2% Now married6.2% Separated2.7% Widowed7.4% DivorcedWomen who gave birth in the past 12 months Now married:
13.2% (16)Unmarried:
86.8% (103)
Women who did not give birth in the past 12 months Now married:
37.3% (294)Unmarried:
62.7% (495)
Ancestries in Asbury Park
977 12.4% Haitian520 6.6% Italian367 4.7% American258 3.3% Irish179 2.3% Polish111 1.4% Russian108 1.4% African87 1.1% German81 1.0% Iranian54 0.7% English52 0.7% Barbadian50 0.6% Jamaican44 0.6% British West Indian38 0.5% Ukrainian35 0.4% Eastern European26 0.3% Brazilian26 0.3% West Indian23 0.3% Slovak20 0.3% Czech18 0.2% French Canadian13 0.2% British13 0.2% Hungarian12 0.2% Dutch12 0.2% Yugoslavian10 0.1% European10 0.1% Swedish9 0.1% French7 0.09% Guyanese4 0.05% Scotch-Irish
Geographical mobility in Asbury Park Same house 1 year ago 5,130 80.5% White (Caucasian)4,484 95.0% Black or African American252 86.8% American Indian / Alaska Native212 66.6% Asian17 100.0% Native Hawaiian / Pacific Islander1,881 91.0% Other race1,426 94.6% Two or more races4,546 79.3% White alone, not Hispanic / Latino2,703 87.4% Hispanic or LatinoMoved within same county 584 9.2% White / Caucasian227 4.8% Black or African American41 13.0% Asian31 1.5% Other race56 3.7% Two or more races581 10.1% White alone, not Hispanic / Latino95 3.1% Hispanic or LatinoMoved within same state 287 4.5% White / Caucasian24 0.5% Black or African American40 13.8% American Indian / Alaska Native32 1.5% Other race15 1.0% Two or more races280 4.9% White alone, not Hispanic / Latino83 2.7% Hispanic or LatinoMoved from different state 235 3.7% White / Caucasian55 1.2% Black or African American32 10.0% Asian12 0.6% Other race229 4.0% White alone, not Hispanic / Latino54 1.8% Hispanic or LatinoMoved from abroad 12 0.2% White53 1.1% Black or African American108 5.2% Other race29 1.9% Two or more races12 0.2% White alone, not Hispanic / Latino160 5.2% Hispanic or Latino
Children Nativity (place of birth) in Asbury Park
Children under 6 years - Living with two parents Both parents native 33 100.0% NativeBoth parents foreign-born 46 100.0% NativeOne native, one foreign-born parent 40 100.0% NativeChildren under 6 years - Living with one parent Native parent 266 100.0% NativeForeign-born parent 81 100.0% NativeChildren 6 to 17 years - Living with two parents Both parents native 73 100.0% NativeBoth parents foreign-born 412 100.0% NativeOne native, one foreign-born parent 19 100.0% NativeChildren 6 to 17 years - Living with one parent Native parent 784 100.0% NativeForeign-born parent 444 51.1% Native424 48.9% Foreign-born
Grandparents responsible for own grandchildren in Asbury Park
Grandparents (30 to 59 years) White / Caucasian 49 100.0% Responsible for grandchildrenBlack or African American 2 4.9% Responsible for grandchildren41 95.1% Not responsible for grandchildrenOther race 58 73.8% Responsible for grandchildren21 26.2% Not responsible for grandchildrenHispanic or Latino 71 82.1% Responsible for grandchildren15 17.9% Not responsible for grandchildrenGrandparents (60 years and over) Black or African American 33 27.9% Responsible for grandchildren84 72.1% Not responsible for grandchildren