Races in Artesia, New Mexico (NM) Detailed Stats
Data:
Races - White alone (%)
Races - White alone (% change since 2000)
Races - Black alone (%)
Races - Black alone (% change since 2000)
Races - American Indian alone (%)
Races - American Indian alone (% change since 2000)
Races - Asian alone (%)
Races - Asian alone (% change since 2000)
Races - Hispanic (%)
Races - Hispanic (% change since 2000)
Races - Native Hawaiian and Other Pacific Islander alone (%)
Races - Native Hawaiian and Other Pacific Islander alone (% change since 2000)
Races - Two or more races(%)
Races - Two or more races(% change since 2000)
Races - Other race alone (%)
Races - Other race alone (% change since 2000)
Racial diversity
Place of birth - Born in state of residence (%)
Place of birth - Born in state of residence (%) - White
Place of birth - Born in state of residence (%) - Black or African American
Place of birth - Born in state of residence (%) - Asian
Place of birth - Born in state of residence (%) - Hispanic or Latino
Place of birth - Born in state of residence (%) - American Indian and Alaska Native
Place of birth - Born in state of residence (%) - Multirace
Place of birth - Born in state of residence (%) - Other Race
Place of birth - Born in other state (%)
Place of birth - Born in other state (%) - White
Place of birth - Born in other state (%) - Black or African American
Place of birth - Born in other state (%) - Asian
Place of birth - Born in other state (%) - Hispanic or Latino
Place of birth - Born in other state (%) - American Indian and Alaska Native
Place of birth - Born in other state (%) - Multirace
Place of birth - Born in other state (%) - Other Race
Place of birth - Native, outside of US (%)
Place of birth - Native, outside of US (%) - White
Place of birth - Native, outside of US (%) - Black or African American
Place of birth - Native, outside of US (%) - Asian
Place of birth - Native, outside of US (%) - Hispanic or Latino
Place of birth - Native, outside of US (%) - American Indian and Alaska Native
Place of birth - Native, outside of US (%) - Multirace
Place of birth - Native, outside of US (%) - Other Race
Place of birth - Foreign born (%)
Place of birth - Foreign born (%) - White
Place of birth - Foreign born (%) - Black or African American
Place of birth - Foreign born (%) - Asian
Place of birth - Foreign born (%) - Hispanic or Latino
Place of birth - Foreign born (%) - American Indian and Alaska Native
Place of birth - Foreign born (%) - Multirace
Place of birth - Foreign born (%) - Other Race
Residents speaking English at home (%)
Residents speaking English at home - Born in the United States (%)
Residents speaking English at home - Native, born elsewhere (%)
Residents speaking English at home - Foreign born (%)
Residents speaking Spanish at home (%)
Residents speaking Spanish at home - Born in the United States (%)
Residents speaking Spanish at home - Native, born elsewhere (%)
Residents speaking Spanish at home - Foreign born (%)
Residents speaking other language at home (%)
Residents speaking other language at home - Born in the United States (%)
Residents speaking other language at home - Native, born elsewhere (%)
Residents speaking other language at home - Foreign born (%)
Marital status - Never married (%)
Marital status - Now married (%)
Marital status - Separated (%)
Marital status - Widowed (%)
Marital status - Divorced (%)
Ancestries Reported - Arab (%)
Ancestries Reported - Czech (%)
Ancestries Reported - Danish (%)
Ancestries Reported - Dutch (%)
Ancestries Reported - English (%)
Ancestries Reported - French (%)
Ancestries Reported - French Canadian (%)
Ancestries Reported - German (%)
Ancestries Reported - Greek (%)
Ancestries Reported - Hungarian (%)
Ancestries Reported - Irish (%)
Ancestries Reported - Italian (%)
Ancestries Reported - Lithuanian (%)
Ancestries Reported - Norwegian (%)
Ancestries Reported - Polish (%)
Ancestries Reported - Portuguese (%)
Ancestries Reported - Russian (%)
Ancestries Reported - Scotch-Irish (%)
Ancestries Reported - Scottish (%)
Ancestries Reported - Slovak (%)
Ancestries Reported - Subsaharan African (%)
Ancestries Reported - Swedish (%)
Ancestries Reported - Swiss (%)
Ancestries Reported - Ukrainian (%)
Ancestries Reported - United States (%)
Ancestries Reported - Welsh (%)
Ancestries Reported - West Indian (%)
Ancestries Reported - Other (%)
Geographical mobility - Same house 1 year ago (%)
Geographical mobility - Same house 1 year ago (%) - White
Geographical mobility - Same house 1 year ago (%) - Black or African American
Geographical mobility - Same house 1 year ago (%) - Asian
Geographical mobility - Same house 1 year ago (%) - Hispanic or Latino
Geographical mobility - Same house 1 year ago (%) - American Indian and Alaska Native
Geographical mobility - Same house 1 year ago (%) - Multirace
Geographical mobility - Same house 1 year ago (%) - Other Race
Geographical mobility - Moved within same county (%)
Geographical mobility - Moved within same county (%) - White
Geographical mobility - Moved within same county (%) - Black or African American
Geographical mobility - Moved within same county (%) - Asian
Geographical mobility - Moved within same county (%) - Hispanic or Latino
Geographical mobility - Moved within same county (%) - American Indian and Alaska Native
Geographical mobility - Moved within same county (%) - Multirace
Geographical mobility - Moved within same county (%) - Other Race
Geographical mobility - Moved from different county within same state (%)
Geographical mobility - Moved from different county within same state (%) - White
Geographical mobility - Moved from different county within same state (%) - Black or African American
Geographical mobility - Moved from different county within same state (%) - Asian
Geographical mobility - Moved from different county within same state (%) - Hispanic or Latino
Geographical mobility - Moved from different county within same state (%) - American Indian and Alaska Native
Geographical mobility - Moved from different county within same state (%) - Multirace
Geographical mobility - Moved from different county within same state (%) - Other Race
Geographical mobility - Moved from different state (%)
Geographical mobility - Moved from different state (%) - White
Geographical mobility - Moved from different state (%) - Black or African American
Geographical mobility - Moved from different state (%) - Asian
Geographical mobility - Moved from different state (%) - Hispanic or Latino
Geographical mobility - Moved from different state (%) - American Indian and Alaska Native
Geographical mobility - Moved from different state (%) - Multirace
Geographical mobility - Moved from different state (%) - Other Race
Geographical mobility - Moved from abroad (%)
Geographical mobility - Moved from abroad (%) - White
Geographical mobility - Moved from abroad (%) - Black or African American
Geographical mobility - Moved from abroad (%) - Asian
Geographical mobility - Moved from abroad (%) - Hispanic or Latino
Geographical mobility - Moved from abroad (%) - American Indian and Alaska Native
Geographical mobility - Moved from abroad (%) - Multirace
Geographical mobility - Moved from abroad (%) - Other Race
Place of birth for the foreign-born population - Ireland (%)
Place of birth for the foreign-born population - Denmark (%)
Place of birth for the foreign-born population - Norway (%)
Place of birth for the foreign-born population - Sweden (%)
Place of birth for the foreign-born population - United Kingdom (%)
Place of birth for the foreign-born population - England (%)
Place of birth for the foreign-born population - Scotland (%)
Place of birth for the foreign-born population - Other Northern Europe (%)
Place of birth for the foreign-born population - Austria (%)
Place of birth for the foreign-born population - Belgium (%)
Place of birth for the foreign-born population - France (%)
Place of birth for the foreign-born population - Germany (%)
Place of birth for the foreign-born population - Netherlands (%)
Place of birth for the foreign-born population - Switzerland (%)
Place of birth for the foreign-born population - Other Western Europe (%)
Place of birth for the foreign-born population - Greece (%)
Place of birth for the foreign-born population - Italy (%)
Place of birth for the foreign-born population - Portugal (%)
Place of birth for the foreign-born population - Spain (%)
Place of birth for the foreign-born population - Other Southern Europe (%)
Place of birth for the foreign-born population - Albania (%)
Place of birth for the foreign-born population - Belarus (%)
Place of birth for the foreign-born population - Bosnia and Herzegovina (%)
Place of birth for the foreign-born population - Bulgaria (%)
Place of birth for the foreign-born population - Croatia (%)
Place of birth for the foreign-born population - Czechoslovakia (%)
Place of birth for the foreign-born population - Hungary (%)
Place of birth for the foreign-born population - Latvia (%)
Place of birth for the foreign-born population - Lithuania (%)
Place of birth for the foreign-born population - North Macedonia (Macedonia) (%)
Place of birth for the foreign-born population - Moldova (%)
Place of birth for the foreign-born population - Poland (%)
Place of birth for the foreign-born population - Romania (%)
Place of birth for the foreign-born population - Russia (%)
Place of birth for the foreign-born population - Serbia (%)
Place of birth for the foreign-born population - Ukraine (%)
Place of birth for the foreign-born population - Other Eastern Europe (%)
Place of birth for the foreign-born population - China (%)
Place of birth for the foreign-born population - Hong Kong (%)
Place of birth for the foreign-born population - Taiwan (%)
Place of birth for the foreign-born population - Japan (%)
Place of birth for the foreign-born population - Korea (%)
Place of birth for the foreign-born population - Other Eastern Asia (%)
Place of birth for the foreign-born population - Afghanistan (%)
Place of birth for the foreign-born population - Bangladesh (%)
Place of birth for the foreign-born population - India (%)
Place of birth for the foreign-born population - Iran (%)
Place of birth for the foreign-born population - Kazakhstan (%)
Place of birth for the foreign-born population - Nepal (%)
Place of birth for the foreign-born population - Pakistan (%)
Place of birth for the foreign-born population - Sri Lanka (%)
Place of birth for the foreign-born population - Uzbekistan (%)
Place of birth for the foreign-born population - Other South Central Asia (%)
Place of birth for the foreign-born population - Burma (%)
Place of birth for the foreign-born population - Cambodia (%)
Place of birth for the foreign-born population - Indonesia (%)
Place of birth for the foreign-born population - Laos (%)
Place of birth for the foreign-born population - Malaysia (%)
Place of birth for the foreign-born population - Philippines (%)
Place of birth for the foreign-born population - Singapore (%)
Place of birth for the foreign-born population - Thailand (%)
Place of birth for the foreign-born population - Vietnam (%)
Place of birth for the foreign-born population - Other South Eastern Asia (%)
Place of birth for the foreign-born population - Armenia (%)
Place of birth for the foreign-born population - Iraq (%)
Place of birth for the foreign-born population - Israel (%)
Place of birth for the foreign-born population - Jordan (%)
Place of birth for the foreign-born population - Kuwait (%)
Place of birth for the foreign-born population - Lebanon (%)
Place of birth for the foreign-born population - Saudi Arabia (%)
Place of birth for the foreign-born population - Syria (%)
Place of birth for the foreign-born population - Turkey (%)
Place of birth for the foreign-born population - Yemen (%)
Place of birth for the foreign-born population - Other Western Asia (%)
Place of birth for the foreign-born population - Eritrea (%)
Place of birth for the foreign-born population - Ethiopia (%)
Place of birth for the foreign-born population - Kenya (%)
Place of birth for the foreign-born population - Somalia (%)
Place of birth for the foreign-born population - Uganda (%)
Place of birth for the foreign-born population - Zimbabwe (%)
Place of birth for the foreign-born population - Other Eastern Africa (%)
Place of birth for the foreign-born population - Cameroon (%)
Place of birth for the foreign-born population - Congo (%)
Place of birth for the foreign-born population - Democratic Republic of Congo (Zaire) (%)
Place of birth for the foreign-born population - Other Middle Africa (%)
Place of birth for the foreign-born population - Egypt (%)
Place of birth for the foreign-born population - Morocco (%)
Place of birth for the foreign-born population - Sudan (%)
Place of birth for the foreign-born population - Other Northern Africa (%)
Place of birth for the foreign-born population - South Africa (%)
Place of birth for the foreign-born population - Other Southern Africa (%)
Place of birth for the foreign-born population - Cabo Verde (%)
Place of birth for the foreign-born population - Ghana (%)
Place of birth for the foreign-born population - Liberia (%)
Place of birth for the foreign-born population - Nigeria (%)
Place of birth for the foreign-born population - Senegal (%)
Place of birth for the foreign-born population - Sierra Leone (%)
Place of birth for the foreign-born population - Other Western Africa (%)
Place of birth for the foreign-born population - Australia (%)
Place of birth for the foreign-born population - New Zealand (%)
Place of birth for the foreign-born population - Fiji (%)
Place of birth for the foreign-born population - Micronesia (%)
Place of birth for the foreign-born population - Bahamas (%)
Place of birth for the foreign-born population - Barbados (%)
Place of birth for the foreign-born population - Cuba (%)
Place of birth for the foreign-born population - Dominica (%)
Place of birth for the foreign-born population - Dominican Republic (%)
Place of birth for the foreign-born population - Grenada (%)
Place of birth for the foreign-born population - Haiti (%)
Place of birth for the foreign-born population - Jamaica (%)
Place of birth for the foreign-born population - St. Vincent and the Grenadines (%)
Place of birth for the foreign-born population - Trinidad and Tobago (%)
Place of birth for the foreign-born population - West Indies (%)
Place of birth for the foreign-born population - Other Caribbean (%)
Place of birth for the foreign-born population - Belize (%)
Place of birth for the foreign-born population - Costa Rica (%)
Place of birth for the foreign-born population - El Salvador (%)
Place of birth for the foreign-born population - Guatemala (%)
Place of birth for the foreign-born population - Honduras (%)
Place of birth for the foreign-born population - Mexico (%)
Place of birth for the foreign-born population - Nicaragua (%)
Place of birth for the foreign-born population - Panama (%)
Place of birth for the foreign-born population - Other Central America (%)
Place of birth for the foreign-born population - Argentina (%)
Place of birth for the foreign-born population - Bolivia (%)
Place of birth for the foreign-born population - Brazil (%)
Place of birth for the foreign-born population - Chile (%)
Place of birth for the foreign-born population - Colombia (%)
Place of birth for the foreign-born population - Ecuador (%)
Place of birth for the foreign-born population - Guyana (%)
Place of birth for the foreign-born population - Peru (%)
Place of birth for the foreign-born population - Uruguay (%)
Place of birth for the foreign-born population - Venezuela (%)
Place of birth for the foreign-born population - Other South America (%)
Place of birth for the foreign-born population - Canada (%)
Place of birth for the foreign-born population - Other Northern America (%)
Place of birth for the foreign-born population - Other (%)
Latest news about races in Artesia, NM collected exclusively by city-data.com from local newspapers, TV, and radio stations
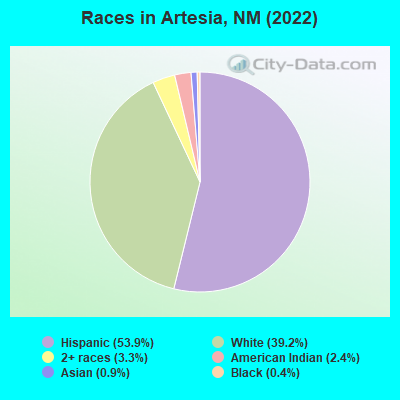
According to 2022 data, the most numerous races in Artesia, NM are Hispanic (6,811 residents), White alone (4,960 residents), and American Indian alone (301 residents). 69.4% of Artesia residents speak English at home. 8.6% of Artesia, NM residents are foreign-born (7.7% born in Latin America), which is 4.4% less than the foreign-born rate of 9.0% across the entire state of New Mexico.
Race distribution in Artesia
2000 2022
813,495 44.7% White alone 765,386 42.1% Hispanic 161,460 8.9% American Indian alone 30,654 1.7% Black alone 25,793 1.4% Two or more races 18,257 1.0% Asian alone 3,009 0.2% Other race alone 992 0.05% Native Hawaiian and Other
1,059,867 50.2% Hispanic 735,478 34.8% White alone 171,808 8.1% American Indian alone 65,084 3.1% Two or more races 36,870 1.7% Black alone 35,870 1.7% Asian alone 7,582 0.4% Other race alone 785 0.04% Native Hawaiian and Other
Income and house value in Artesia Median household income in 2022 $79,297 White non-Hispanic householders$80,053 American Indian and Alaska Native householders$129,818 Asian householders$76,317 Some other race householders$57,034 Two or more races householders$64,208 Hispanic or Latino race householdersMedian 2022 house value $286,741 White Non-Hispanic householders$421,002 Black or African American householders$136,637 American Indian or Alaska Native householders $217,828 Asian householders$213,867 Some other race householders$241,591 Two or more races householders$192,877 Hispanic or Latino householders
Median age by race in Artesia
35.2 Median age for White residents34.4 37.3 -656,596,172.6 Median age for Black or African American residents-648,594,376.9 -670,719,350.9 30.4 Median age for American Indian / Alaska Native residents37.6 16.2 39.9 Median age for Asian residents41.6 39.1 -658,511,722.1 Median age for Native Hawaiian / Pacific Islander residents-685,897,435.2 -659,380,691.5 37.5 Median age for Other race residents36.9 35.5 27.2 Median age for Two or more races residents16.2 40.7 39.5 Median age for White alone residents37.4 40.9 31.4 Median age for Hispanic or Latino residents30.2 35.2
Owner/renter occupied households by race in Artesia
House owners and renters - White residents 2,003 67.6% Owner occupied960 32.4% Renter occupiedHouse owners and renters - Black or African American residents 27 100.0% Owner occupiedHouse owners and renters - American Indian / Alaska Native residents 21 11.6% Owner occupied159 88.4% Renter occupiedHouse owners and renters - Asian residents 33 86.3% Owner occupied5 13.7% Renter occupiedHouse owners and renters - Other race residents 413 77.2% Owner occupied122 22.8% Renter occupiedHouse owners and renters - Two or more races residents 771 65.0% Owner occupied415 35.0% Renter occupiedHouse owners and renters - White alone residents 1,483 71.0% Owner occupied605 29.0% Renter occupiedHouse owners and renters - Hispanic or Latino residents 1,620 64.1% Owner occupied908 35.9% Renter occupied
Language usage in Artesia
English speakers - Total 69.4% of residents of Artesia speak English at home.
29.5% of residents speak Spanish at home 2,433 71.1% Speak English very well989 28.9% Speak English less than very well1.5% of residents speak other language at home 103 57.5% Speak English very well76 42.5% Speak English less than very well
English speakers - Born in the United States 78.0% of residents of Artesia speak English at home.
20.1% of residents speak Spanish at home 615 71.8% Speak English very well241 28.2% Speak English less than very well2.2% of residents speak other language at home 94 100.0% Speak English very well
English speakers - Native, born elsewhere 45.7% of residents of Artesia speak English at home.
46.4% of residents speak Spanish at home 64 100.0% Speak English very well
English speakers - Foreign-born 6.3% of residents of Artesia speak English at home.
80.6% of residents speak Spanish at home 388 44.6% Speak English very well482 55.4% Speak English less than very well8.2% of residents speak other language at home 11 12.4% Speak English very well78 87.6% Speak English less than very well
White (Caucasian) - Speak only English Native:
90.5% (5,545)Foreign-born:
6.1% (7)
White (Caucasian) - Speak another language Native:
9.8% (603)Foreign-born:
100.0% (117)
Other race - Speak another language Native:
58.4% (771)Foreign-born:
98.8% (439)
Two or more races - Speak only English Native:
56.0% (1,375)Foreign-born:
15.1% (92)
Two or more races - Speak another language Native:
44.3% (1,088)Foreign-born:
85.4% (519)
Hispanic or Latino - Speak only English Native:
54.5% (2,896)Foreign-born:
8.2% (80)
Hispanic or Latino - Speak another language Native:
45.3% (2,407)Foreign-born:
91.3% (887)
Foreign-born residents in Artesia 1,089 residents are foreign born (7.7% Latin America ).
This city:
8.6%New Mexico:
9.2%
Marital status for residents in Artesia Marital status - White (Caucasian) population 15 years and over
Males 22.4% Never married64.2% Now married6.7% Separated1.0% Widowed5.7% DivorcedFemales 10.1% Never married65.0% Now married0.5% Separated5.3% Widowed19.1% DivorcedWomen who gave birth in the past 12 months Now married:
85.1% (90)Unmarried:
14.9% (16)
Women who did not give birth in the past 12 months Now married:
75.4% (1,162)Unmarried:
24.6% (379)
Marital status - Black or African American population 15 years and over
Males 0.0% Never married100.0% Now married0.0% Separated0.0% Widowed0.0% DivorcedFemales 0.0% Never married0.0% Now married0.0% Separated100.0% Widowed0.0% DivorcedMarital status - American Indian / Alaska Native population 15 years and over
Males 19.6% Never married25.8% Now married54.6% Separated0.0% Widowed0.0% DivorcedFemales 60.7% Never married10.7% Now married0.0% Separated0.0% Widowed28.6% DivorcedWomen who did not give birth in the past 12 months Now married:
0.0% (0)Unmarried:
100.0% (51)
Marital status - Asian population 15 years and over
Males 0.0% Never married100.0% Now married0.0% Separated0.0% Widowed0.0% DivorcedFemales 0.0% Never married43.4% Now married56.6% Separated0.0% Widowed0.0% DivorcedWomen who gave birth in the past 12 months Now married:
100.0% (7)Unmarried:
0.0% (0)
Women who did not give birth in the past 12 months Now married:
100.0% (71)Unmarried:
0.0% (0)
Marital status - Other race population 15 years and over
Males 48.2% Never married30.2% Now married0.0% Separated7.6% Widowed13.9% DivorcedFemales 42.5% Never married57.5% Now married0.0% Separated0.0% Widowed0.0% DivorcedWomen who did not give birth in the past 12 months Now married:
45.7% (130)Unmarried:
54.3% (155)
Marital status - Two or more races population 15 years and over
Males 46.6% Never married23.7% Now married14.6% Separated9.1% Widowed6.1% DivorcedFemales 48.9% Never married24.4% Now married13.2% Separated2.5% Widowed11.0% DivorcedWomen who gave birth in the past 12 months Now married:
40.5% (52)Unmarried:
59.5% (76)
Women who did not give birth in the past 12 months Now married:
62.7% (292)Unmarried:
37.3% (173)
Marital status - White alone, not Hispanic / Latino population 15 years and over
Males 11.5% Never married78.3% Now married4.1% Separated0.8% Widowed5.3% DivorcedFemales 8.6% Never married65.4% Now married0.8% Separated6.3% Widowed18.9% DivorcedWomen who gave birth in the past 12 months Now married:
38.2% (13)Unmarried:
61.8% (20)
Women who did not give birth in the past 12 months Now married:
87.0% (912)Unmarried:
13.0% (136)
Marital status - Hispanic or Latino population 15 years and over
Males 44.1% Never married36.9% Now married7.6% Separated3.6% Widowed7.7% DivorcedFemales 28.8% Never married49.0% Now married4.3% Separated2.8% Widowed15.2% DivorcedWomen who gave birth in the past 12 months Now married:
68.2% (108)Unmarried:
31.8% (51)
Women who did not give birth in the past 12 months Now married:
59.0% (851)Unmarried:
41.0% (592)
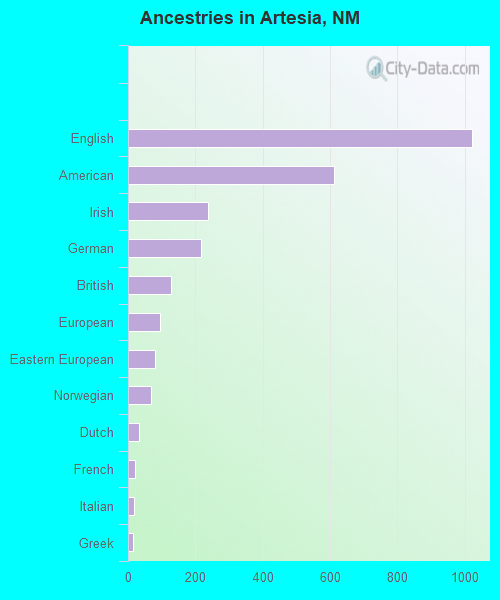
Ancestries in Artesia
1,021 12.7% English612 7.6% American237 3.0% Irish218 2.7% German127 1.6% British95 1.2% European79 1.0% Eastern European69 0.9% Norwegian33 0.4% Dutch21 0.3% French19 0.2% Italian14 0.2% Greek
Children Nativity (place of birth) in Artesia
Children under 6 years - Living with two parents Both parents native 839 100.0% NativeBoth parents foreign-born 36 100.0% NativeOne native, one foreign-born parent 93 100.0% NativeChildren under 6 years - Living with one parent Native parent 259 100.0% NativeChildren 6 to 17 years - Living with two parents Both parents native 872 100.0% Native0 0.0% Foreign-bornBoth parents foreign-born 204 91.8% Native18 8.2% Foreign-bornOne native, one foreign-born parent 195 100.0% NativeChildren 6 to 17 years - Living with one parent Native parent 971 100.0% Native
Grandparents responsible for own grandchildren in Artesia
Grandparents (30 to 59 years) White / Caucasian 12 29.8% Responsible for grandchildren28 70.2% Not responsible for grandchildrenTwo or more races 44 100.0% Responsible for grandchildrenWhite alone, not Hispanic / Latino 31 100.0% Not responsible for grandchildrenHispanic or Latino 45 81.6% Responsible for grandchildren10 18.4% Not responsible for grandchildren
Grandparents (60 years and over) White / Caucasian 15 100.0% Responsible for grandchildrenTwo or more races 34 100.0% Responsible for grandchildrenHispanic or Latino 33 100.0% Responsible for grandchildren