Races in Arcadia, Florida (FL) Detailed Stats
Data:
Races - White alone (%)
Races - White alone (% change since 2000)
Races - Black alone (%)
Races - Black alone (% change since 2000)
Races - American Indian alone (%)
Races - American Indian alone (% change since 2000)
Races - Asian alone (%)
Races - Asian alone (% change since 2000)
Races - Hispanic (%)
Races - Hispanic (% change since 2000)
Races - Native Hawaiian and Other Pacific Islander alone (%)
Races - Native Hawaiian and Other Pacific Islander alone (% change since 2000)
Races - Two or more races(%)
Races - Two or more races(% change since 2000)
Races - Other race alone (%)
Races - Other race alone (% change since 2000)
Racial diversity
Place of birth - Born in state of residence (%)
Place of birth - Born in state of residence (%) - White
Place of birth - Born in state of residence (%) - Black or African American
Place of birth - Born in state of residence (%) - Asian
Place of birth - Born in state of residence (%) - Hispanic or Latino
Place of birth - Born in state of residence (%) - American Indian and Alaska Native
Place of birth - Born in state of residence (%) - Multirace
Place of birth - Born in state of residence (%) - Other Race
Place of birth - Born in other state (%)
Place of birth - Born in other state (%) - White
Place of birth - Born in other state (%) - Black or African American
Place of birth - Born in other state (%) - Asian
Place of birth - Born in other state (%) - Hispanic or Latino
Place of birth - Born in other state (%) - American Indian and Alaska Native
Place of birth - Born in other state (%) - Multirace
Place of birth - Born in other state (%) - Other Race
Place of birth - Native, outside of US (%)
Place of birth - Native, outside of US (%) - White
Place of birth - Native, outside of US (%) - Black or African American
Place of birth - Native, outside of US (%) - Asian
Place of birth - Native, outside of US (%) - Hispanic or Latino
Place of birth - Native, outside of US (%) - American Indian and Alaska Native
Place of birth - Native, outside of US (%) - Multirace
Place of birth - Native, outside of US (%) - Other Race
Place of birth - Foreign born (%)
Place of birth - Foreign born (%) - White
Place of birth - Foreign born (%) - Black or African American
Place of birth - Foreign born (%) - Asian
Place of birth - Foreign born (%) - Hispanic or Latino
Place of birth - Foreign born (%) - American Indian and Alaska Native
Place of birth - Foreign born (%) - Multirace
Place of birth - Foreign born (%) - Other Race
Residents speaking English at home (%)
Residents speaking English at home - Born in the United States (%)
Residents speaking English at home - Native, born elsewhere (%)
Residents speaking English at home - Foreign born (%)
Residents speaking Spanish at home (%)
Residents speaking Spanish at home - Born in the United States (%)
Residents speaking Spanish at home - Native, born elsewhere (%)
Residents speaking Spanish at home - Foreign born (%)
Residents speaking other language at home (%)
Residents speaking other language at home - Born in the United States (%)
Residents speaking other language at home - Native, born elsewhere (%)
Residents speaking other language at home - Foreign born (%)
Marital status - Never married (%)
Marital status - Now married (%)
Marital status - Separated (%)
Marital status - Widowed (%)
Marital status - Divorced (%)
Ancestries Reported - Arab (%)
Ancestries Reported - Czech (%)
Ancestries Reported - Danish (%)
Ancestries Reported - Dutch (%)
Ancestries Reported - English (%)
Ancestries Reported - French (%)
Ancestries Reported - French Canadian (%)
Ancestries Reported - German (%)
Ancestries Reported - Greek (%)
Ancestries Reported - Hungarian (%)
Ancestries Reported - Irish (%)
Ancestries Reported - Italian (%)
Ancestries Reported - Lithuanian (%)
Ancestries Reported - Norwegian (%)
Ancestries Reported - Polish (%)
Ancestries Reported - Portuguese (%)
Ancestries Reported - Russian (%)
Ancestries Reported - Scotch-Irish (%)
Ancestries Reported - Scottish (%)
Ancestries Reported - Slovak (%)
Ancestries Reported - Subsaharan African (%)
Ancestries Reported - Swedish (%)
Ancestries Reported - Swiss (%)
Ancestries Reported - Ukrainian (%)
Ancestries Reported - United States (%)
Ancestries Reported - Welsh (%)
Ancestries Reported - West Indian (%)
Ancestries Reported - Other (%)
Geographical mobility - Same house 1 year ago (%)
Geographical mobility - Same house 1 year ago (%) - White
Geographical mobility - Same house 1 year ago (%) - Black or African American
Geographical mobility - Same house 1 year ago (%) - Asian
Geographical mobility - Same house 1 year ago (%) - Hispanic or Latino
Geographical mobility - Same house 1 year ago (%) - American Indian and Alaska Native
Geographical mobility - Same house 1 year ago (%) - Multirace
Geographical mobility - Same house 1 year ago (%) - Other Race
Geographical mobility - Moved within same county (%)
Geographical mobility - Moved within same county (%) - White
Geographical mobility - Moved within same county (%) - Black or African American
Geographical mobility - Moved within same county (%) - Asian
Geographical mobility - Moved within same county (%) - Hispanic or Latino
Geographical mobility - Moved within same county (%) - American Indian and Alaska Native
Geographical mobility - Moved within same county (%) - Multirace
Geographical mobility - Moved within same county (%) - Other Race
Geographical mobility - Moved from different county within same state (%)
Geographical mobility - Moved from different county within same state (%) - White
Geographical mobility - Moved from different county within same state (%) - Black or African American
Geographical mobility - Moved from different county within same state (%) - Asian
Geographical mobility - Moved from different county within same state (%) - Hispanic or Latino
Geographical mobility - Moved from different county within same state (%) - American Indian and Alaska Native
Geographical mobility - Moved from different county within same state (%) - Multirace
Geographical mobility - Moved from different county within same state (%) - Other Race
Geographical mobility - Moved from different state (%)
Geographical mobility - Moved from different state (%) - White
Geographical mobility - Moved from different state (%) - Black or African American
Geographical mobility - Moved from different state (%) - Asian
Geographical mobility - Moved from different state (%) - Hispanic or Latino
Geographical mobility - Moved from different state (%) - American Indian and Alaska Native
Geographical mobility - Moved from different state (%) - Multirace
Geographical mobility - Moved from different state (%) - Other Race
Geographical mobility - Moved from abroad (%)
Geographical mobility - Moved from abroad (%) - White
Geographical mobility - Moved from abroad (%) - Black or African American
Geographical mobility - Moved from abroad (%) - Asian
Geographical mobility - Moved from abroad (%) - Hispanic or Latino
Geographical mobility - Moved from abroad (%) - American Indian and Alaska Native
Geographical mobility - Moved from abroad (%) - Multirace
Geographical mobility - Moved from abroad (%) - Other Race
Place of birth for the foreign-born population - Ireland (%)
Place of birth for the foreign-born population - Denmark (%)
Place of birth for the foreign-born population - Norway (%)
Place of birth for the foreign-born population - Sweden (%)
Place of birth for the foreign-born population - United Kingdom (%)
Place of birth for the foreign-born population - England (%)
Place of birth for the foreign-born population - Scotland (%)
Place of birth for the foreign-born population - Other Northern Europe (%)
Place of birth for the foreign-born population - Austria (%)
Place of birth for the foreign-born population - Belgium (%)
Place of birth for the foreign-born population - France (%)
Place of birth for the foreign-born population - Germany (%)
Place of birth for the foreign-born population - Netherlands (%)
Place of birth for the foreign-born population - Switzerland (%)
Place of birth for the foreign-born population - Other Western Europe (%)
Place of birth for the foreign-born population - Greece (%)
Place of birth for the foreign-born population - Italy (%)
Place of birth for the foreign-born population - Portugal (%)
Place of birth for the foreign-born population - Spain (%)
Place of birth for the foreign-born population - Other Southern Europe (%)
Place of birth for the foreign-born population - Albania (%)
Place of birth for the foreign-born population - Belarus (%)
Place of birth for the foreign-born population - Bosnia and Herzegovina (%)
Place of birth for the foreign-born population - Bulgaria (%)
Place of birth for the foreign-born population - Croatia (%)
Place of birth for the foreign-born population - Czechoslovakia (%)
Place of birth for the foreign-born population - Hungary (%)
Place of birth for the foreign-born population - Latvia (%)
Place of birth for the foreign-born population - Lithuania (%)
Place of birth for the foreign-born population - North Macedonia (Macedonia) (%)
Place of birth for the foreign-born population - Moldova (%)
Place of birth for the foreign-born population - Poland (%)
Place of birth for the foreign-born population - Romania (%)
Place of birth for the foreign-born population - Russia (%)
Place of birth for the foreign-born population - Serbia (%)
Place of birth for the foreign-born population - Ukraine (%)
Place of birth for the foreign-born population - Other Eastern Europe (%)
Place of birth for the foreign-born population - China (%)
Place of birth for the foreign-born population - Hong Kong (%)
Place of birth for the foreign-born population - Taiwan (%)
Place of birth for the foreign-born population - Japan (%)
Place of birth for the foreign-born population - Korea (%)
Place of birth for the foreign-born population - Other Eastern Asia (%)
Place of birth for the foreign-born population - Afghanistan (%)
Place of birth for the foreign-born population - Bangladesh (%)
Place of birth for the foreign-born population - India (%)
Place of birth for the foreign-born population - Iran (%)
Place of birth for the foreign-born population - Kazakhstan (%)
Place of birth for the foreign-born population - Nepal (%)
Place of birth for the foreign-born population - Pakistan (%)
Place of birth for the foreign-born population - Sri Lanka (%)
Place of birth for the foreign-born population - Uzbekistan (%)
Place of birth for the foreign-born population - Other South Central Asia (%)
Place of birth for the foreign-born population - Burma (%)
Place of birth for the foreign-born population - Cambodia (%)
Place of birth for the foreign-born population - Indonesia (%)
Place of birth for the foreign-born population - Laos (%)
Place of birth for the foreign-born population - Malaysia (%)
Place of birth for the foreign-born population - Philippines (%)
Place of birth for the foreign-born population - Singapore (%)
Place of birth for the foreign-born population - Thailand (%)
Place of birth for the foreign-born population - Vietnam (%)
Place of birth for the foreign-born population - Other South Eastern Asia (%)
Place of birth for the foreign-born population - Armenia (%)
Place of birth for the foreign-born population - Iraq (%)
Place of birth for the foreign-born population - Israel (%)
Place of birth for the foreign-born population - Jordan (%)
Place of birth for the foreign-born population - Kuwait (%)
Place of birth for the foreign-born population - Lebanon (%)
Place of birth for the foreign-born population - Saudi Arabia (%)
Place of birth for the foreign-born population - Syria (%)
Place of birth for the foreign-born population - Turkey (%)
Place of birth for the foreign-born population - Yemen (%)
Place of birth for the foreign-born population - Other Western Asia (%)
Place of birth for the foreign-born population - Eritrea (%)
Place of birth for the foreign-born population - Ethiopia (%)
Place of birth for the foreign-born population - Kenya (%)
Place of birth for the foreign-born population - Somalia (%)
Place of birth for the foreign-born population - Uganda (%)
Place of birth for the foreign-born population - Zimbabwe (%)
Place of birth for the foreign-born population - Other Eastern Africa (%)
Place of birth for the foreign-born population - Cameroon (%)
Place of birth for the foreign-born population - Congo (%)
Place of birth for the foreign-born population - Democratic Republic of Congo (Zaire) (%)
Place of birth for the foreign-born population - Other Middle Africa (%)
Place of birth for the foreign-born population - Egypt (%)
Place of birth for the foreign-born population - Morocco (%)
Place of birth for the foreign-born population - Sudan (%)
Place of birth for the foreign-born population - Other Northern Africa (%)
Place of birth for the foreign-born population - South Africa (%)
Place of birth for the foreign-born population - Other Southern Africa (%)
Place of birth for the foreign-born population - Cabo Verde (%)
Place of birth for the foreign-born population - Ghana (%)
Place of birth for the foreign-born population - Liberia (%)
Place of birth for the foreign-born population - Nigeria (%)
Place of birth for the foreign-born population - Senegal (%)
Place of birth for the foreign-born population - Sierra Leone (%)
Place of birth for the foreign-born population - Other Western Africa (%)
Place of birth for the foreign-born population - Australia (%)
Place of birth for the foreign-born population - New Zealand (%)
Place of birth for the foreign-born population - Fiji (%)
Place of birth for the foreign-born population - Micronesia (%)
Place of birth for the foreign-born population - Bahamas (%)
Place of birth for the foreign-born population - Barbados (%)
Place of birth for the foreign-born population - Cuba (%)
Place of birth for the foreign-born population - Dominica (%)
Place of birth for the foreign-born population - Dominican Republic (%)
Place of birth for the foreign-born population - Grenada (%)
Place of birth for the foreign-born population - Haiti (%)
Place of birth for the foreign-born population - Jamaica (%)
Place of birth for the foreign-born population - St. Vincent and the Grenadines (%)
Place of birth for the foreign-born population - Trinidad and Tobago (%)
Place of birth for the foreign-born population - West Indies (%)
Place of birth for the foreign-born population - Other Caribbean (%)
Place of birth for the foreign-born population - Belize (%)
Place of birth for the foreign-born population - Costa Rica (%)
Place of birth for the foreign-born population - El Salvador (%)
Place of birth for the foreign-born population - Guatemala (%)
Place of birth for the foreign-born population - Honduras (%)
Place of birth for the foreign-born population - Mexico (%)
Place of birth for the foreign-born population - Nicaragua (%)
Place of birth for the foreign-born population - Panama (%)
Place of birth for the foreign-born population - Other Central America (%)
Place of birth for the foreign-born population - Argentina (%)
Place of birth for the foreign-born population - Bolivia (%)
Place of birth for the foreign-born population - Brazil (%)
Place of birth for the foreign-born population - Chile (%)
Place of birth for the foreign-born population - Colombia (%)
Place of birth for the foreign-born population - Ecuador (%)
Place of birth for the foreign-born population - Guyana (%)
Place of birth for the foreign-born population - Peru (%)
Place of birth for the foreign-born population - Uruguay (%)
Place of birth for the foreign-born population - Venezuela (%)
Place of birth for the foreign-born population - Other South America (%)
Place of birth for the foreign-born population - Canada (%)
Place of birth for the foreign-born population - Other Northern America (%)
Place of birth for the foreign-born population - Other (%)
Irish Celtic Festival, Palmetto Heritage Festival, Festival of the Arts, Paul Anka & Baseball, all this weekend! (0 replies)Florida property insurance crisis: "I almost had a heart attack" (213 replies)Millionaires & Billionaires moving to Florida (29 replies)Sign of the times: $121,000 for homeowners insurance in Florida (64 replies)Chillounge, Art Slam, Moonlight Movie, Beertopia, Heritage Days, Jazz & Fairy House Festival all this weekend! (2 replies)Sarasota Rents Are Skyrocketing Again (375 replies)
Latest news about races in Arcadia, FL collected exclusively by city-data.com from local newspapers, TV, and radio stations
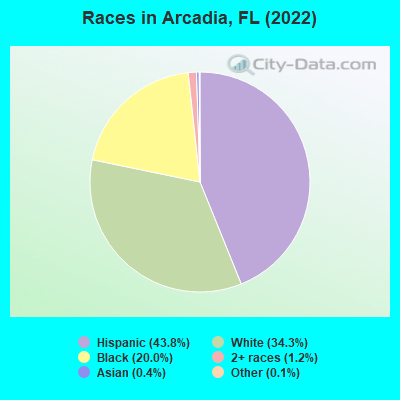
According to 2022 data, the most numerous races in Arcadia, FL are White alone (2,641 residents), Hispanic (3,369 residents), and Black alone (1,537 residents). 77.0% of Arcadia residents speak English at home. 17.1% of Arcadia, FL residents are foreign-born (16.2% born in Latin America), which is 22.4% less than the foreign-born rate of 21.0% across the entire state of Florida.
Race distribution in Arcadia
2000 2022
10,458,509 65.4% White alone 2,682,715 16.8% Hispanic 2,264,268 14.2% Black alone 261,693 1.6% Asian alone 236,954 1.5% Two or more races 42,358 0.3% American Indian alone 28,994 0.2% Other race alone 6,887 0.04% Native Hawaiian and Other
11,309,403 50.8% White alone 6,025,039 27.1% Hispanic 3,241,015 14.6% Black alone 861,630 3.9% Two or more races 623,692 2.8% Asian alone 152,054 0.7% Other race alone 22,504 0.1% American Indian alone 9,486 0.04% Native Hawaiian and Other
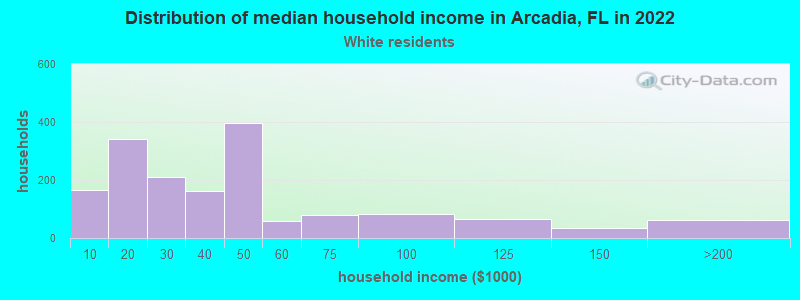
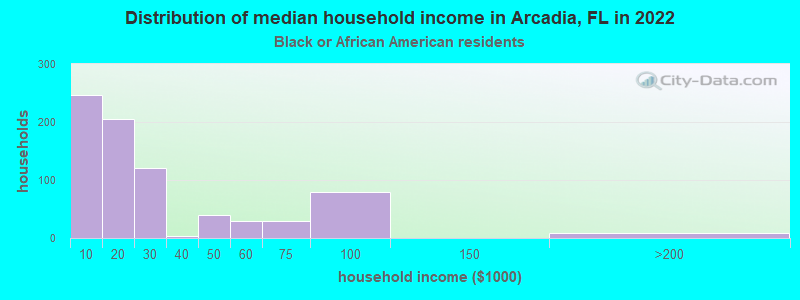
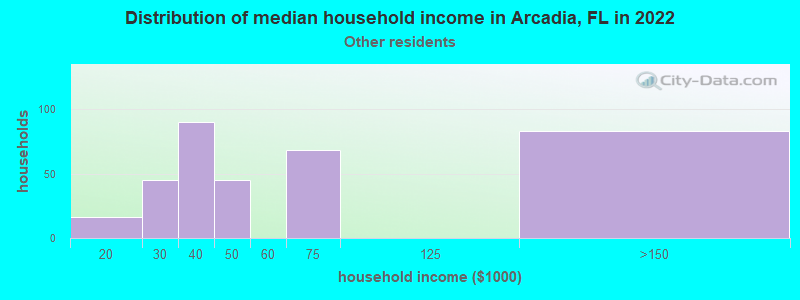
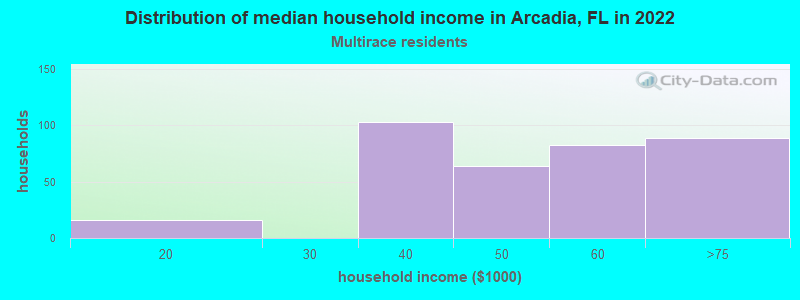
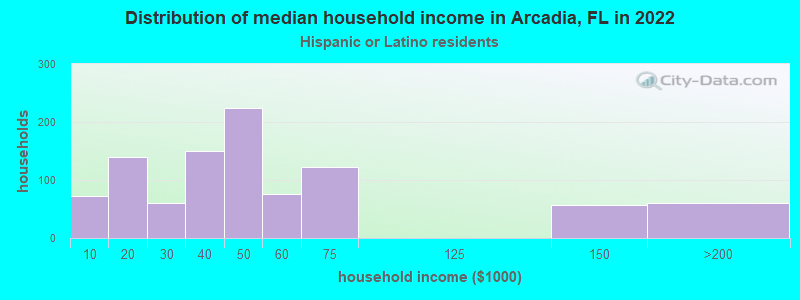
Income and house value in Arcadia Median household income in 2022 $35,826 White non-Hispanic householders$18,028 Black householders$46,018 Some other race householders$47,286 Two or more races householders$43,046 Hispanic or Latino race householdersMedian 2022 house value $207,961 White Non-Hispanic householders$129,603 Black or African American householders $371,949 Asian householders$151,094 Some other race householders$188,785 Two or more races householders$179,197 Hispanic or Latino householders
Median age by race in Arcadia
37.6 Median age for White residents31.0 40.2 50.7 Median age for Black or African American residents53.9 37.0 -598,566,307.6 Median age for American Indian / Alaska Native residents-611,418,047.3 -594,925,633.7 -679,966,749.1 Median age for Asian residents-680,591,818.3 -677,857,713.2 -679,849,340.2 Median age for Native Hawaiian / Pacific Islander residents-858,307,848.3 -443,298,968.6 21.1 Median age for Other race residents23.1 18.2 38.0 Median age for Two or more races residents38.3 31.1 49.8 Median age for White alone residents43.3 50.6 23.2 Median age for Hispanic or Latino residents27.1 19.2
Owner/renter occupied households by race in Arcadia
House owners and renters - White residents 982 58.5% Owner occupied697 41.5% Renter occupiedHouse owners and renters - Black or African American residents 342 44.2% Owner occupied432 55.8% Renter occupiedHouse owners and renters - Other race residents 274 76.0% Owner occupied87 24.0% Renter occupiedHouse owners and renters - Two or more races residents 125 34.5% Owner occupied237 65.5% Renter occupiedHouse owners and renters - White alone residents 878 59.9% Owner occupied588 40.1% Renter occupiedHouse owners and renters - Hispanic or Latino residents 485 49.6% Owner occupied493 50.4% Renter occupied
Language usage in Arcadia
English speakers - Total 77.0% of residents of Arcadia speak English at home.
22.0% of residents speak Spanish at home 880 55.6% Speak English very well702 44.4% Speak English less than very well0.7% of residents speak other language at home 22 41.5% Speak English very well31 58.5% Speak English less than very well
English speakers - Born in the United States 94.4% of residents of Arcadia speak English at home.
4.1% of residents speak Spanish at home 64 100.0% Speak English very well1.3% of residents speak other language at home 21 100.0% Speak English very well
All residents speak only English at home
English speakers - Foreign-born 25.4% of residents of Arcadia speak English at home.
71.5% of residents speak Spanish at home 340 37.1% Speak English very well577 62.9% Speak English less than very well2.4% of residents speak other language at home 31 100.0% Speak English less than very well
White (Caucasian) - Speak only English Native:
94.0% (2,886)Foreign-born:
12.8% (31)
White (Caucasian) - Speak another language Native:
6.2% (191)Foreign-born:
80.9% (197)
Black or African American - Speak only English Native:
95.2% (1,357)Foreign-born:
97.0% (21)
Other race - Speak another language Native:
23.6% (276)Foreign-born:
100.0% (403)
Two or more races - Speak only English Native:
61.4% (239)Foreign-born:
52.6% (408)
Two or more races - Speak another language Native:
37.7% (147)Foreign-born:
44.5% (345)
White alone - Speak only English Native:
99.9% (2,547)Foreign-born:
100.0% (20)
Hispanic or Latino - Speak only English Native:
66.8% (1,268)Foreign-born:
24.1% (291)
Hispanic or Latino - Speak another language Native:
36.0% (684)Foreign-born:
76.1% (919)
Foreign-born residents in Arcadia 1,319 residents are foreign born (16.2% Latin America ).
This city:
17.1%Florida:
21.1%
Marital status for residents in Arcadia Marital status - White (Caucasian) population 15 years and over
Males 37.3% Never married37.9% Now married3.4% Separated4.7% Widowed16.7% DivorcedFemales 28.2% Never married22.7% Now married0.0% Separated22.2% Widowed27.0% DivorcedWomen who gave birth in the past 12 months Now married:
0.0% (0)Unmarried:
100.0% (36)
Women who did not give birth in the past 12 months Now married:
28.6% (192)Unmarried:
71.4% (479)
Marital status - Black or African American population 15 years and over
Males 58.6% Never married15.0% Now married17.3% Separated1.8% Widowed7.3% DivorcedFemales 55.5% Never married17.7% Now married0.9% Separated9.3% Widowed16.7% DivorcedWomen who gave birth in the past 12 months Now married:
0.0% (0)Unmarried:
100.0% (27)
Women who did not give birth in the past 12 months Now married:
0.0% (0)Unmarried:
100.0% (386)
Marital status - Other race population 15 years and over
Males 63.9% Never married11.9% Now married0.0% Separated0.0% Widowed24.2% DivorcedFemales 60.4% Never married7.0% Now married21.1% Separated0.0% Widowed11.4% DivorcedWomen who gave birth in the past 12 months Now married:
100.0% (16)Unmarried:
0.0% (0)
Women who did not give birth in the past 12 months Now married:
26.0% (133)Unmarried:
74.0% (380)
Marital status - Two or more races population 15 years and over
Males 63.1% Never married2.1% Now married10.6% Separated21.5% Widowed2.7% DivorcedFemales 55.1% Never married0.0% Now married0.0% Separated0.0% Widowed44.9% DivorcedWomen who did not give birth in the past 12 months Now married:
0.0% (0)Unmarried:
100.0% (369)
Marital status - White alone, not Hispanic / Latino population 15 years and over
Males 30.3% Never married40.6% Now married0.0% Separated7.5% Widowed21.7% DivorcedFemales 25.2% Never married20.6% Now married0.0% Separated25.1% Widowed29.1% DivorcedWomen who gave birth in the past 12 months Now married:
0.0% (0)Unmarried:
100.0% (15)
Women who did not give birth in the past 12 months Now married:
25.7% (161)Unmarried:
74.3% (466)
Marital status - Hispanic or Latino population 15 years and over
Males 60.3% Never married16.8% Now married6.2% Separated5.6% Widowed11.2% DivorcedFemales 54.5% Never married12.7% Now married8.8% Separated1.6% Widowed22.4% DivorcedWomen who gave birth in the past 12 months Now married:
28.9% (11)Unmarried:
71.1% (28)
Women who did not give birth in the past 12 months Now married:
20.5% (159)Unmarried:
79.5% (617)
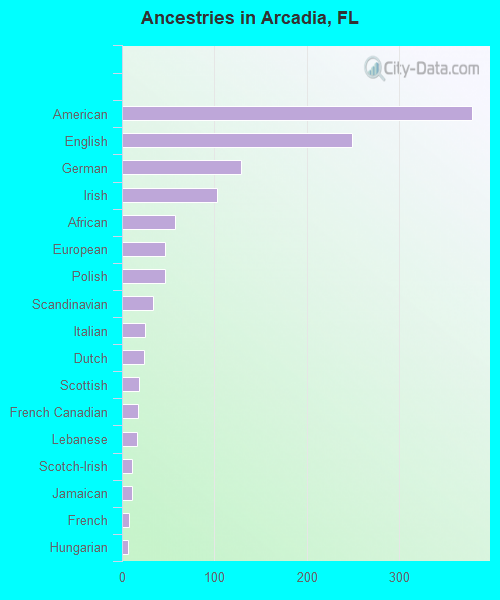
Ancestries in Arcadia
378 8.0% American249 5.2% English129 2.7% German103 2.2% Irish57 1.2% African47 1.0% European46 1.0% Polish33 0.7% Scandinavian25 0.5% Italian24 0.5% Dutch18 0.4% Scottish17 0.4% French Canadian16 0.3% Lebanese11 0.2% Scotch-Irish11 0.2% Jamaican8 0.2% French7 0.1% Hungarian
Children Nativity (place of birth) in Arcadia
Children under 6 years - Living with two parents Both parents native 92 100.0% NativeBoth parents foreign-born 9 100.0% NativeOne native, one foreign-born parent 9 100.0% NativeChildren under 6 years - Living with one parent Native parent 288 99.7% Native1 0.3% Foreign-bornForeign-born parent 104 72.5% Native39 27.5% Foreign-bornChildren 6 to 17 years - Living with two parents Both parents native 182 100.0% NativeBoth parents foreign-born 30 100.0% NativeOne native, one foreign-born parent 75 100.0% NativeChildren 6 to 17 years - Living with one parent Native parent 415 100.0% NativeForeign-born parent 338 51.5% Native318 48.5% Foreign-born
Grandparents responsible for own grandchildren in Arcadia
Grandparents (30 to 59 years) White / Caucasian 22 100.0% Responsible for grandchildrenWhite alone, not Hispanic / Latino 26 100.0% Responsible for grandchildrenGrandparents (60 years and over) White / Caucasian 68 80.9% Responsible for grandchildren16 19.1% Not responsible for grandchildrenWhite alone, not Hispanic / Latino 73 78.3% Responsible for grandchildren20 21.7% Not responsible for grandchildren