Races in Appling, Georgia (GA) Detailed Stats
Ancestries, Foreign-born residents, place of birth
Data:
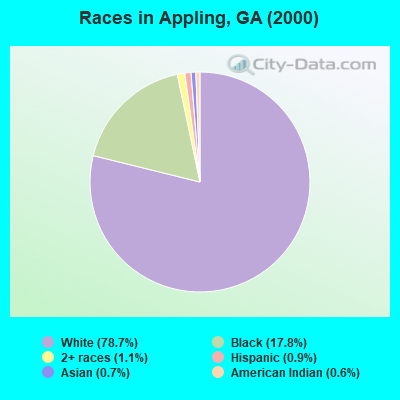
Race distribution in Appling

- 5,28678.7%White alone
- 1,19817.8%Black alone
- 741.1%Two or more races
- 620.9%Hispanic
- 480.7%Asian alone
- 380.6%American Indian alone
- 50.07%Native Hawaiian and Other
Pacific Islander alone
- 40.06%Other race alone
2000
2022
-
- 5,128,66162.6%White alone
- 2,331,46528.5%Black alone
- 435,2275.3%Hispanic
- 171,5132.1%Asian alone
- 87,3641.1%Two or more races
- 17,6700.2%American Indian alone
- 11,2750.1%Other race alone
- 3,2780.04%Native Hawaiian and Other
Pacific Islander alone
-
- 5,415,65749.6%White alone
- 3,349,24030.7%Black alone
- 1,132,60410.4%Hispanic
- 479,1564.4%Asian alone
- 462,9234.2%Two or more races
- 54,4160.5%Other race alone
- 11,9230.1%American Indian alone
- 6,9570.06%Native Hawaiian and Other
Pacific Islander alone
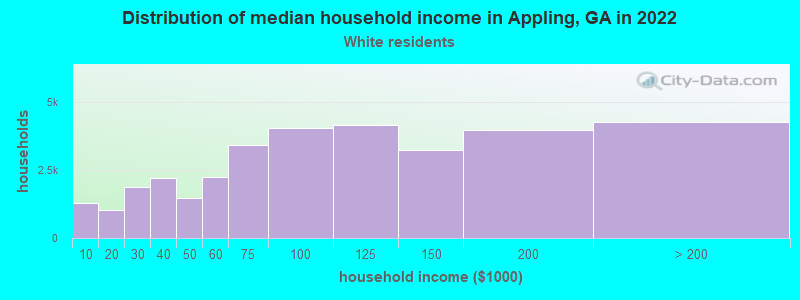
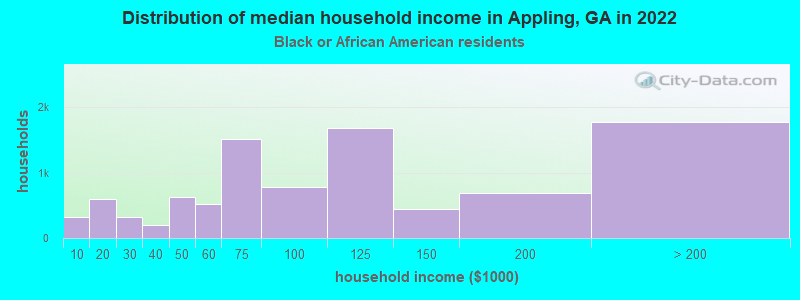
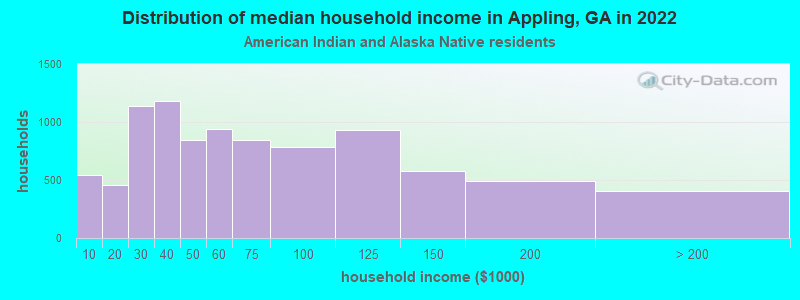
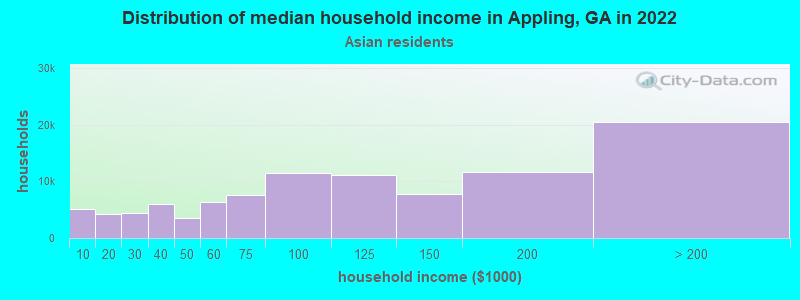
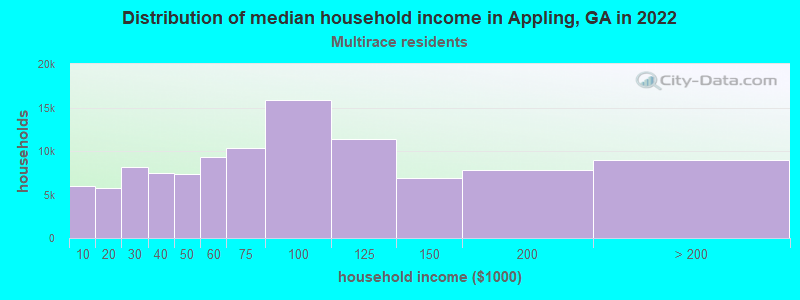
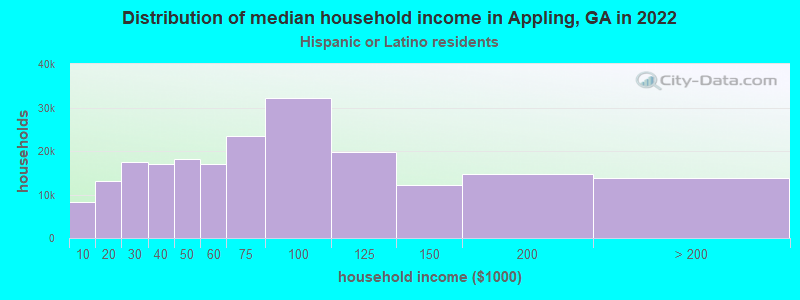
Income and house value in Appling
- Median household income in 2022
- $80,926White non-Hispanic householders
- $83,130Black householders
- $124,897Asian householders
- $3,187Some other race householders
- $49,059Two or more races householders
- $71,161Hispanic or Latino race householders
- Median 2022 house value
- $331,515White Non-Hispanic householders
- $167,739Black or African American householders
- $330,195American Indian or Alaska Native householders
- $363,214Asian householders
- $171,701Some other race householders
- $145,285Two or more races householders
- $241,174Hispanic or Latino householders