Races in Antioch, Illinois (IL) Detailed Stats
Data:
Races - White alone (%)
Races - White alone (% change since 2000)
Races - Black alone (%)
Races - Black alone (% change since 2000)
Races - American Indian alone (%)
Races - American Indian alone (% change since 2000)
Races - Asian alone (%)
Races - Asian alone (% change since 2000)
Races - Hispanic (%)
Races - Hispanic (% change since 2000)
Races - Native Hawaiian and Other Pacific Islander alone (%)
Races - Native Hawaiian and Other Pacific Islander alone (% change since 2000)
Races - Two or more races(%)
Races - Two or more races(% change since 2000)
Races - Other race alone (%)
Races - Other race alone (% change since 2000)
Racial diversity
Place of birth - Born in state of residence (%)
Place of birth - Born in state of residence (%) - White
Place of birth - Born in state of residence (%) - Black or African American
Place of birth - Born in state of residence (%) - Asian
Place of birth - Born in state of residence (%) - Hispanic or Latino
Place of birth - Born in state of residence (%) - American Indian and Alaska Native
Place of birth - Born in state of residence (%) - Multirace
Place of birth - Born in state of residence (%) - Other Race
Place of birth - Born in other state (%)
Place of birth - Born in other state (%) - White
Place of birth - Born in other state (%) - Black or African American
Place of birth - Born in other state (%) - Asian
Place of birth - Born in other state (%) - Hispanic or Latino
Place of birth - Born in other state (%) - American Indian and Alaska Native
Place of birth - Born in other state (%) - Multirace
Place of birth - Born in other state (%) - Other Race
Place of birth - Native, outside of US (%)
Place of birth - Native, outside of US (%) - White
Place of birth - Native, outside of US (%) - Black or African American
Place of birth - Native, outside of US (%) - Asian
Place of birth - Native, outside of US (%) - Hispanic or Latino
Place of birth - Native, outside of US (%) - American Indian and Alaska Native
Place of birth - Native, outside of US (%) - Multirace
Place of birth - Native, outside of US (%) - Other Race
Place of birth - Foreign born (%)
Place of birth - Foreign born (%) - White
Place of birth - Foreign born (%) - Black or African American
Place of birth - Foreign born (%) - Asian
Place of birth - Foreign born (%) - Hispanic or Latino
Place of birth - Foreign born (%) - American Indian and Alaska Native
Place of birth - Foreign born (%) - Multirace
Place of birth - Foreign born (%) - Other Race
Residents speaking English at home (%)
Residents speaking English at home - Born in the United States (%)
Residents speaking English at home - Native, born elsewhere (%)
Residents speaking English at home - Foreign born (%)
Residents speaking Spanish at home (%)
Residents speaking Spanish at home - Born in the United States (%)
Residents speaking Spanish at home - Native, born elsewhere (%)
Residents speaking Spanish at home - Foreign born (%)
Residents speaking other language at home (%)
Residents speaking other language at home - Born in the United States (%)
Residents speaking other language at home - Native, born elsewhere (%)
Residents speaking other language at home - Foreign born (%)
Marital status - Never married (%)
Marital status - Now married (%)
Marital status - Separated (%)
Marital status - Widowed (%)
Marital status - Divorced (%)
Ancestries Reported - Arab (%)
Ancestries Reported - Czech (%)
Ancestries Reported - Danish (%)
Ancestries Reported - Dutch (%)
Ancestries Reported - English (%)
Ancestries Reported - French (%)
Ancestries Reported - French Canadian (%)
Ancestries Reported - German (%)
Ancestries Reported - Greek (%)
Ancestries Reported - Hungarian (%)
Ancestries Reported - Irish (%)
Ancestries Reported - Italian (%)
Ancestries Reported - Lithuanian (%)
Ancestries Reported - Norwegian (%)
Ancestries Reported - Polish (%)
Ancestries Reported - Portuguese (%)
Ancestries Reported - Russian (%)
Ancestries Reported - Scotch-Irish (%)
Ancestries Reported - Scottish (%)
Ancestries Reported - Slovak (%)
Ancestries Reported - Subsaharan African (%)
Ancestries Reported - Swedish (%)
Ancestries Reported - Swiss (%)
Ancestries Reported - Ukrainian (%)
Ancestries Reported - United States (%)
Ancestries Reported - Welsh (%)
Ancestries Reported - West Indian (%)
Ancestries Reported - Other (%)
Geographical mobility - Same house 1 year ago (%)
Geographical mobility - Same house 1 year ago (%) - White
Geographical mobility - Same house 1 year ago (%) - Black or African American
Geographical mobility - Same house 1 year ago (%) - Asian
Geographical mobility - Same house 1 year ago (%) - Hispanic or Latino
Geographical mobility - Same house 1 year ago (%) - American Indian and Alaska Native
Geographical mobility - Same house 1 year ago (%) - Multirace
Geographical mobility - Same house 1 year ago (%) - Other Race
Geographical mobility - Moved within same county (%)
Geographical mobility - Moved within same county (%) - White
Geographical mobility - Moved within same county (%) - Black or African American
Geographical mobility - Moved within same county (%) - Asian
Geographical mobility - Moved within same county (%) - Hispanic or Latino
Geographical mobility - Moved within same county (%) - American Indian and Alaska Native
Geographical mobility - Moved within same county (%) - Multirace
Geographical mobility - Moved within same county (%) - Other Race
Geographical mobility - Moved from different county within same state (%)
Geographical mobility - Moved from different county within same state (%) - White
Geographical mobility - Moved from different county within same state (%) - Black or African American
Geographical mobility - Moved from different county within same state (%) - Asian
Geographical mobility - Moved from different county within same state (%) - Hispanic or Latino
Geographical mobility - Moved from different county within same state (%) - American Indian and Alaska Native
Geographical mobility - Moved from different county within same state (%) - Multirace
Geographical mobility - Moved from different county within same state (%) - Other Race
Geographical mobility - Moved from different state (%)
Geographical mobility - Moved from different state (%) - White
Geographical mobility - Moved from different state (%) - Black or African American
Geographical mobility - Moved from different state (%) - Asian
Geographical mobility - Moved from different state (%) - Hispanic or Latino
Geographical mobility - Moved from different state (%) - American Indian and Alaska Native
Geographical mobility - Moved from different state (%) - Multirace
Geographical mobility - Moved from different state (%) - Other Race
Geographical mobility - Moved from abroad (%)
Geographical mobility - Moved from abroad (%) - White
Geographical mobility - Moved from abroad (%) - Black or African American
Geographical mobility - Moved from abroad (%) - Asian
Geographical mobility - Moved from abroad (%) - Hispanic or Latino
Geographical mobility - Moved from abroad (%) - American Indian and Alaska Native
Geographical mobility - Moved from abroad (%) - Multirace
Geographical mobility - Moved from abroad (%) - Other Race
Place of birth for the foreign-born population - Ireland (%)
Place of birth for the foreign-born population - Denmark (%)
Place of birth for the foreign-born population - Norway (%)
Place of birth for the foreign-born population - Sweden (%)
Place of birth for the foreign-born population - United Kingdom (%)
Place of birth for the foreign-born population - England (%)
Place of birth for the foreign-born population - Scotland (%)
Place of birth for the foreign-born population - Other Northern Europe (%)
Place of birth for the foreign-born population - Austria (%)
Place of birth for the foreign-born population - Belgium (%)
Place of birth for the foreign-born population - France (%)
Place of birth for the foreign-born population - Germany (%)
Place of birth for the foreign-born population - Netherlands (%)
Place of birth for the foreign-born population - Switzerland (%)
Place of birth for the foreign-born population - Other Western Europe (%)
Place of birth for the foreign-born population - Greece (%)
Place of birth for the foreign-born population - Italy (%)
Place of birth for the foreign-born population - Portugal (%)
Place of birth for the foreign-born population - Spain (%)
Place of birth for the foreign-born population - Other Southern Europe (%)
Place of birth for the foreign-born population - Albania (%)
Place of birth for the foreign-born population - Belarus (%)
Place of birth for the foreign-born population - Bosnia and Herzegovina (%)
Place of birth for the foreign-born population - Bulgaria (%)
Place of birth for the foreign-born population - Croatia (%)
Place of birth for the foreign-born population - Czechoslovakia (%)
Place of birth for the foreign-born population - Hungary (%)
Place of birth for the foreign-born population - Latvia (%)
Place of birth for the foreign-born population - Lithuania (%)
Place of birth for the foreign-born population - North Macedonia (Macedonia) (%)
Place of birth for the foreign-born population - Moldova (%)
Place of birth for the foreign-born population - Poland (%)
Place of birth for the foreign-born population - Romania (%)
Place of birth for the foreign-born population - Russia (%)
Place of birth for the foreign-born population - Serbia (%)
Place of birth for the foreign-born population - Ukraine (%)
Place of birth for the foreign-born population - Other Eastern Europe (%)
Place of birth for the foreign-born population - China (%)
Place of birth for the foreign-born population - Hong Kong (%)
Place of birth for the foreign-born population - Taiwan (%)
Place of birth for the foreign-born population - Japan (%)
Place of birth for the foreign-born population - Korea (%)
Place of birth for the foreign-born population - Other Eastern Asia (%)
Place of birth for the foreign-born population - Afghanistan (%)
Place of birth for the foreign-born population - Bangladesh (%)
Place of birth for the foreign-born population - India (%)
Place of birth for the foreign-born population - Iran (%)
Place of birth for the foreign-born population - Kazakhstan (%)
Place of birth for the foreign-born population - Nepal (%)
Place of birth for the foreign-born population - Pakistan (%)
Place of birth for the foreign-born population - Sri Lanka (%)
Place of birth for the foreign-born population - Uzbekistan (%)
Place of birth for the foreign-born population - Other South Central Asia (%)
Place of birth for the foreign-born population - Burma (%)
Place of birth for the foreign-born population - Cambodia (%)
Place of birth for the foreign-born population - Indonesia (%)
Place of birth for the foreign-born population - Laos (%)
Place of birth for the foreign-born population - Malaysia (%)
Place of birth for the foreign-born population - Philippines (%)
Place of birth for the foreign-born population - Singapore (%)
Place of birth for the foreign-born population - Thailand (%)
Place of birth for the foreign-born population - Vietnam (%)
Place of birth for the foreign-born population - Other South Eastern Asia (%)
Place of birth for the foreign-born population - Armenia (%)
Place of birth for the foreign-born population - Iraq (%)
Place of birth for the foreign-born population - Israel (%)
Place of birth for the foreign-born population - Jordan (%)
Place of birth for the foreign-born population - Kuwait (%)
Place of birth for the foreign-born population - Lebanon (%)
Place of birth for the foreign-born population - Saudi Arabia (%)
Place of birth for the foreign-born population - Syria (%)
Place of birth for the foreign-born population - Turkey (%)
Place of birth for the foreign-born population - Yemen (%)
Place of birth for the foreign-born population - Other Western Asia (%)
Place of birth for the foreign-born population - Eritrea (%)
Place of birth for the foreign-born population - Ethiopia (%)
Place of birth for the foreign-born population - Kenya (%)
Place of birth for the foreign-born population - Somalia (%)
Place of birth for the foreign-born population - Uganda (%)
Place of birth for the foreign-born population - Zimbabwe (%)
Place of birth for the foreign-born population - Other Eastern Africa (%)
Place of birth for the foreign-born population - Cameroon (%)
Place of birth for the foreign-born population - Congo (%)
Place of birth for the foreign-born population - Democratic Republic of Congo (Zaire) (%)
Place of birth for the foreign-born population - Other Middle Africa (%)
Place of birth for the foreign-born population - Egypt (%)
Place of birth for the foreign-born population - Morocco (%)
Place of birth for the foreign-born population - Sudan (%)
Place of birth for the foreign-born population - Other Northern Africa (%)
Place of birth for the foreign-born population - South Africa (%)
Place of birth for the foreign-born population - Other Southern Africa (%)
Place of birth for the foreign-born population - Cabo Verde (%)
Place of birth for the foreign-born population - Ghana (%)
Place of birth for the foreign-born population - Liberia (%)
Place of birth for the foreign-born population - Nigeria (%)
Place of birth for the foreign-born population - Senegal (%)
Place of birth for the foreign-born population - Sierra Leone (%)
Place of birth for the foreign-born population - Other Western Africa (%)
Place of birth for the foreign-born population - Australia (%)
Place of birth for the foreign-born population - New Zealand (%)
Place of birth for the foreign-born population - Fiji (%)
Place of birth for the foreign-born population - Micronesia (%)
Place of birth for the foreign-born population - Bahamas (%)
Place of birth for the foreign-born population - Barbados (%)
Place of birth for the foreign-born population - Cuba (%)
Place of birth for the foreign-born population - Dominica (%)
Place of birth for the foreign-born population - Dominican Republic (%)
Place of birth for the foreign-born population - Grenada (%)
Place of birth for the foreign-born population - Haiti (%)
Place of birth for the foreign-born population - Jamaica (%)
Place of birth for the foreign-born population - St. Vincent and the Grenadines (%)
Place of birth for the foreign-born population - Trinidad and Tobago (%)
Place of birth for the foreign-born population - West Indies (%)
Place of birth for the foreign-born population - Other Caribbean (%)
Place of birth for the foreign-born population - Belize (%)
Place of birth for the foreign-born population - Costa Rica (%)
Place of birth for the foreign-born population - El Salvador (%)
Place of birth for the foreign-born population - Guatemala (%)
Place of birth for the foreign-born population - Honduras (%)
Place of birth for the foreign-born population - Mexico (%)
Place of birth for the foreign-born population - Nicaragua (%)
Place of birth for the foreign-born population - Panama (%)
Place of birth for the foreign-born population - Other Central America (%)
Place of birth for the foreign-born population - Argentina (%)
Place of birth for the foreign-born population - Bolivia (%)
Place of birth for the foreign-born population - Brazil (%)
Place of birth for the foreign-born population - Chile (%)
Place of birth for the foreign-born population - Colombia (%)
Place of birth for the foreign-born population - Ecuador (%)
Place of birth for the foreign-born population - Guyana (%)
Place of birth for the foreign-born population - Peru (%)
Place of birth for the foreign-born population - Uruguay (%)
Place of birth for the foreign-born population - Venezuela (%)
Place of birth for the foreign-born population - Other South America (%)
Place of birth for the foreign-born population - Canada (%)
Place of birth for the foreign-born population - Other Northern America (%)
Place of birth for the foreign-born population - Other (%)
Latest news about races in Antioch, IL collected exclusively by city-data.com from local newspapers, TV, and radio stations
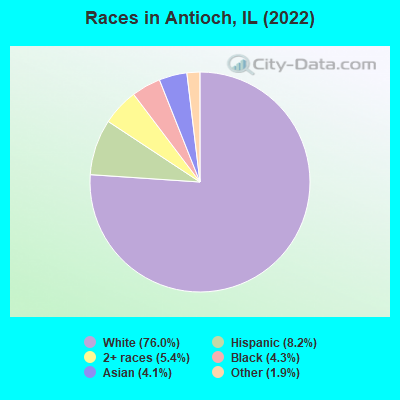
According to 2022 data, the most numerous races in Antioch, IL are White alone (11,119 residents), Hispanic (1,202 residents), and Black alone (624 residents). 86.7% of Antioch residents speak English at home. 7.6% of Antioch, IL residents are foreign-born (2.7% born in Asia, 2.2% born in Europe, 1.8% born in Latin America, 0.8% born in Africa), which is 85.2% less than the foreign-born rate of 14.0% across the entire state of Illinois.
Race distribution in Antioch
2000 2022
8,424,140 67.8% White alone 1,856,152 14.9% Black alone 1,530,262 12.3% Hispanic 419,916 3.4% Asian alone 153,996 1.2% Two or more races 13,479 0.1% Other race alone 18,232 0.1% American Indian alone 3,116 0.03% Native Hawaiian and Other
7,356,301 58.5% White alone 2,299,726 18.3% Hispanic 1,660,423 13.2% Black alone 747,296 5.9% Asian alone 458,599 3.6% Two or more races 45,386 0.4% Other race alone 10,405 0.08% American Indian alone 3,896 0.03% Native Hawaiian and Other
Income and house value in Antioch Median household income in 2022 $115,944 White non-Hispanic householders$42,393 Black householders$105,128 American Indian and Alaska Native householders$151,247 Asian householders$94,892 Some other race householders$94,710 Hispanic or Latino race householdersMedian 2022 house value $282,482 White Non-Hispanic householders$468,815 Black or African American householders $309,077 Asian householders$198,266 Some other race householdersover $1,000,000 Two or more races householders$246,170 Hispanic or Latino householders
Median age by race in Antioch
43.8 Median age for White residents43.5 44.9 18.0 Median age for Black or African American residents14.5 34.7 57.7 Median age for American Indian / Alaska Native residents58.8 56.2 50.2 Median age for Asian residents48.3 50.7 -593,236,714.4 Median age for Native Hawaiian / Pacific Islander residents-658,536,584.7 -576,015,108.0 29.0 Median age for Other race residents30.2 29.2 20.3 Median age for Two or more races residents19.5 24.5 42.4 Median age for White alone residents41.6 44.7 34.5 Median age for Hispanic or Latino residents42.0 29.0
Owner/renter occupied households by race in Antioch
House owners and renters - White residents 3,239 76.9% Owner occupied971 23.1% Renter occupiedHouse owners and renters - Black or African American residents 47 20.4% Owner occupied183 79.6% Renter occupiedHouse owners and renters - American Indian / Alaska Native residents 34 100.0% Owner occupiedHouse owners and renters - Asian residents 210 95.3% Owner occupied10 4.7% Renter occupiedHouse owners and renters - Other race residents 130 83.8% Owner occupied25 16.2% Renter occupiedHouse owners and renters - Two or more races residents 206 57.9% Owner occupied150 42.1% Renter occupiedHouse owners and renters - White alone residents 3,225 76.7% Owner occupied977 23.3% Renter occupiedHouse owners and renters - Hispanic or Latino residents 316 65.3% Owner occupied168 34.7% Renter occupied
Language usage in Antioch
English speakers - Total 86.7% of residents of Antioch speak English at home.
5.0% of residents speak Spanish at home 523 74.1% Speak English very well183 25.9% Speak English less than very well7.4% of residents speak other language at home 947 90.9% Speak English very well95 9.1% Speak English less than very well
English speakers - Born in the United States 94.9% of residents of Antioch speak English at home.
1.7% of residents speak Spanish at home 53 100.0% Speak English very well2.8% of residents speak other language at home 87 100.0% Speak English very well
English speakers - Native, born elsewhere 60.5% of residents of Antioch speak English at home.
26.5% of residents speak Spanish at home 43 100.0% Speak English very well14.8% of residents speak other language at home 24 100.0% Speak English less than very well
English speakers - Foreign-born 16.8% of residents of Antioch speak English at home.
21.0% of residents speak Spanish at home 96 39.7% Speak English very well146 60.3% Speak English less than very well60.0% of residents speak other language at home 614 88.7% Speak English very well78 11.3% Speak English less than very well
White (Caucasian) - Speak only English Native:
100.0% (10,077)Foreign-born:
23.0% (76)
White (Caucasian) - Speak another language Native:
1.8% (179)Foreign-born:
75.4% (250)
Black or African American - Speak only English Native:
91.2% (510)Foreign-born:
38.7% (14)
Black or African American - Speak another language Native:
9.3% (52)Foreign-born:
61.3% (23)
American Indian / Alaska Native - Speak another language Native:
63.5% (22)Foreign-born:
100.0% (77)
Asian - Speak only English Native:
40.1% (91)Foreign-born:
6.9% (25)
Asian - Speak another language Native:
62.8% (142)Foreign-born:
93.4% (347)
Other race - Speak only English Native:
62.8% (309)Foreign-born:
58.8% (109)
Other race - Speak another language Native:
42.9% (211)Foreign-born:
62.3% (115)
Two or more races - Speak another language Native:
20.2% (230)Foreign-born:
100.0% (94)
White alone - Speak only English Native:
98.5% (10,083)Foreign-born:
17.5% (73)
White alone - Speak another language Native:
1.7% (171)Foreign-born:
81.8% (340)
Hispanic or Latino - Speak only English Native:
70.5% (629)Foreign-born:
37.6% (98)
Hispanic or Latino - Speak another language Native:
32.1% (286)Foreign-born:
72.5% (190)
Foreign-born residents in Antioch 1,106 residents are foreign born (2.7% Asia , 2.2% Europe , 1.8% Latin America , 0.8% Africa ).
This city:
7.6%Illinois:
14.1%
Marital status for residents in Antioch Marital status - White (Caucasian) population 15 years and over
Males 33.0% Never married53.9% Now married0.4% Separated1.6% Widowed11.0% DivorcedFemales 30.1% Never married49.9% Now married0.4% Separated7.6% Widowed11.9% DivorcedWomen who gave birth in the past 12 months Now married:
83.7% (68)Unmarried:
16.3% (13)
Women who did not give birth in the past 12 months Now married:
46.6% (1,187)Unmarried:
53.4% (1,360)
Marital status - Black or African American population 15 years and over
Males 74.1% Never married25.9% Now married0.0% Separated0.0% Widowed0.0% DivorcedFemales 69.3% Never married20.2% Now married3.5% Separated0.0% Widowed7.0% DivorcedWomen who gave birth in the past 12 months Now married:
0.0% (0)Unmarried:
100.0% (19)
Women who did not give birth in the past 12 months Now married:
15.2% (23)Unmarried:
84.8% (127)
Marital status - American Indian / Alaska Native population 15 years and over
Males 35.1% Never married64.9% Now married0.0% Separated0.0% Widowed0.0% DivorcedFemales 0.0% Never married53.6% Now married0.0% Separated0.0% Widowed46.4% DivorcedWomen who did not give birth in the past 12 months Now married:
0.0% (0)Unmarried:
100.0% (5)
Marital status - Asian population 15 years and over
Males 33.6% Never married66.4% Now married0.0% Separated0.0% Widowed0.0% DivorcedFemales 6.3% Never married77.8% Now married0.0% Separated15.8% Widowed0.0% DivorcedWomen who did not give birth in the past 12 months Now married:
88.1% (144)Unmarried:
11.9% (20)
Marital status - Other race population 15 years and over
Males 54.6% Never married40.8% Now married0.0% Separated0.0% Widowed4.6% DivorcedFemales 50.0% Never married33.7% Now married0.0% Separated0.0% Widowed16.3% DivorcedWomen who did not give birth in the past 12 months Now married:
13.0% (24)Unmarried:
87.0% (163)
Marital status - Two or more races population 15 years and over
Males 46.9% Never married49.0% Now married0.0% Separated4.1% Widowed0.0% DivorcedFemales 49.8% Never married40.3% Now married0.0% Separated0.0% Widowed9.9% DivorcedWomen who did not give birth in the past 12 months Now married:
34.3% (104)Unmarried:
65.7% (199)
Marital status - White alone, not Hispanic / Latino population 15 years and over
Males 33.4% Never married54.4% Now married0.4% Separated1.7% Widowed10.0% DivorcedFemales 30.1% Never married49.9% Now married0.4% Separated7.8% Widowed11.8% DivorcedWomen who gave birth in the past 12 months Now married:
82.4% (66)Unmarried:
17.6% (14)
Women who did not give birth in the past 12 months Now married:
46.5% (1,217)Unmarried:
53.5% (1,402)
Marital status - Hispanic or Latino population 15 years and over
Males 35.4% Never married47.6% Now married0.0% Separated0.0% Widowed17.0% DivorcedFemales 48.0% Never married33.0% Now married0.0% Separated0.0% Widowed19.1% DivorcedWomen who gave birth in the past 12 months Now married:
100.0% (7)Unmarried:
0.0% (0)
Women who did not give birth in the past 12 months Now married:
23.5% (97)Unmarried:
76.5% (314)
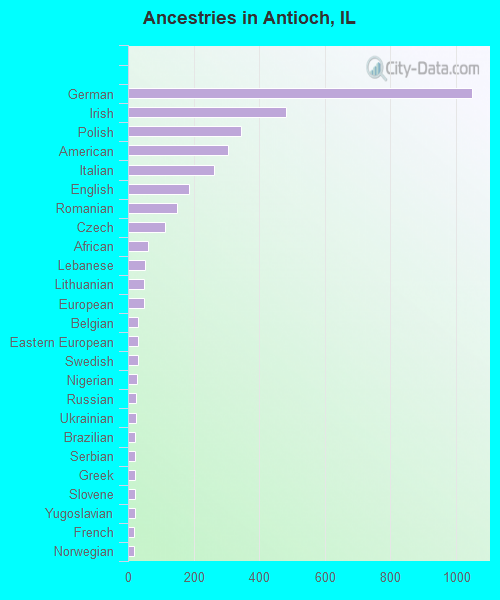
Ancestries in Antioch
1,048 20.2% German481 9.3% Irish345 6.6% Polish304 5.9% American263 5.1% Italian186 3.6% English149 2.9% Romanian113 2.2% Czech60 1.2% African53 1.0% Lebanese49 0.9% Lithuanian48 0.9% European29 0.6% Belgian29 0.6% Eastern European29 0.6% Swedish26 0.5% Nigerian23 0.4% Russian23 0.4% Ukrainian22 0.4% Brazilian21 0.4% Serbian20 0.4% Greek20 0.4% Slovene20 0.4% Yugoslavian19 0.4% French17 0.3% Norwegian17 0.3% Scottish14 0.3% South African10 0.2% Croatian10 0.2% Swiss8 0.2% French Canadian6 0.1% Dutch6 0.1% Pennsylvania German
Children Nativity (place of birth) in Antioch
Children under 6 years - Living with two parents Both parents native 449 100.0% NativeOne native, one foreign-born parent 36 100.0% NativeChildren under 6 years - Living with one parent Native parent 238 100.0% NativeChildren 6 to 17 years - Living with two parents Both parents native 1,876 99.8% Native4 0.2% Foreign-bornBoth parents foreign-born 152 100.0% NativeOne native, one foreign-born parent 165 88.3% Native22 11.7% Foreign-bornChildren 6 to 17 years - Living with one parent Native parent 527 100.0% NativeForeign-born parent 58 51.8% Native54 48.2% Foreign-born
Grandparents responsible for own grandchildren in Antioch
Grandparents (30 to 59 years) White / Caucasian 105 84.9% Responsible for grandchildren19 15.1% Not responsible for grandchildrenBlack or African American 20 100.0% Responsible for grandchildrenTwo or more races 25 100.0% Not responsible for grandchildrenWhite alone, not Hispanic / Latino 134 87.2% Responsible for grandchildren20 12.8% Not responsible for grandchildrenHispanic or Latino 16 100.0% Not responsible for grandchildrenGrandparents (60 years and over) White / Caucasian 40 38.7% Responsible for grandchildren63 61.3% Not responsible for grandchildrenBlack or African American 19 100.0% Not responsible for grandchildrenTwo or more races 14 100.0% Not responsible for grandchildrenWhite alone, not Hispanic / Latino 48 35.3% Responsible for grandchildren88 64.7% Not responsible for grandchildrenHispanic or Latino 29 100.0% Not responsible for grandchildren