Races in Almaville, Tennessee (TN) Detailed Stats
Ancestries, Foreign-born residents, place of birth
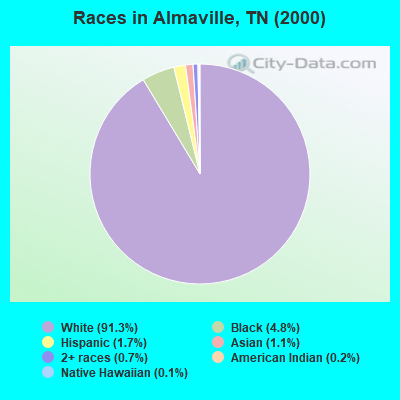
Race distribution in Almaville

- 14,46891.3%White alone
- 7654.8%Black alone
- 2751.7%Hispanic
- 1721.1%Asian alone
- 1150.7%Two or more races
- 250.2%American Indian alone
- 200.1%Native Hawaiian and Other
Pacific Islander alone - 140.09%Other race alone
2000
2022
-
- 4,505,93079.2%White alone
- 928,20416.3%Black alone
- 123,8382.2%Hispanic
- 54,8241.0%Two or more races
- 56,0771.0%Asian alone
- 13,8200.2%American Indian alone
- 4,7800.08%Other race alone
- 1,8100.03%Native Hawaiian and Other
Pacific Islander alone

-
- 5,070,02671.9%White alone
- 1,089,73815.5%Black alone
- 442,6296.3%Hispanic
- 279,3814.0%Two or more races
- 131,8171.9%Asian alone
- 26,9720.4%Other race alone
- 6,3870.09%American Indian alone
- 4,3890.06%Native Hawaiian and Other
Pacific Islander alone

Income and house value in Almaville
- Median household income in 2022
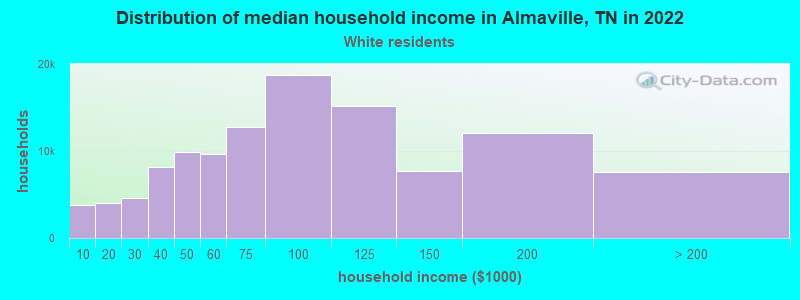
- $93,588White non-Hispanic householders
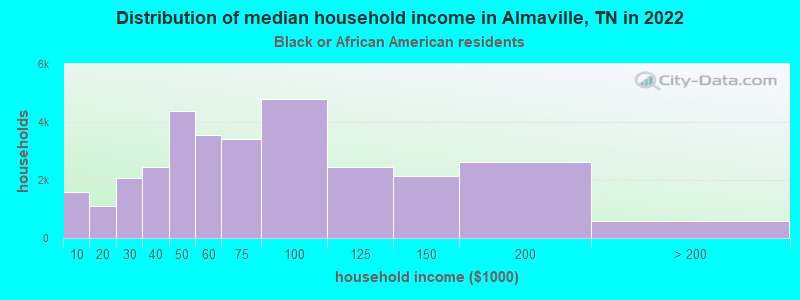
- $93,128Black householders
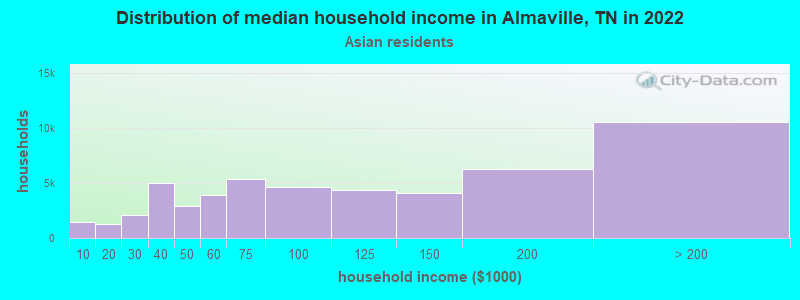
- $78,441Asian householders
- $72,306Some other race householders
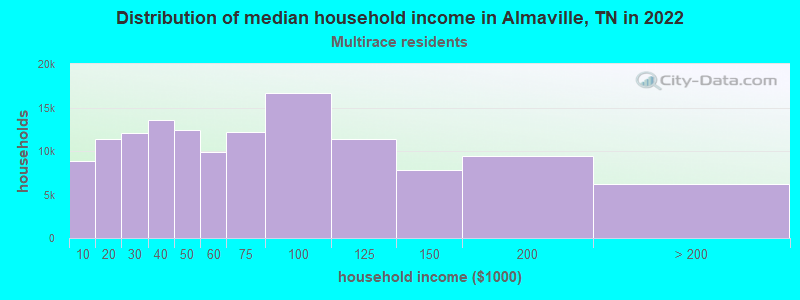
- $142,956Two or more races householders
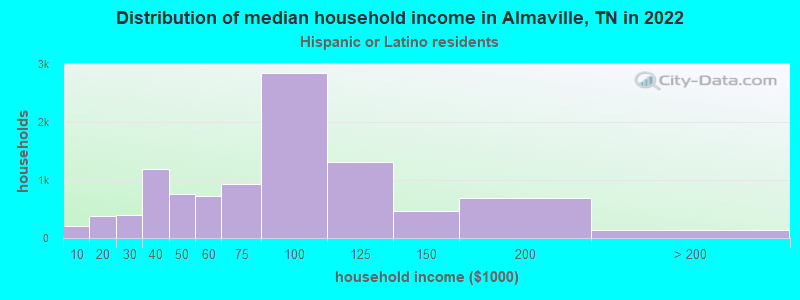
- $98,884Hispanic or Latino race householders
- Median 2022 house value
- $428,029White Non-Hispanic householders
- $451,963Black or African American householders
- $514,052Asian householders
- $412,074Some other race householders
- $273,328Two or more races householders
- $390,221Hispanic or Latino householders
Household income for White non-Hispanic householders
Household income for Black householders
Household income for Asian householders
Household income for Two or more races householders
Household income for Hispanic or Latino race householders
Zip code: 37167