Races in Allen, Texas (TX) Detailed Stats
Data:
Races - White alone (%)
Races - White alone (% change since 2000)
Races - Black alone (%)
Races - Black alone (% change since 2000)
Races - American Indian alone (%)
Races - American Indian alone (% change since 2000)
Races - Asian alone (%)
Races - Asian alone (% change since 2000)
Races - Hispanic (%)
Races - Hispanic (% change since 2000)
Races - Native Hawaiian and Other Pacific Islander alone (%)
Races - Native Hawaiian and Other Pacific Islander alone (% change since 2000)
Races - Two or more races(%)
Races - Two or more races(% change since 2000)
Races - Other race alone (%)
Races - Other race alone (% change since 2000)
Racial diversity
Place of birth - Born in state of residence (%)
Place of birth - Born in state of residence (%) - White
Place of birth - Born in state of residence (%) - Black or African American
Place of birth - Born in state of residence (%) - Asian
Place of birth - Born in state of residence (%) - Hispanic or Latino
Place of birth - Born in state of residence (%) - American Indian and Alaska Native
Place of birth - Born in state of residence (%) - Multirace
Place of birth - Born in state of residence (%) - Other Race
Place of birth - Born in other state (%)
Place of birth - Born in other state (%) - White
Place of birth - Born in other state (%) - Black or African American
Place of birth - Born in other state (%) - Asian
Place of birth - Born in other state (%) - Hispanic or Latino
Place of birth - Born in other state (%) - American Indian and Alaska Native
Place of birth - Born in other state (%) - Multirace
Place of birth - Born in other state (%) - Other Race
Place of birth - Native, outside of US (%)
Place of birth - Native, outside of US (%) - White
Place of birth - Native, outside of US (%) - Black or African American
Place of birth - Native, outside of US (%) - Asian
Place of birth - Native, outside of US (%) - Hispanic or Latino
Place of birth - Native, outside of US (%) - American Indian and Alaska Native
Place of birth - Native, outside of US (%) - Multirace
Place of birth - Native, outside of US (%) - Other Race
Place of birth - Foreign born (%)
Place of birth - Foreign born (%) - White
Place of birth - Foreign born (%) - Black or African American
Place of birth - Foreign born (%) - Asian
Place of birth - Foreign born (%) - Hispanic or Latino
Place of birth - Foreign born (%) - American Indian and Alaska Native
Place of birth - Foreign born (%) - Multirace
Place of birth - Foreign born (%) - Other Race
Residents speaking English at home (%)
Residents speaking English at home - Born in the United States (%)
Residents speaking English at home - Native, born elsewhere (%)
Residents speaking English at home - Foreign born (%)
Residents speaking Spanish at home (%)
Residents speaking Spanish at home - Born in the United States (%)
Residents speaking Spanish at home - Native, born elsewhere (%)
Residents speaking Spanish at home - Foreign born (%)
Residents speaking other language at home (%)
Residents speaking other language at home - Born in the United States (%)
Residents speaking other language at home - Native, born elsewhere (%)
Residents speaking other language at home - Foreign born (%)
Marital status - Never married (%)
Marital status - Now married (%)
Marital status - Separated (%)
Marital status - Widowed (%)
Marital status - Divorced (%)
Ancestries Reported - Arab (%)
Ancestries Reported - Czech (%)
Ancestries Reported - Danish (%)
Ancestries Reported - Dutch (%)
Ancestries Reported - English (%)
Ancestries Reported - French (%)
Ancestries Reported - French Canadian (%)
Ancestries Reported - German (%)
Ancestries Reported - Greek (%)
Ancestries Reported - Hungarian (%)
Ancestries Reported - Irish (%)
Ancestries Reported - Italian (%)
Ancestries Reported - Lithuanian (%)
Ancestries Reported - Norwegian (%)
Ancestries Reported - Polish (%)
Ancestries Reported - Portuguese (%)
Ancestries Reported - Russian (%)
Ancestries Reported - Scotch-Irish (%)
Ancestries Reported - Scottish (%)
Ancestries Reported - Slovak (%)
Ancestries Reported - Subsaharan African (%)
Ancestries Reported - Swedish (%)
Ancestries Reported - Swiss (%)
Ancestries Reported - Ukrainian (%)
Ancestries Reported - United States (%)
Ancestries Reported - Welsh (%)
Ancestries Reported - West Indian (%)
Ancestries Reported - Other (%)
Geographical mobility - Same house 1 year ago (%)
Geographical mobility - Same house 1 year ago (%) - White
Geographical mobility - Same house 1 year ago (%) - Black or African American
Geographical mobility - Same house 1 year ago (%) - Asian
Geographical mobility - Same house 1 year ago (%) - Hispanic or Latino
Geographical mobility - Same house 1 year ago (%) - American Indian and Alaska Native
Geographical mobility - Same house 1 year ago (%) - Multirace
Geographical mobility - Same house 1 year ago (%) - Other Race
Geographical mobility - Moved within same county (%)
Geographical mobility - Moved within same county (%) - White
Geographical mobility - Moved within same county (%) - Black or African American
Geographical mobility - Moved within same county (%) - Asian
Geographical mobility - Moved within same county (%) - Hispanic or Latino
Geographical mobility - Moved within same county (%) - American Indian and Alaska Native
Geographical mobility - Moved within same county (%) - Multirace
Geographical mobility - Moved within same county (%) - Other Race
Geographical mobility - Moved from different county within same state (%)
Geographical mobility - Moved from different county within same state (%) - White
Geographical mobility - Moved from different county within same state (%) - Black or African American
Geographical mobility - Moved from different county within same state (%) - Asian
Geographical mobility - Moved from different county within same state (%) - Hispanic or Latino
Geographical mobility - Moved from different county within same state (%) - American Indian and Alaska Native
Geographical mobility - Moved from different county within same state (%) - Multirace
Geographical mobility - Moved from different county within same state (%) - Other Race
Geographical mobility - Moved from different state (%)
Geographical mobility - Moved from different state (%) - White
Geographical mobility - Moved from different state (%) - Black or African American
Geographical mobility - Moved from different state (%) - Asian
Geographical mobility - Moved from different state (%) - Hispanic or Latino
Geographical mobility - Moved from different state (%) - American Indian and Alaska Native
Geographical mobility - Moved from different state (%) - Multirace
Geographical mobility - Moved from different state (%) - Other Race
Geographical mobility - Moved from abroad (%)
Geographical mobility - Moved from abroad (%) - White
Geographical mobility - Moved from abroad (%) - Black or African American
Geographical mobility - Moved from abroad (%) - Asian
Geographical mobility - Moved from abroad (%) - Hispanic or Latino
Geographical mobility - Moved from abroad (%) - American Indian and Alaska Native
Geographical mobility - Moved from abroad (%) - Multirace
Geographical mobility - Moved from abroad (%) - Other Race
Place of birth for the foreign-born population - Ireland (%)
Place of birth for the foreign-born population - Denmark (%)
Place of birth for the foreign-born population - Norway (%)
Place of birth for the foreign-born population - Sweden (%)
Place of birth for the foreign-born population - United Kingdom (%)
Place of birth for the foreign-born population - England (%)
Place of birth for the foreign-born population - Scotland (%)
Place of birth for the foreign-born population - Other Northern Europe (%)
Place of birth for the foreign-born population - Austria (%)
Place of birth for the foreign-born population - Belgium (%)
Place of birth for the foreign-born population - France (%)
Place of birth for the foreign-born population - Germany (%)
Place of birth for the foreign-born population - Netherlands (%)
Place of birth for the foreign-born population - Switzerland (%)
Place of birth for the foreign-born population - Other Western Europe (%)
Place of birth for the foreign-born population - Greece (%)
Place of birth for the foreign-born population - Italy (%)
Place of birth for the foreign-born population - Portugal (%)
Place of birth for the foreign-born population - Spain (%)
Place of birth for the foreign-born population - Other Southern Europe (%)
Place of birth for the foreign-born population - Albania (%)
Place of birth for the foreign-born population - Belarus (%)
Place of birth for the foreign-born population - Bosnia and Herzegovina (%)
Place of birth for the foreign-born population - Bulgaria (%)
Place of birth for the foreign-born population - Croatia (%)
Place of birth for the foreign-born population - Czechoslovakia (%)
Place of birth for the foreign-born population - Hungary (%)
Place of birth for the foreign-born population - Latvia (%)
Place of birth for the foreign-born population - Lithuania (%)
Place of birth for the foreign-born population - North Macedonia (Macedonia) (%)
Place of birth for the foreign-born population - Moldova (%)
Place of birth for the foreign-born population - Poland (%)
Place of birth for the foreign-born population - Romania (%)
Place of birth for the foreign-born population - Russia (%)
Place of birth for the foreign-born population - Serbia (%)
Place of birth for the foreign-born population - Ukraine (%)
Place of birth for the foreign-born population - Other Eastern Europe (%)
Place of birth for the foreign-born population - China (%)
Place of birth for the foreign-born population - Hong Kong (%)
Place of birth for the foreign-born population - Taiwan (%)
Place of birth for the foreign-born population - Japan (%)
Place of birth for the foreign-born population - Korea (%)
Place of birth for the foreign-born population - Other Eastern Asia (%)
Place of birth for the foreign-born population - Afghanistan (%)
Place of birth for the foreign-born population - Bangladesh (%)
Place of birth for the foreign-born population - India (%)
Place of birth for the foreign-born population - Iran (%)
Place of birth for the foreign-born population - Kazakhstan (%)
Place of birth for the foreign-born population - Nepal (%)
Place of birth for the foreign-born population - Pakistan (%)
Place of birth for the foreign-born population - Sri Lanka (%)
Place of birth for the foreign-born population - Uzbekistan (%)
Place of birth for the foreign-born population - Other South Central Asia (%)
Place of birth for the foreign-born population - Burma (%)
Place of birth for the foreign-born population - Cambodia (%)
Place of birth for the foreign-born population - Indonesia (%)
Place of birth for the foreign-born population - Laos (%)
Place of birth for the foreign-born population - Malaysia (%)
Place of birth for the foreign-born population - Philippines (%)
Place of birth for the foreign-born population - Singapore (%)
Place of birth for the foreign-born population - Thailand (%)
Place of birth for the foreign-born population - Vietnam (%)
Place of birth for the foreign-born population - Other South Eastern Asia (%)
Place of birth for the foreign-born population - Armenia (%)
Place of birth for the foreign-born population - Iraq (%)
Place of birth for the foreign-born population - Israel (%)
Place of birth for the foreign-born population - Jordan (%)
Place of birth for the foreign-born population - Kuwait (%)
Place of birth for the foreign-born population - Lebanon (%)
Place of birth for the foreign-born population - Saudi Arabia (%)
Place of birth for the foreign-born population - Syria (%)
Place of birth for the foreign-born population - Turkey (%)
Place of birth for the foreign-born population - Yemen (%)
Place of birth for the foreign-born population - Other Western Asia (%)
Place of birth for the foreign-born population - Eritrea (%)
Place of birth for the foreign-born population - Ethiopia (%)
Place of birth for the foreign-born population - Kenya (%)
Place of birth for the foreign-born population - Somalia (%)
Place of birth for the foreign-born population - Uganda (%)
Place of birth for the foreign-born population - Zimbabwe (%)
Place of birth for the foreign-born population - Other Eastern Africa (%)
Place of birth for the foreign-born population - Cameroon (%)
Place of birth for the foreign-born population - Congo (%)
Place of birth for the foreign-born population - Democratic Republic of Congo (Zaire) (%)
Place of birth for the foreign-born population - Other Middle Africa (%)
Place of birth for the foreign-born population - Egypt (%)
Place of birth for the foreign-born population - Morocco (%)
Place of birth for the foreign-born population - Sudan (%)
Place of birth for the foreign-born population - Other Northern Africa (%)
Place of birth for the foreign-born population - South Africa (%)
Place of birth for the foreign-born population - Other Southern Africa (%)
Place of birth for the foreign-born population - Cabo Verde (%)
Place of birth for the foreign-born population - Ghana (%)
Place of birth for the foreign-born population - Liberia (%)
Place of birth for the foreign-born population - Nigeria (%)
Place of birth for the foreign-born population - Senegal (%)
Place of birth for the foreign-born population - Sierra Leone (%)
Place of birth for the foreign-born population - Other Western Africa (%)
Place of birth for the foreign-born population - Australia (%)
Place of birth for the foreign-born population - New Zealand (%)
Place of birth for the foreign-born population - Fiji (%)
Place of birth for the foreign-born population - Micronesia (%)
Place of birth for the foreign-born population - Bahamas (%)
Place of birth for the foreign-born population - Barbados (%)
Place of birth for the foreign-born population - Cuba (%)
Place of birth for the foreign-born population - Dominica (%)
Place of birth for the foreign-born population - Dominican Republic (%)
Place of birth for the foreign-born population - Grenada (%)
Place of birth for the foreign-born population - Haiti (%)
Place of birth for the foreign-born population - Jamaica (%)
Place of birth for the foreign-born population - St. Vincent and the Grenadines (%)
Place of birth for the foreign-born population - Trinidad and Tobago (%)
Place of birth for the foreign-born population - West Indies (%)
Place of birth for the foreign-born population - Other Caribbean (%)
Place of birth for the foreign-born population - Belize (%)
Place of birth for the foreign-born population - Costa Rica (%)
Place of birth for the foreign-born population - El Salvador (%)
Place of birth for the foreign-born population - Guatemala (%)
Place of birth for the foreign-born population - Honduras (%)
Place of birth for the foreign-born population - Mexico (%)
Place of birth for the foreign-born population - Nicaragua (%)
Place of birth for the foreign-born population - Panama (%)
Place of birth for the foreign-born population - Other Central America (%)
Place of birth for the foreign-born population - Argentina (%)
Place of birth for the foreign-born population - Bolivia (%)
Place of birth for the foreign-born population - Brazil (%)
Place of birth for the foreign-born population - Chile (%)
Place of birth for the foreign-born population - Colombia (%)
Place of birth for the foreign-born population - Ecuador (%)
Place of birth for the foreign-born population - Guyana (%)
Place of birth for the foreign-born population - Peru (%)
Place of birth for the foreign-born population - Uruguay (%)
Place of birth for the foreign-born population - Venezuela (%)
Place of birth for the foreign-born population - Other South America (%)
Place of birth for the foreign-born population - Canada (%)
Place of birth for the foreign-born population - Other Northern America (%)
Place of birth for the foreign-born population - Other (%)
Latest news about races in Allen, TX collected exclusively by city-data.com from local newspapers, TV, and radio stations
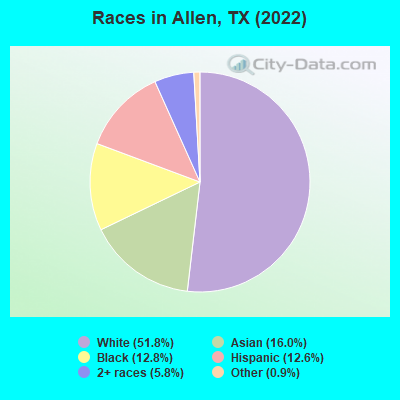
According to 2022 data, the most numerous races in Allen, TX are Hispanic (14,058 residents), White alone (57,826 residents), and Black alone (14,246 residents). 75.4% of Allen residents speak English at home. 19.9% of Allen, TX residents are foreign-born (13.7% born in Asia, 3.5% born in Latin America), which is 14.7% greater than the foreign-born rate of 17.0% across the entire state of Texas.
Race distribution in Allen
2000 2022
36,239 83.2% White alone 3,038 7.0% Hispanic 1,889 4.3% Black alone 1,617 3.7% Asian alone 524 1.2% Two or more races 188 0.4% American Indian alone 41 0.09% Other race alone 18 0.04% Native Hawaiian and Other
57,826 51.8% White alone 17,830 16.0% Asian alone 14,246 12.8% Black alone 14,058 12.6% Hispanic 6,517 5.8% Two or more races 1,006 0.9% Other race alone 65 0.06% American Indian alone
2000 2022
10,933,313 52.4% White alone 6,669,666 32.0% Hispanic 2,364,255 11.3% Black alone 554,445 2.7% Asian alone 230,567 1.1% Two or more races 68,859 0.3% American Indian alone 19,958 0.10% Other race alone 10,757 0.05% Native Hawaiian and Other
12,070,642 40.2% Hispanic 11,683,430 38.9% White alone 3,508,706 11.7% Black alone 1,608,173 5.4% Asian alone 956,560 3.2% Two or more races 125,763 0.4% Other race alone 47,023 0.2% American Indian alone 29,275 0.10% Native Hawaiian and Other
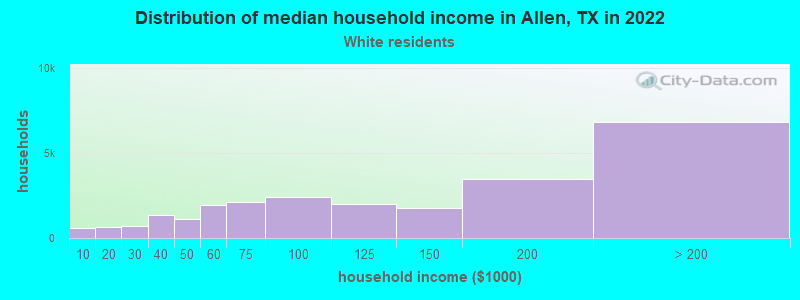
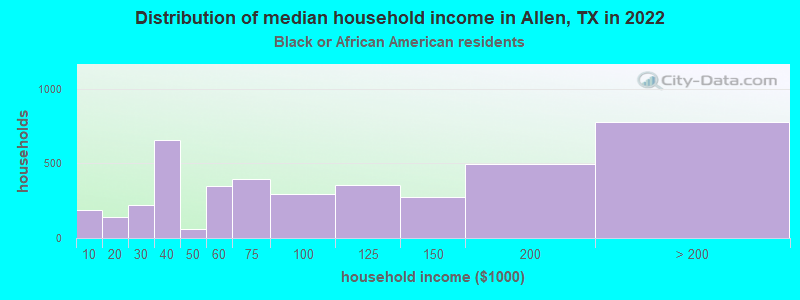
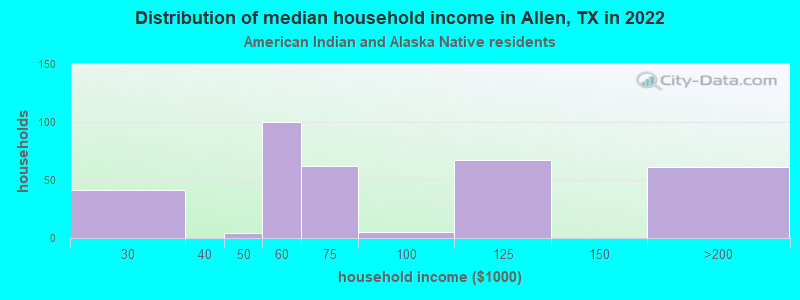
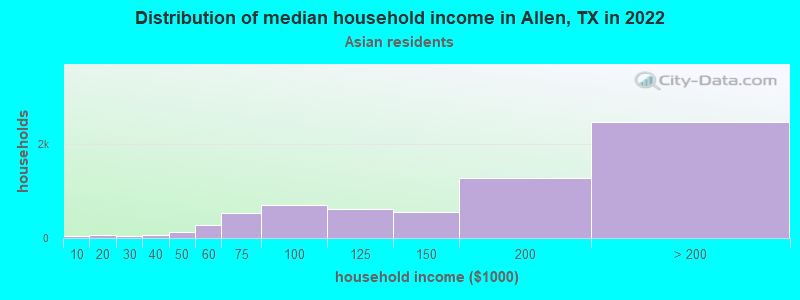
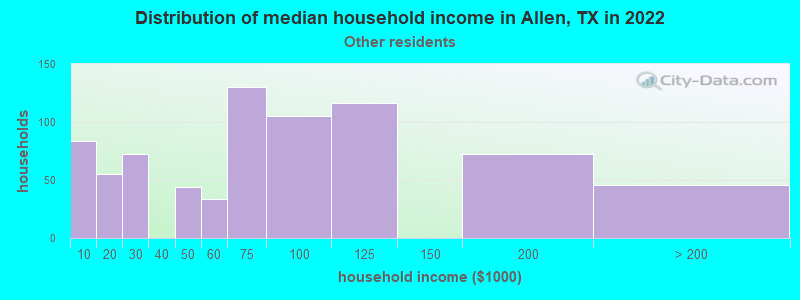
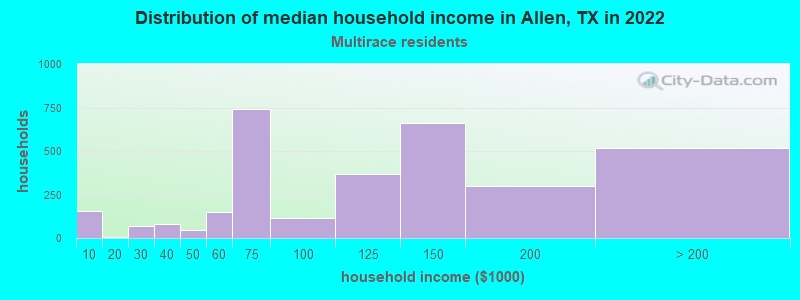
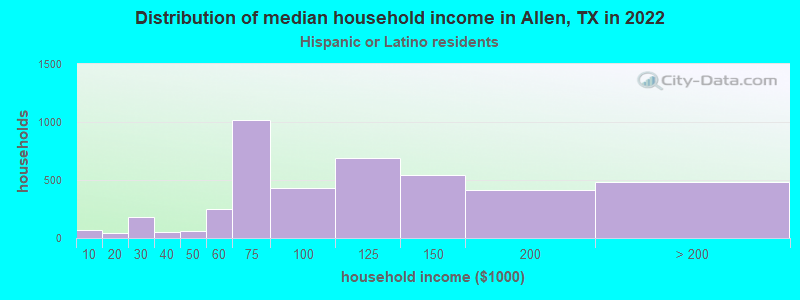
Income and house value in Allen Median household income in 2022 $118,957 White non-Hispanic householders$74,523 Black householders$73,403 American Indian and Alaska Native householders$154,299 Asian householders$105,818 Some other race householders$131,672 Two or more races householders$127,515 Hispanic or Latino race householdersMedian 2022 house value $468,713 White Non-Hispanic householders$479,637 Black or African American householders$399,201 American Indian or Alaska Native householders $524,986 Asian householders$397,877 Some other race householders$512,407 Two or more races householders$460,107 Hispanic or Latino householders
Median age by race in Allen
45.2 Median age for White residents45.7 44.1 35.2 Median age for Black or African American residents34.3 36.7 35.3 Median age for American Indian / Alaska Native residents31.3 65.2 39.6 Median age for Asian residents39.9 38.9 -666,666,666.0 Median age for Native Hawaiian / Pacific Islander residents-666,666,666.0 -666,666,666.0 27.3 Median age for Other race residents22.1 31.1 18.9 Median age for Two or more races residents18.0 21.0 45.7 Median age for White alone residents46.1 45.3 26.5 Median age for Hispanic or Latino residents23.8 28.3
Owner/renter occupied households by race in Allen
House owners and renters - White residents 18,074 72.4% Owner occupied6,897 27.6% Renter occupiedHouse owners and renters - Black or African American residents 2,726 50.8% Owner occupied2,637 49.2% Renter occupiedHouse owners and renters - American Indian / Alaska Native residents 97 56.2% Owner occupied75 43.8% Renter occupiedHouse owners and renters - Asian residents 4,815 88.2% Owner occupied646 11.8% Renter occupiedHouse owners and renters - Other race residents 349 51.1% Owner occupied334 48.9% Renter occupiedHouse owners and renters - Two or more races residents 1,853 66.5% Owner occupied932 33.5% Renter occupiedHouse owners and renters - White alone residents 17,379 73.1% Owner occupied6,401 26.9% Renter occupiedHouse owners and renters - Hispanic or Latino residents 2,011 62.7% Owner occupied1,197 37.3% Renter occupied
Language usage in Allen
English speakers - Total 75.4% of residents of Allen speak English at home.
4.5% of residents speak Spanish at home 3,337 68.5% Speak English very well1,534 31.5% Speak English less than very well20.1% of residents speak other language at home 15,285 70.8% Speak English very well6,319 29.2% Speak English less than very well
English speakers - Born in the United States 94.1% of residents of Allen speak English at home.
1.3% of residents speak Spanish at home 406 71.5% Speak English very well162 28.5% Speak English less than very well4.6% of residents speak other language at home 1,792 90.0% Speak English very well200 10.0% Speak English less than very well
English speakers - Native, born elsewhere 82.6% of residents of Allen speak English at home.
17.4% of residents speak other language at home 167 55.7% Speak English very well133 44.3% Speak English less than very well
English speakers - Foreign-born 11.4% of residents of Allen speak English at home.
13.0% of residents speak Spanish at home 1,563 58.5% Speak English very well1,111 41.5% Speak English less than very well75.6% of residents speak other language at home 9,677 62.5% Speak English very well5,817 37.5% Speak English less than very well
White (Caucasian) - Speak only English Native:
94.8% (52,816)Foreign-born:
23.7% (838)
White (Caucasian) - Speak another language Native:
5.2% (2,885)Foreign-born:
76.3% (2,705)
Black or African American - Speak only English Native:
98.8% (11,657)Foreign-born:
15.3% (252)
Black or African American - Speak another language Native:
1.5% (182)Foreign-born:
85.9% (1,416)
American Indian / Alaska Native - Speak another language Native:
42.5% (128)Foreign-born:
85.5% (64)
Asian - Speak only English Native:
40.1% (2,231)Foreign-born:
9.1% (1,060)
Asian - Speak another language Native:
59.9% (3,329)Foreign-born:
90.9% (10,634)
Other race - Speak only English Native:
80.6% (1,859)Foreign-born:
10.5% (61)
Other race - Speak another language Native:
25.5% (587)Foreign-born:
84.3% (491)
Two or more races - Speak only English Native:
83.8% (8,502)Foreign-born:
1.5% (53)
Two or more races - Speak another language Native:
16.2% (1,649)Foreign-born:
98.5% (3,530)
White alone - Speak only English Native:
95.4% (50,880)Foreign-born:
23.5% (738)
White alone - Speak another language Native:
4.6% (2,450)Foreign-born:
76.5% (2,406)
Hispanic or Latino - Speak only English Native:
79.5% (7,940)Foreign-born:
5.3% (153)
Hispanic or Latino - Speak another language Native:
20.5% (2,042)Foreign-born:
94.7% (2,761)
Foreign-born residents in Allen 22,557 residents are foreign born (13.7% Asia , 3.5% Latin America ).
This city:
19.9%Texas:
17.1%
Marital status for residents in Allen Marital status - White (Caucasian) population 15 years and over
Males 24.8% Never married63.1% Now married1.7% Separated1.8% Widowed8.6% DivorcedFemales 21.4% Never married60.8% Now married0.0% Separated6.9% Widowed10.9% DivorcedWomen who gave birth in the past 12 months Now married:
100.0% (175)Unmarried:
0.0% (0)
Women who did not give birth in the past 12 months Now married:
55.4% (7,267)Unmarried:
44.6% (5,842)
Marital status - Black or African American population 15 years and over
Males 40.2% Never married36.5% Now married1.9% Separated1.8% Widowed19.5% DivorcedFemales 41.8% Never married12.8% Now married4.3% Separated3.1% Widowed37.9% DivorcedWomen who gave birth in the past 12 months Now married:
100.0% (83)Unmarried:
0.0% (0)
Women who did not give birth in the past 12 months Now married:
35.0% (1,391)Unmarried:
65.0% (2,584)
Marital status - American Indian / Alaska Native population 15 years and over
Males 23.9% Never married72.1% Now married4.0% Separated0.0% Widowed0.0% DivorcedFemales 20.0% Never married76.6% Now married0.0% Separated3.4% Widowed0.0% DivorcedWomen who did not give birth in the past 12 months Now married:
70.2% (85)Unmarried:
29.8% (36)
Marital status - Asian population 15 years and over
Males 25.0% Never married72.7% Now married0.0% Separated0.4% Widowed1.8% DivorcedFemales 21.9% Never married73.8% Now married0.0% Separated2.7% Widowed1.6% DivorcedWomen who gave birth in the past 12 months Now married:
100.0% (410)Unmarried:
0.0% (0)
Women who did not give birth in the past 12 months Now married:
67.6% (3,452)Unmarried:
32.4% (1,655)
Marital status - Other race population 15 years and over
Males 44.3% Never married53.7% Now married0.0% Separated0.0% Widowed2.0% DivorcedFemales 24.3% Never married50.1% Now married0.0% Separated7.5% Widowed18.2% DivorcedWomen who did not give birth in the past 12 months Now married:
55.4% (338)Unmarried:
44.6% (273)
Marital status - Two or more races population 15 years and over
Males 35.3% Never married59.6% Now married0.0% Separated0.0% Widowed5.1% DivorcedFemales 36.9% Never married52.7% Now married0.0% Separated3.7% Widowed6.7% DivorcedWomen who gave birth in the past 12 months Now married:
83.7% (123)Unmarried:
16.3% (24)
Women who did not give birth in the past 12 months Now married:
44.5% (1,404)Unmarried:
55.5% (1,753)
Marital status - White alone, not Hispanic / Latino population 15 years and over
Males 24.5% Never married63.6% Now married1.4% Separated1.8% Widowed8.7% DivorcedFemales 22.0% Never married59.7% Now married0.0% Separated7.2% Widowed11.1% DivorcedWomen who gave birth in the past 12 months Now married:
100.0% (175)Unmarried:
0.0% (0)
Women who did not give birth in the past 12 months Now married:
53.7% (6,535)Unmarried:
46.3% (5,643)
Marital status - Hispanic or Latino population 15 years and over
Males 32.9% Never married57.3% Now married1.1% Separated0.1% Widowed8.5% DivorcedFemales 26.1% Never married60.8% Now married0.0% Separated4.0% Widowed9.1% DivorcedWomen who gave birth in the past 12 months Now married:
55.6% (103)Unmarried:
44.4% (82)
Women who did not give birth in the past 12 months Now married:
57.5% (1,872)Unmarried:
42.5% (1,383)
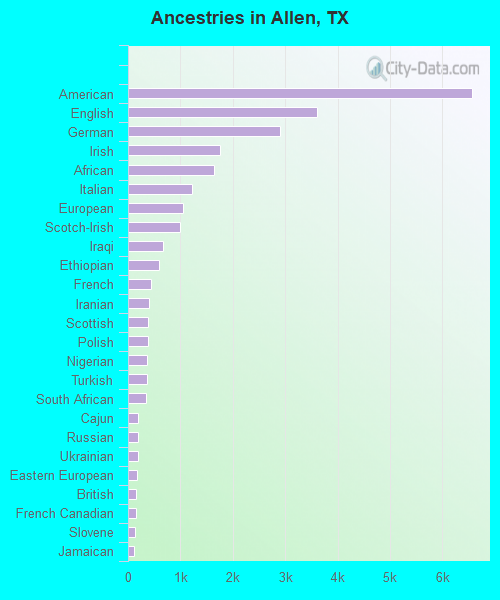
Ancestries in Allen
6,564 10.5% American3,609 5.8% English2,902 4.6% German1,766 2.8% Irish1,647 2.6% African1,227 2.0% Italian1,051 1.7% European986 1.6% Scotch-Irish672 1.1% Iraqi586 0.9% Ethiopian431 0.7% French400 0.6% Iranian391 0.6% Scottish390 0.6% Polish372 0.6% Nigerian361 0.6% Turkish339 0.5% South African200 0.3% Cajun194 0.3% Russian182 0.3% Ukrainian169 0.3% Eastern European157 0.3% British149 0.2% French Canadian143 0.2% Slovene108 0.2% Jamaican102 0.2% Swedish98 0.2% Greek95 0.2% Afghan95 0.2% Hungarian90 0.1% Lebanese83 0.1% Romanian80 0.1% Swiss71 0.1% Czech68 0.1% Israeli63 0.1% Dutch59 0.09% Ghanaian58 0.09% Czechoslovakian57 0.09% Norwegian52 0.08% Austrian48 0.08% Scandinavian46 0.07% Egyptian46 0.07% Belgian40 0.06% Slovak39 0.06% Jordanian37 0.06% Canadian33 0.05% Slavic32 0.05% Brazilian29 0.05% Palestinian25 0.04% Danish20 0.03% Haitian18 0.03% Syrian17 0.03% Albanian17 0.03% Finnish15 0.02% Welsh15 0.02% Barbadian11 0.02% Northern European11 0.02% Australian7 0.01% Trinidadian and Tobagonian6 0.01% Arab
Geographical mobility in Allen Same house 1 year ago 54,355 89.8% White (Caucasian)12,559 89.2% Black or African American750 100.0% American Indian / Alaska Native15,343 86.6% Asian14 98.2% Native Hawaiian / Pacific Islander2,592 89.0% Other race13,175 88.7% Two or more races52,219 90.7% White alone, not Hispanic / Latino12,110 90.0% Hispanic or LatinoMoved within same county 3,347 5.5% White / Caucasian471 3.3% Black or African American1,396 7.9% Asian64 2.2% Other race1,005 6.8% Two or more races3,038 5.3% White alone, not Hispanic / Latino527 3.9% Hispanic or LatinoMoved within same state 1,730 2.9% White / Caucasian793 5.6% Black or African American210 1.2% Asian135 4.6% Other race463 3.1% Two or more races1,471 2.6% White alone, not Hispanic / Latino360 2.7% Hispanic or LatinoMoved from different state 1,086 1.8% White / Caucasian202 1.4% Black or African American336 1.9% Asian131 4.5% Other race127 0.9% Two or more races839 1.5% White alone, not Hispanic / Latino327 2.4% Hispanic or LatinoMoved from abroad 440 2.5% Asian83 0.6% Two or more races81 0.6% Hispanic or Latino
Children Nativity (place of birth) in Allen
Children under 6 years - Living with two parents Both parents native 2,471 100.0% NativeBoth parents foreign-born 1,683 95.3% Native83 4.7% Foreign-bornOne native, one foreign-born parent 560 100.0% NativeChildren under 6 years - Living with one parent Native parent 1,088 100.0% NativeChildren 6 to 17 years - Living with two parents Both parents native 12,487 98.9% Native141 1.1% Foreign-bornBoth parents foreign-born 4,979 87.0% Native742 13.0% Foreign-bornOne native, one foreign-born parent 1,050 96.9% Native34 3.1% Foreign-bornChildren 6 to 17 years - Living with one parent Native parent 4,175 100.0% NativeForeign-born parent 384 50.0% Native384 50.0% Foreign-born
Place of birth for residents in Allen 14,964 Asia5,584 South Central Asia4,948 Eastern Asia4,316 Americas3,987 China3,827 Latin America2,481 South Eastern Asia1,950 Western Asia1,895 South America1,883 Africa1,667 Central America1,358 Europe790 Eastern Europe489 Northern America406 Eastern Africa322 Western Africa317 Northern Europe264 Caribbean231 Western Europe167 Northern Africa153 Southern Africa69 Middle Africa34 Oceania19 Southern Europe16 Australia and New Zealand Subregion4,142 India3,246 China1,234 Mexico1,089 Vietnam685 Philippines662 Korea618 Taiwan586 Turkey511 Pakistan489 Canada476 Brazil457 Peru445 Iraq425 Lebanon418 Bangladesh388 Venezuela319 Iran298 Japan280 Ethiopia262 Chile242 Romania235 Kuwait215 Indonesia212 Poland206 Cambodia172 Israel170 Laos163 United Kingdom160 Ukraine159 El Salvador153 South Africa130 Jamaica128 Honduras128 Colombia122 Hong Kong122 Nigeria116 Russia113 Argentina113 Thailand108 Germany95 Guatemala95 Uzbekistan92 Sierra Leone92 Afghanistan87 Sweden77 Eritrea72 Ivory Coast71 Netherlands69 Cameroon68 Jordan59 Egypt50 France47 Kenya44 Ecuador43 Sudan34 Dominican Republic31 Cuba30 Moldova29 Panama27 England26 St. Lucia23 Guyana22 Scotland21 Morocco20 Costa Rica20 Algeria19 Italy17 North Macedonia (Macedonia)16 Syria16 Australia15 Barbados15 Togo14 Bahamas11 Latvia11 Trinidad and Tobago5 Sri Lanka
Grandparents responsible for own grandchildren in Allen
Grandparents (30 to 59 years) White / Caucasian 71 26.2% Responsible for grandchildren198 73.8% Not responsible for grandchildrenBlack or African American 193 80.7% Responsible for grandchildren46 19.3% Not responsible for grandchildrenAsian 265 100.0% Not responsible for grandchildrenOther race 124 100.0% Not responsible for grandchildrenTwo or more races 128 96.7% Responsible for grandchildren4 3.3% Not responsible for grandchildrenWhite alone, not Hispanic / Latino 69 30.0% Responsible for grandchildren160 70.0% Not responsible for grandchildrenHispanic or Latino 107 51.4% Responsible for grandchildren102 48.6% Not responsible for grandchildrenGrandparents (60 years and over) White / Caucasian 328 100.0% Not responsible for grandchildrenBlack or African American 36 22.7% Responsible for grandchildren124 77.3% Not responsible for grandchildrenAsian 33 4.1% Responsible for grandchildren771 95.9% Not responsible for grandchildrenOther race 30 100.0% Not responsible for grandchildrenTwo or more races 289 100.0% Not responsible for grandchildrenWhite alone, not Hispanic / Latino 280 100.0% Not responsible for grandchildrenHispanic or Latino 143 100.0% Not responsible for grandchildren