Races in Alexandria, Virginia (VA) Detailed Stats
Data:
Races - White alone (%)
Races - White alone (% change since 2000)
Races - Black alone (%)
Races - Black alone (% change since 2000)
Races - American Indian alone (%)
Races - American Indian alone (% change since 2000)
Races - Asian alone (%)
Races - Asian alone (% change since 2000)
Races - Hispanic (%)
Races - Hispanic (% change since 2000)
Races - Native Hawaiian and Other Pacific Islander alone (%)
Races - Native Hawaiian and Other Pacific Islander alone (% change since 2000)
Races - Two or more races(%)
Races - Two or more races(% change since 2000)
Races - Other race alone (%)
Races - Other race alone (% change since 2000)
Racial diversity
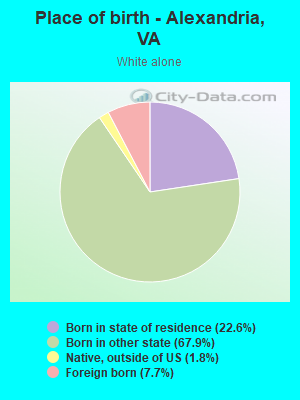
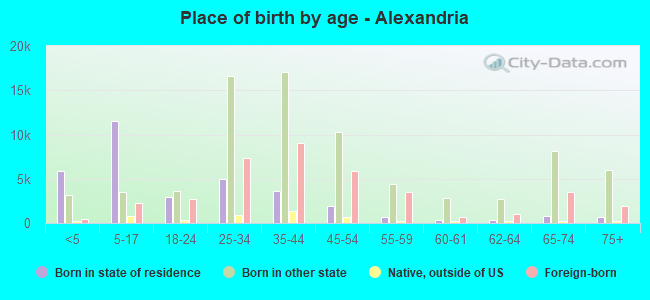
Place of birth - Born in state of residence (%)
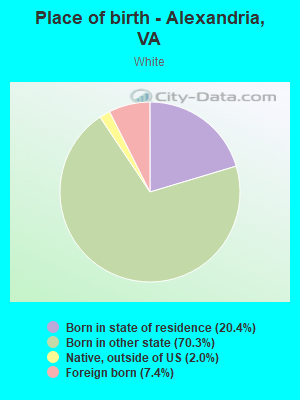
Place of birth - Born in state of residence (%) - White
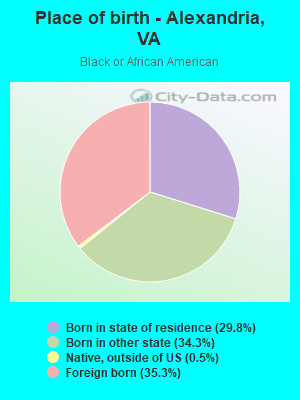
Place of birth - Born in state of residence (%) - Black or African American
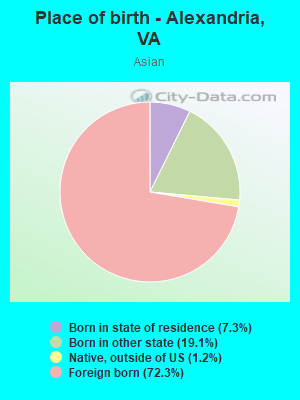
Place of birth - Born in state of residence (%) - Asian
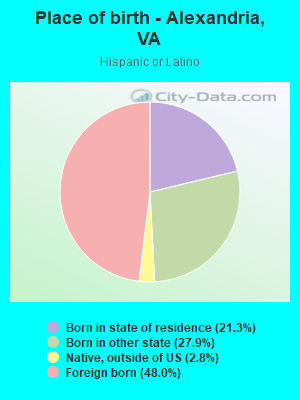
Place of birth - Born in state of residence (%) - Hispanic or Latino
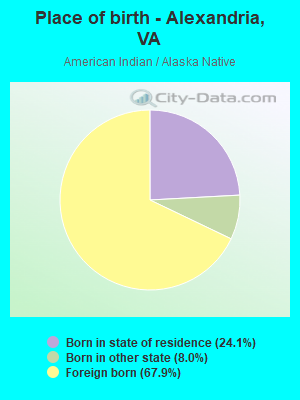
Place of birth - Born in state of residence (%) - American Indian and Alaska Native
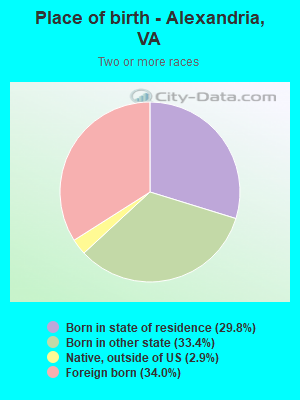
Place of birth - Born in state of residence (%) - Multirace
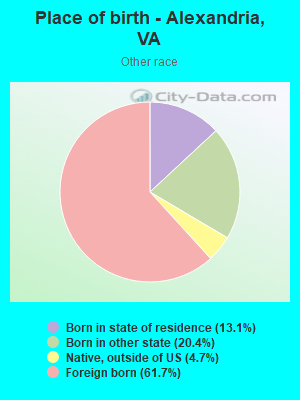
Place of birth - Born in state of residence (%) - Other Race
Place of birth - Born in other state (%)
Place of birth - Born in other state (%) - White
Place of birth - Born in other state (%) - Black or African American
Place of birth - Born in other state (%) - Asian
Place of birth - Born in other state (%) - Hispanic or Latino
Place of birth - Born in other state (%) - American Indian and Alaska Native
Place of birth - Born in other state (%) - Multirace
Place of birth - Born in other state (%) - Other Race
Place of birth - Native, outside of US (%)
Place of birth - Native, outside of US (%) - White
Place of birth - Native, outside of US (%) - Black or African American
Place of birth - Native, outside of US (%) - Asian
Place of birth - Native, outside of US (%) - Hispanic or Latino
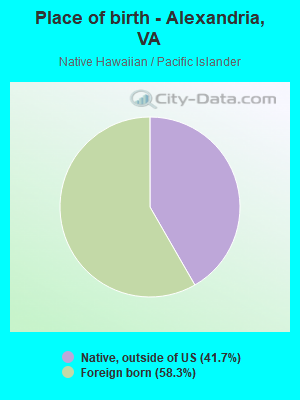
Place of birth - Native, outside of US (%) - American Indian and Alaska Native
Place of birth - Native, outside of US (%) - Multirace
Place of birth - Native, outside of US (%) - Other Race
Place of birth - Foreign born (%)
Place of birth - Foreign born (%) - White
Place of birth - Foreign born (%) - Black or African American
Place of birth - Foreign born (%) - Asian
Place of birth - Foreign born (%) - Hispanic or Latino
Place of birth - Foreign born (%) - American Indian and Alaska Native
Place of birth - Foreign born (%) - Multirace
Place of birth - Foreign born (%) - Other Race
Residents speaking English at home (%)
Residents speaking English at home - Born in the United States (%)
Residents speaking English at home - Native, born elsewhere (%)
Residents speaking English at home - Foreign born (%)
Residents speaking Spanish at home (%)
Residents speaking Spanish at home - Born in the United States (%)
Residents speaking Spanish at home - Native, born elsewhere (%)
Residents speaking Spanish at home - Foreign born (%)
Residents speaking other language at home (%)
Residents speaking other language at home - Born in the United States (%)
Residents speaking other language at home - Native, born elsewhere (%)
Residents speaking other language at home - Foreign born (%)
Marital status - Never married (%)
Marital status - Now married (%)
Marital status - Separated (%)
Marital status - Widowed (%)
Marital status - Divorced (%)
Ancestries Reported - Arab (%)
Ancestries Reported - Czech (%)
Ancestries Reported - Danish (%)
Ancestries Reported - Dutch (%)
Ancestries Reported - English (%)
Ancestries Reported - French (%)
Ancestries Reported - French Canadian (%)
Ancestries Reported - German (%)
Ancestries Reported - Greek (%)
Ancestries Reported - Hungarian (%)
Ancestries Reported - Irish (%)
Ancestries Reported - Italian (%)
Ancestries Reported - Lithuanian (%)
Ancestries Reported - Norwegian (%)
Ancestries Reported - Polish (%)
Ancestries Reported - Portuguese (%)
Ancestries Reported - Russian (%)
Ancestries Reported - Scotch-Irish (%)
Ancestries Reported - Scottish (%)
Ancestries Reported - Slovak (%)
Ancestries Reported - Subsaharan African (%)
Ancestries Reported - Swedish (%)
Ancestries Reported - Swiss (%)
Ancestries Reported - Ukrainian (%)
Ancestries Reported - United States (%)
Ancestries Reported - Welsh (%)
Ancestries Reported - West Indian (%)
Ancestries Reported - Other (%)
Geographical mobility - Same house 1 year ago (%)
Geographical mobility - Same house 1 year ago (%) - White
Geographical mobility - Same house 1 year ago (%) - Black or African American
Geographical mobility - Same house 1 year ago (%) - Asian
Geographical mobility - Same house 1 year ago (%) - Hispanic or Latino
Geographical mobility - Same house 1 year ago (%) - American Indian and Alaska Native
Geographical mobility - Same house 1 year ago (%) - Multirace
Geographical mobility - Same house 1 year ago (%) - Other Race
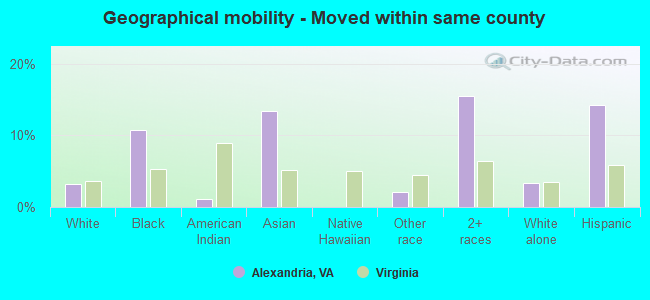
Geographical mobility - Moved within same county (%)
Geographical mobility - Moved within same county (%) - White
Geographical mobility - Moved within same county (%) - Black or African American
Geographical mobility - Moved within same county (%) - Asian
Geographical mobility - Moved within same county (%) - Hispanic or Latino
Geographical mobility - Moved within same county (%) - American Indian and Alaska Native
Geographical mobility - Moved within same county (%) - Multirace
Geographical mobility - Moved within same county (%) - Other Race
Geographical mobility - Moved from different county within same state (%)
Geographical mobility - Moved from different county within same state (%) - White
Geographical mobility - Moved from different county within same state (%) - Black or African American
Geographical mobility - Moved from different county within same state (%) - Asian
Geographical mobility - Moved from different county within same state (%) - Hispanic or Latino
Geographical mobility - Moved from different county within same state (%) - American Indian and Alaska Native
Geographical mobility - Moved from different county within same state (%) - Multirace
Geographical mobility - Moved from different county within same state (%) - Other Race
Geographical mobility - Moved from different state (%)
Geographical mobility - Moved from different state (%) - White
Geographical mobility - Moved from different state (%) - Black or African American
Geographical mobility - Moved from different state (%) - Asian
Geographical mobility - Moved from different state (%) - Hispanic or Latino
Geographical mobility - Moved from different state (%) - American Indian and Alaska Native
Geographical mobility - Moved from different state (%) - Multirace
Geographical mobility - Moved from different state (%) - Other Race
Geographical mobility - Moved from abroad (%)
Geographical mobility - Moved from abroad (%) - White
Geographical mobility - Moved from abroad (%) - Black or African American
Geographical mobility - Moved from abroad (%) - Asian
Geographical mobility - Moved from abroad (%) - Hispanic or Latino
Geographical mobility - Moved from abroad (%) - American Indian and Alaska Native
Geographical mobility - Moved from abroad (%) - Multirace
Geographical mobility - Moved from abroad (%) - Other Race
Place of birth for the foreign-born population - Ireland (%)
Place of birth for the foreign-born population - Denmark (%)
Place of birth for the foreign-born population - Norway (%)
Place of birth for the foreign-born population - Sweden (%)
Place of birth for the foreign-born population - United Kingdom (%)
Place of birth for the foreign-born population - England (%)
Place of birth for the foreign-born population - Scotland (%)
Place of birth for the foreign-born population - Other Northern Europe (%)
Place of birth for the foreign-born population - Austria (%)
Place of birth for the foreign-born population - Belgium (%)
Place of birth for the foreign-born population - France (%)
Place of birth for the foreign-born population - Germany (%)
Place of birth for the foreign-born population - Netherlands (%)
Place of birth for the foreign-born population - Switzerland (%)
Place of birth for the foreign-born population - Other Western Europe (%)
Place of birth for the foreign-born population - Greece (%)
Place of birth for the foreign-born population - Italy (%)
Place of birth for the foreign-born population - Portugal (%)
Place of birth for the foreign-born population - Spain (%)
Place of birth for the foreign-born population - Other Southern Europe (%)
Place of birth for the foreign-born population - Albania (%)
Place of birth for the foreign-born population - Belarus (%)
Place of birth for the foreign-born population - Bosnia and Herzegovina (%)
Place of birth for the foreign-born population - Bulgaria (%)
Place of birth for the foreign-born population - Croatia (%)
Place of birth for the foreign-born population - Czechoslovakia (%)
Place of birth for the foreign-born population - Hungary (%)
Place of birth for the foreign-born population - Latvia (%)
Place of birth for the foreign-born population - Lithuania (%)
Place of birth for the foreign-born population - North Macedonia (Macedonia) (%)
Place of birth for the foreign-born population - Moldova (%)
Place of birth for the foreign-born population - Poland (%)
Place of birth for the foreign-born population - Romania (%)
Place of birth for the foreign-born population - Russia (%)
Place of birth for the foreign-born population - Serbia (%)
Place of birth for the foreign-born population - Ukraine (%)
Place of birth for the foreign-born population - Other Eastern Europe (%)
Place of birth for the foreign-born population - China (%)
Place of birth for the foreign-born population - Hong Kong (%)
Place of birth for the foreign-born population - Taiwan (%)
Place of birth for the foreign-born population - Japan (%)
Place of birth for the foreign-born population - Korea (%)
Place of birth for the foreign-born population - Other Eastern Asia (%)
Place of birth for the foreign-born population - Afghanistan (%)
Place of birth for the foreign-born population - Bangladesh (%)
Place of birth for the foreign-born population - India (%)
Place of birth for the foreign-born population - Iran (%)
Place of birth for the foreign-born population - Kazakhstan (%)
Place of birth for the foreign-born population - Nepal (%)
Place of birth for the foreign-born population - Pakistan (%)
Place of birth for the foreign-born population - Sri Lanka (%)
Place of birth for the foreign-born population - Uzbekistan (%)
Place of birth for the foreign-born population - Other South Central Asia (%)
Place of birth for the foreign-born population - Burma (%)
Place of birth for the foreign-born population - Cambodia (%)
Place of birth for the foreign-born population - Indonesia (%)
Place of birth for the foreign-born population - Laos (%)
Place of birth for the foreign-born population - Malaysia (%)
Place of birth for the foreign-born population - Philippines (%)
Place of birth for the foreign-born population - Singapore (%)
Place of birth for the foreign-born population - Thailand (%)
Place of birth for the foreign-born population - Vietnam (%)
Place of birth for the foreign-born population - Other South Eastern Asia (%)
Place of birth for the foreign-born population - Armenia (%)
Place of birth for the foreign-born population - Iraq (%)
Place of birth for the foreign-born population - Israel (%)
Place of birth for the foreign-born population - Jordan (%)
Place of birth for the foreign-born population - Kuwait (%)
Place of birth for the foreign-born population - Lebanon (%)
Place of birth for the foreign-born population - Saudi Arabia (%)
Place of birth for the foreign-born population - Syria (%)
Place of birth for the foreign-born population - Turkey (%)
Place of birth for the foreign-born population - Yemen (%)
Place of birth for the foreign-born population - Other Western Asia (%)
Place of birth for the foreign-born population - Eritrea (%)
Place of birth for the foreign-born population - Ethiopia (%)
Place of birth for the foreign-born population - Kenya (%)
Place of birth for the foreign-born population - Somalia (%)
Place of birth for the foreign-born population - Uganda (%)
Place of birth for the foreign-born population - Zimbabwe (%)
Place of birth for the foreign-born population - Other Eastern Africa (%)
Place of birth for the foreign-born population - Cameroon (%)
Place of birth for the foreign-born population - Congo (%)
Place of birth for the foreign-born population - Democratic Republic of Congo (Zaire) (%)
Place of birth for the foreign-born population - Other Middle Africa (%)
Place of birth for the foreign-born population - Egypt (%)
Place of birth for the foreign-born population - Morocco (%)
Place of birth for the foreign-born population - Sudan (%)
Place of birth for the foreign-born population - Other Northern Africa (%)
Place of birth for the foreign-born population - South Africa (%)
Place of birth for the foreign-born population - Other Southern Africa (%)
Place of birth for the foreign-born population - Cabo Verde (%)
Place of birth for the foreign-born population - Ghana (%)
Place of birth for the foreign-born population - Liberia (%)
Place of birth for the foreign-born population - Nigeria (%)
Place of birth for the foreign-born population - Senegal (%)
Place of birth for the foreign-born population - Sierra Leone (%)
Place of birth for the foreign-born population - Other Western Africa (%)
Place of birth for the foreign-born population - Australia (%)
Place of birth for the foreign-born population - New Zealand (%)
Place of birth for the foreign-born population - Fiji (%)
Place of birth for the foreign-born population - Micronesia (%)
Place of birth for the foreign-born population - Bahamas (%)
Place of birth for the foreign-born population - Barbados (%)
Place of birth for the foreign-born population - Cuba (%)
Place of birth for the foreign-born population - Dominica (%)
Place of birth for the foreign-born population - Dominican Republic (%)
Place of birth for the foreign-born population - Grenada (%)
Place of birth for the foreign-born population - Haiti (%)
Place of birth for the foreign-born population - Jamaica (%)
Place of birth for the foreign-born population - St. Vincent and the Grenadines (%)
Place of birth for the foreign-born population - Trinidad and Tobago (%)
Place of birth for the foreign-born population - West Indies (%)
Place of birth for the foreign-born population - Other Caribbean (%)
Place of birth for the foreign-born population - Belize (%)
Place of birth for the foreign-born population - Costa Rica (%)
Place of birth for the foreign-born population - El Salvador (%)
Place of birth for the foreign-born population - Guatemala (%)
Place of birth for the foreign-born population - Honduras (%)
Place of birth for the foreign-born population - Mexico (%)
Place of birth for the foreign-born population - Nicaragua (%)
Place of birth for the foreign-born population - Panama (%)
Place of birth for the foreign-born population - Other Central America (%)
Place of birth for the foreign-born population - Argentina (%)
Place of birth for the foreign-born population - Bolivia (%)
Place of birth for the foreign-born population - Brazil (%)
Place of birth for the foreign-born population - Chile (%)
Place of birth for the foreign-born population - Colombia (%)
Place of birth for the foreign-born population - Ecuador (%)
Place of birth for the foreign-born population - Guyana (%)
Place of birth for the foreign-born population - Peru (%)
Place of birth for the foreign-born population - Uruguay (%)
Place of birth for the foreign-born population - Venezuela (%)
Place of birth for the foreign-born population - Other South America (%)
Place of birth for the foreign-born population - Canada (%)
Place of birth for the foreign-born population - Other Northern America (%)
Place of birth for the foreign-born population - Other (%)
Latest news about races in Alexandria, VA collected exclusively by city-data.com from local newspapers, TV, and radio stations
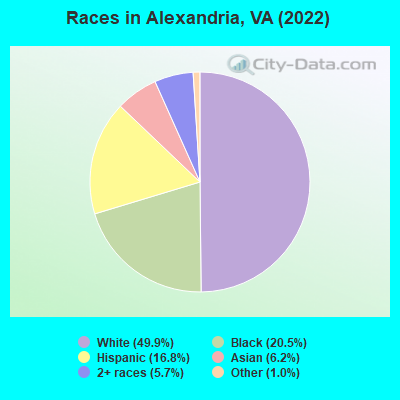
According to 2022 data, the most numerous races in Alexandria, VA are White alone (77,628 residents), Black alone (31,836 residents), and Hispanic (26,072 residents). 70.1% of Alexandria residents speak English at home. 25.1% of Alexandria, VA residents are foreign-born (8.4% born in Latin America, 7.8% born in Africa, 5.6% born in Asia), which is 52.3% greater than the foreign-born rate of 12.0% across the entire state of Virginia.
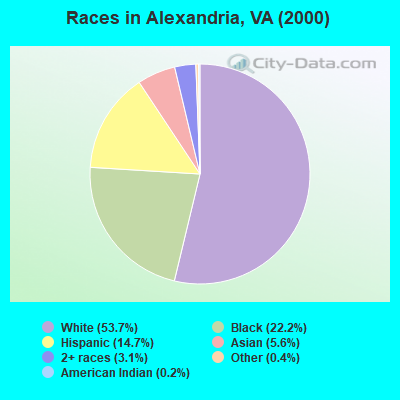
Race distribution in Alexandria
2000 2022
68,889 53.7% White alone 28,463 22.2% Black alone 18,882 14.7% Hispanic 7,199 5.6% Asian alone 3,989 3.1% Two or more races 506 0.4% Other race alone 255 0.2% American Indian alone 100 0.08% Native Hawaiian and Other
77,628 49.9% White alone 31,836 20.5% Black alone 26,072 16.8% Hispanic 9,565 6.2% Asian alone 8,933 5.7% Two or more races 1,491 1.0% Other race alone
2000 2022
4,965,637 70.2% White alone 1,376,378 19.4% Black alone 329,540 4.7% Hispanic 259,277 3.7% Asian alone 114,022 1.6% Two or more races 18,596 0.3% American Indian alone 11,685 0.2% Other race alone 3,380 0.05% Native Hawaiian and Other
5,095,130 58.7% White alone 1,594,785 18.4% Black alone 905,750 10.4% Hispanic 602,881 6.9% Asian alone 406,047 4.7% Two or more races 60,419 0.7% Other race alone 11,738 0.1% American Indian alone 6,869 0.08% Native Hawaiian and Other
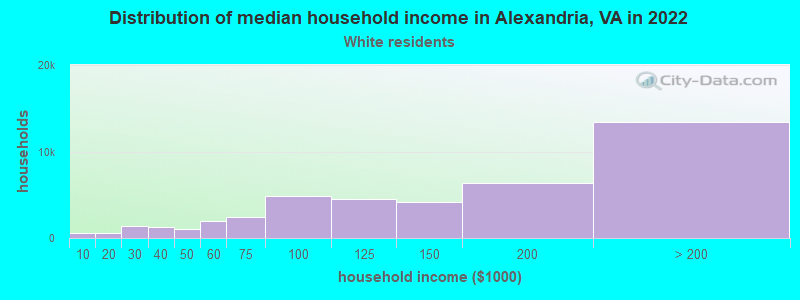
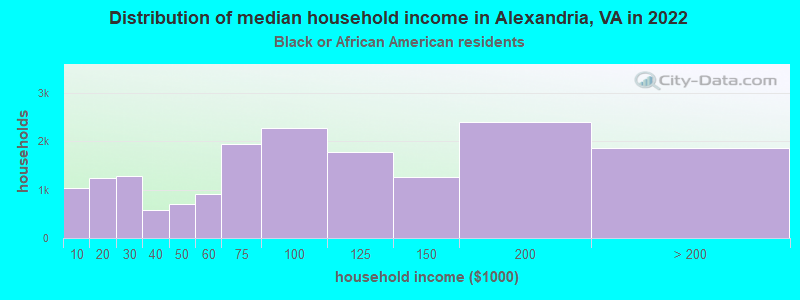
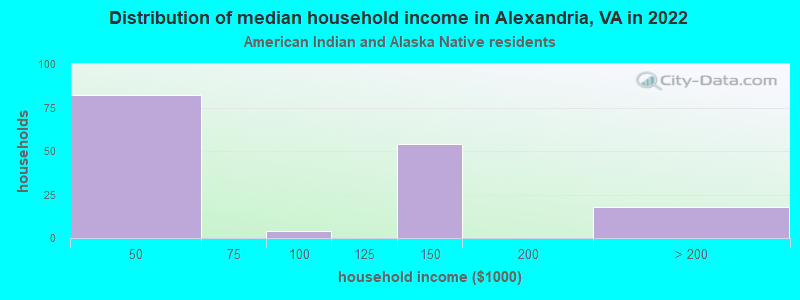
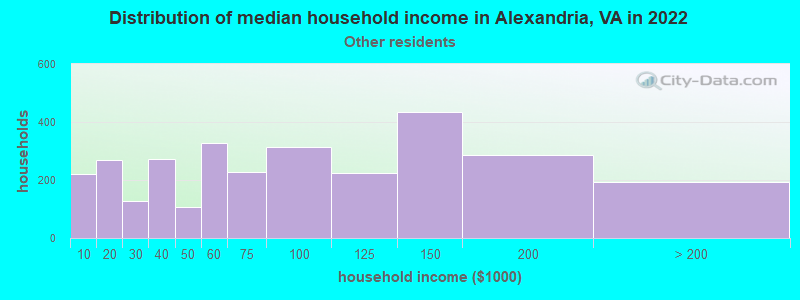
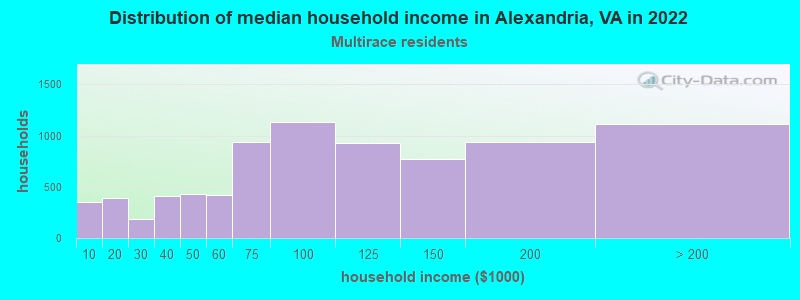
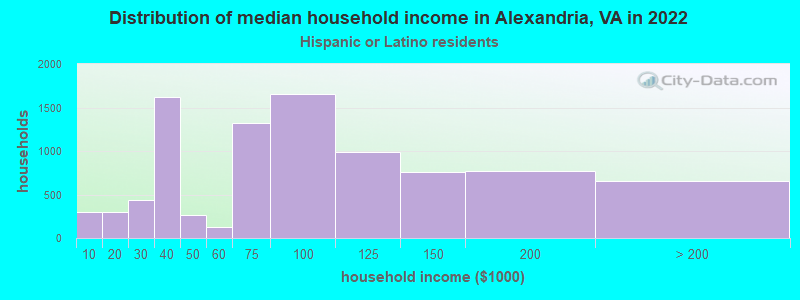
Income and house value in Alexandria Median household income in 2022 $138,161 White non-Hispanic householders$84,534 Black householders$101,458 Asian householders$34,756 Some other race householders$99,766 Two or more races householders$80,031 Hispanic or Latino race householdersMedian 2022 house value over $1,000,000 White Non-Hispanic householders$585,626 Black or African American householders$478,778 American Indian or Alaska Native householders $693,952 Asian householdersover $1,000,000 Native Hawaiian and other Pacific Islander householders$553,091 Some other race householders$686,927 Two or more races householders$661,787 Hispanic or Latino householders
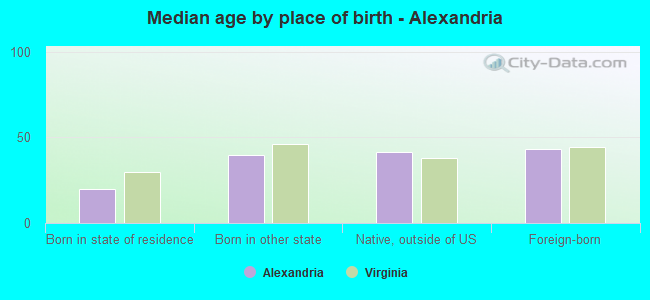
Median age by race in Alexandria
40.1 Median age for White residents39.6 40.5 36.2 Median age for Black or African American residents36.2 35.9 24.8 Median age for American Indian / Alaska Native residents-666,666,666.0 -666,666,666.0 37.0 Median age for Asian residents35.6 38.0 -666,666,666.0 Median age for Native Hawaiian / Pacific Islander residents-666,666,666.0 -666,666,666.0 30.0 Median age for Other race residents30.0 30.1 34.2 Median age for Two or more races residents26.6 38.3 40.5 Median age for White alone residents40.1 40.7 32.9 Median age for Hispanic or Latino residents30.8 36.0
Owner/renter occupied households by race in Alexandria
House owners and renters - White residents 22,741 53.2% Owner occupied19,981 46.8% Renter occupiedHouse owners and renters - Black or African American residents 2,658 15.4% Owner occupied14,616 84.6% Renter occupiedHouse owners and renters - American Indian / Alaska Native residents 193 100.0% Renter occupiedHouse owners and renters - Asian residents 2,093 43.8% Owner occupied2,688 56.2% Renter occupiedHouse owners and renters - Native Hawaiian / Pacific Islander residents 3 100.0% Renter occupiedHouse owners and renters - Other race residents 900 32.0% Owner occupied1,912 68.0% Renter occupiedHouse owners and renters - Two or more races residents 2,110 23.5% Owner occupied6,861 76.5% Renter occupiedHouse owners and renters - White alone residents 22,378 53.9% Owner occupied19,160 46.1% Renter occupiedHouse owners and renters - Hispanic or Latino residents 1,457 15.9% Owner occupied7,733 84.1% Renter occupied
Language usage in Alexandria
English speakers - Total 70.1% of residents of Alexandria speak English at home.
13.1% of residents speak Spanish at home 11,890 62.3% Speak English very well7,201 37.7% Speak English less than very well16.7% of residents speak other language at home 16,250 66.8% Speak English very well8,077 33.2% Speak English less than very well
English speakers - Born in the United States 91.5% of residents of Alexandria speak English at home.
5.4% of residents speak Spanish at home 3,350 83.2% Speak English very well676 16.8% Speak English less than very well3.2% of residents speak other language at home 2,131 89.3% Speak English very well256 10.7% Speak English less than very well
English speakers - Native, born elsewhere 61.0% of residents of Alexandria speak English at home.
23.7% of residents speak Spanish at home 549 83.3% Speak English very well110 16.7% Speak English less than very well15.3% of residents speak other language at home 346 81.2% Speak English very well80 18.8% Speak English less than very well
English speakers - Foreign-born 14.2% of residents of Alexandria speak English at home.
32.9% of residents speak Spanish at home 6,076 50.7% Speak English very well5,911 49.3% Speak English less than very well53.0% of residents speak other language at home 11,839 61.3% Speak English very well7,476 38.7% Speak English less than very well
White (Caucasian) - Speak only English Native:
95.5% (65,596)Foreign-born:
21.5% (1,416)
White (Caucasian) - Speak another language Native:
4.5% (3,119)Foreign-born:
78.5% (5,169)
Black or African American - Speak only English Native:
95.2% (17,963)Foreign-born:
12.8% (1,455)
Black or African American - Speak another language Native:
4.8% (904)Foreign-born:
87.2% (9,874)
American Indian / Alaska Native - Speak another language Native:
33.6% (99)Foreign-born:
100.0% (157)
Asian - Speak only English Native:
43.4% (1,451)Foreign-born:
19.2% (1,226)
Asian - Speak another language Native:
56.6% (1,890)Foreign-born:
80.8% (5,143)
Native Hawaiian / Pacific Islander - Speak another language Native:
100.0% (17)Foreign-born:
49.7% (23)
Other race - Speak only English Native:
43.5% (1,594)Foreign-born:
12.6% (496)
Other race - Speak another language Native:
56.5% (2,070)Foreign-born:
87.4% (3,429)
Two or more races - Speak only English Native:
72.1% (10,167)Foreign-born:
7.0% (567)
Two or more races - Speak another language Native:
27.9% (3,927)Foreign-born:
93.0% (7,518)
White alone - Speak only English Native:
96.4% (65,043)Foreign-born:
24.1% (1,416)
White alone - Speak another language Native:
3.6% (2,420)Foreign-born:
75.9% (4,469)
Hispanic or Latino - Speak only English Native:
48.9% (5,618)Foreign-born:
6.2% (757)
Hispanic or Latino - Speak another language Native:
51.1% (5,879)Foreign-born:
93.8% (11,516)
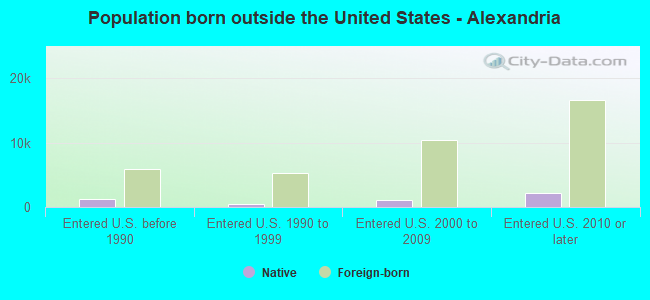
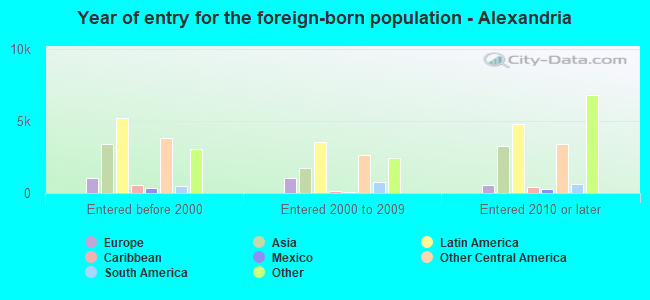
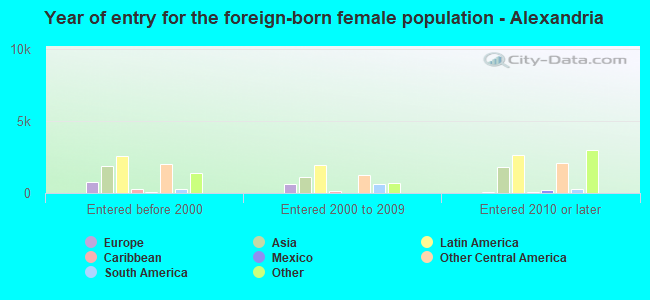
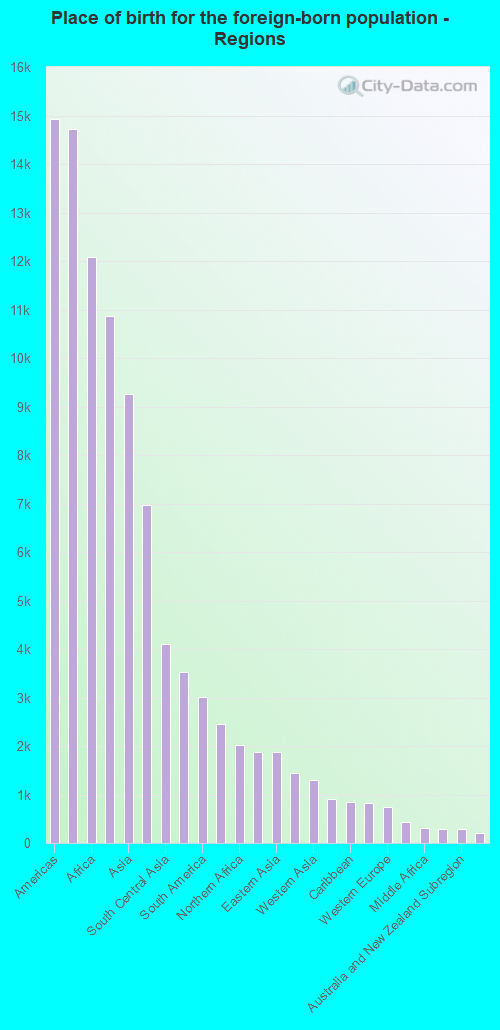
Foreign-born residents in Alexandria 39,091 residents are foreign born (8.4% Latin America , 7.8% Africa , 5.6% Asia ).
This city:
25.1%Virginia:
12.6%
Marital status for residents in Alexandria Marital status - White (Caucasian) population 15 years and over
Males 34.5% Never married53.9% Now married2.1% Separated1.8% Widowed7.7% DivorcedFemales 40.1% Never married45.0% Now married0.5% Separated4.8% Widowed9.6% DivorcedWomen who gave birth in the past 12 months Now married:
93.1% (704)Unmarried:
6.9% (52)
Women who did not give birth in the past 12 months Now married:
35.5% (7,398)Unmarried:
64.5% (13,432)
Marital status - Black or African American population 15 years and over
Males 45.2% Never married33.5% Now married3.1% Separated4.8% Widowed13.4% DivorcedFemales 48.3% Never married22.9% Now married4.1% Separated4.2% Widowed20.5% DivorcedWomen who gave birth in the past 12 months Now married:
70.1% (528)Unmarried:
29.9% (225)
Women who did not give birth in the past 12 months Now married:
20.9% (1,711)Unmarried:
79.1% (6,495)
Marital status - American Indian / Alaska Native population 15 years and over
Males 65.0% Never married2.1% Now married0.0% Separated0.0% Widowed32.9% DivorcedFemales 12.1% Never married8.9% Now married64.3% Separated0.0% Widowed14.6% DivorcedWomen who did not give birth in the past 12 months Now married:
82.4% (15)Unmarried:
17.6% (3)
Marital status - Asian population 15 years and over
Males 30.1% Never married60.8% Now married0.0% Separated0.5% Widowed8.6% DivorcedFemales 26.6% Never married59.6% Now married0.0% Separated5.3% Widowed8.5% DivorcedWomen who gave birth in the past 12 months Now married:
100.0% (197)Unmarried:
0.0% (0)
Women who did not give birth in the past 12 months Now married:
65.0% (1,956)Unmarried:
35.0% (1,053)
Marital status - Native Hawaiian / Pacific Islander population 15 years and over
Males 48.4% Never married51.6% Now married0.0% Separated0.0% Widowed0.0% DivorcedFemales 0.0% Never married100.0% Now married0.0% Separated0.0% Widowed0.0% DivorcedMarital status - Other race population 15 years and over
Males 47.8% Never married35.7% Now married1.4% Separated3.0% Widowed12.1% DivorcedFemales 51.3% Never married34.4% Now married6.1% Separated2.9% Widowed5.3% DivorcedWomen who gave birth in the past 12 months Now married:
55.8% (121)Unmarried:
44.2% (96)
Women who did not give birth in the past 12 months Now married:
39.0% (1,067)Unmarried:
61.0% (1,672)
Marital status - Two or more races population 15 years and over
Males 50.1% Never married44.9% Now married0.0% Separated0.6% Widowed4.4% DivorcedFemales 36.0% Never married33.8% Now married5.8% Separated4.8% Widowed19.6% DivorcedWomen who gave birth in the past 12 months Now married:
100.0% (84)Unmarried:
0.0% (0)
Women who did not give birth in the past 12 months Now married:
35.6% (2,537)Unmarried:
64.4% (4,589)
Marital status - White alone, not Hispanic / Latino population 15 years and over
Males 34.4% Never married53.8% Now married2.1% Separated1.9% Widowed7.7% DivorcedFemales 40.0% Never married45.1% Now married0.5% Separated4.8% Widowed9.6% DivorcedWomen who gave birth in the past 12 months Now married:
93.1% (704)Unmarried:
6.9% (52)
Women who did not give birth in the past 12 months Now married:
35.5% (7,226)Unmarried:
64.5% (13,156)
Marital status - Hispanic or Latino population 15 years and over
Males 49.6% Never married41.6% Now married1.0% Separated0.0% Widowed7.8% DivorcedFemales 40.0% Never married34.2% Now married6.7% Separated1.2% Widowed17.9% DivorcedWomen who gave birth in the past 12 months Now married:
66.2% (102)Unmarried:
33.8% (52)
Women who did not give birth in the past 12 months Now married:
29.0% (2,016)Unmarried:
71.0% (4,934)
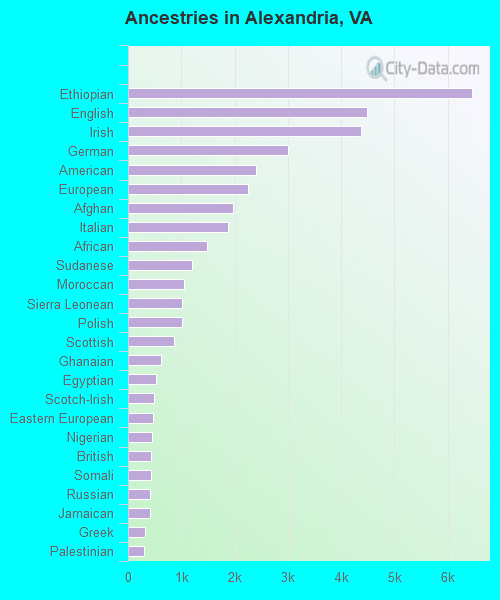
Ancestries in Alexandria
6,456 7.8% Ethiopian4,485 5.4% English4,374 5.3% Irish3,008 3.7% German2,408 2.9% American2,251 2.7% European1,980 2.4% Afghan1,873 2.3% Italian1,475 1.8% African1,206 1.5% Sudanese1,047 1.3% Moroccan1,020 1.2% Sierra Leonean1,012 1.2% Polish864 1.0% Scottish619 0.8% Ghanaian523 0.6% Egyptian492 0.6% Scotch-Irish469 0.6% Eastern European450 0.5% Nigerian439 0.5% British423 0.5% Somali416 0.5% Russian410 0.5% Jamaican310 0.4% Greek299 0.4% Palestinian282 0.3% Turkish279 0.3% French276 0.3% Norwegian259 0.3% Dutch252 0.3% Iranian236 0.3% Swedish216 0.3% Northern European206 0.3% Albanian203 0.2% Jordanian203 0.2% Ukrainian190 0.2% Iraqi180 0.2% Portuguese134 0.2% Welsh126 0.2% Armenian125 0.2% Brazilian118 0.1% Lebanese116 0.1% Arab109 0.1% Scandinavian104 0.1% French Canadian88 0.1% Ugandan88 0.1% Serbian85 0.1% Slavic83 0.1% Haitian82 0.10% Hungarian77 0.09% Trinidadian and Tobagonian76 0.09% South African73 0.09% Danish71 0.09% Romanian63 0.08% Belgian47 0.06% Swiss46 0.06% Canadian44 0.05% Syrian41 0.05% Austrian39 0.05% Cape Verdean39 0.05% Australian37 0.04% Liberian36 0.04% Bulgarian36 0.04% Croatian30 0.04% Slovak28 0.03% Czech27 0.03% Zimbabwean27 0.03% Slovene23 0.03% Czechoslovakian23 0.03% Yugoslavian21 0.03% Senegalese20 0.02% Guyanese20 0.02% Icelander20 0.02% Lithuanian19 0.02% British West Indian18 0.02% Barbadian18 0.02% Finnish17 0.02% Belizean17 0.02% U.S. Virgin Islander10 0.01% Bahamian7 0.01% West Indian6 0.01% Latvian5 0.01% Cajun5 0.01% Luxembourger
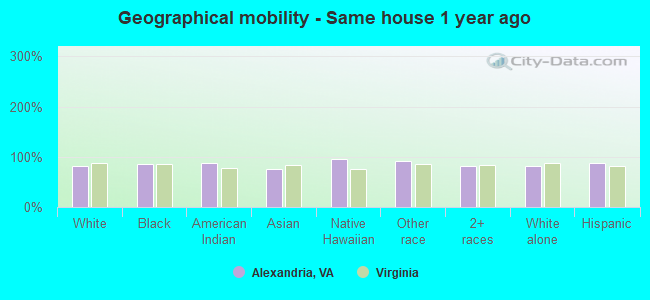
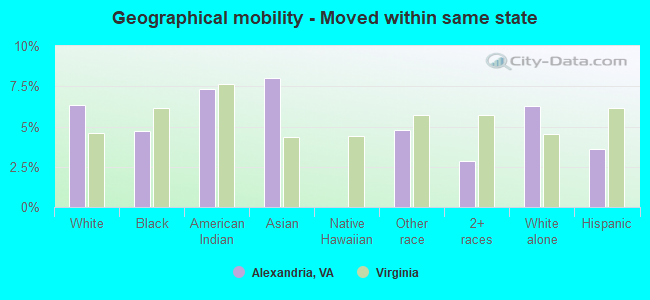
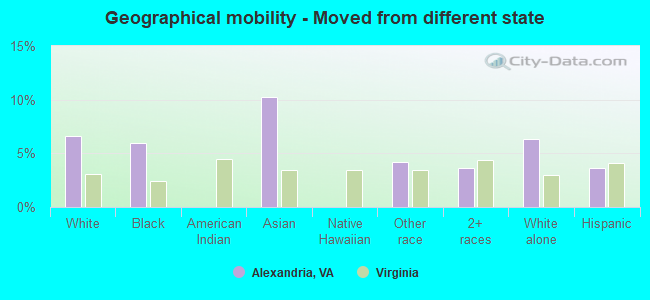
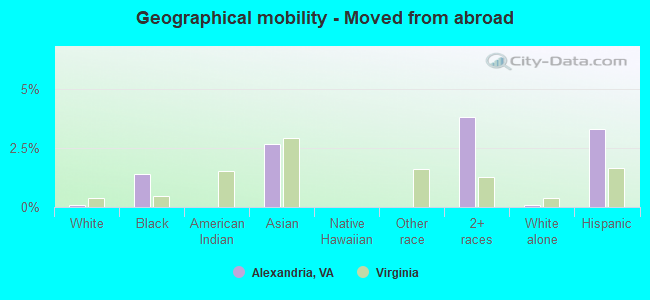
Geographical mobility in Alexandria Same house 1 year ago 64,674 82.2% White (Caucasian)26,564 84.8% Black or African American407 88.0% American Indian / Alaska Native7,649 76.0% Asian45 95.3% Native Hawaiian / Pacific Islander7,606 91.1% Other race19,921 82.1% Two or more races63,215 82.4% White alone, not Hispanic / Latino22,512 88.4% Hispanic or LatinoMoved within same county 3,769 4.8% White / Caucasian990 3.2% Black or African American6 1.3% American Indian / Alaska Native317 3.1% Asian1,838 7.6% Two or more races3,733 4.9% White alone, not Hispanic / Latino254 1.0% Hispanic or LatinoMoved within same state 5,006 6.4% White / Caucasian1,474 4.7% Black or African American34 7.4% American Indian / Alaska Native807 8.0% Asian397 4.8% Other race698 2.9% Two or more races4,814 6.3% White alone, not Hispanic / Latino922 3.6% Hispanic or LatinoMoved from different state 5,194 6.6% White / Caucasian1,861 5.9% Black or African American1,028 10.2% Asian350 4.2% Other race878 3.6% Two or more races4,863 6.3% White alone, not Hispanic / Latino933 3.7% Hispanic or LatinoMoved from abroad 67 0.1% White441 1.4% Black or African American266 2.6% Asian925 3.8% Two or more races67 0.1% White alone, not Hispanic / Latino837 3.3% Hispanic or Latino
Children Nativity (place of birth) in Alexandria
Children under 6 years - Living with two parents Both parents native 5,249 100.0% NativeBoth parents foreign-born 2,271 86.1% Native366 13.9% Foreign-bornOne native, one foreign-born parent 1,190 100.0% NativeChildren under 6 years - Living with one parent Native parent 693 100.0% NativeForeign-born parent 1,402 100.0% NativeChildren 6 to 17 years - Living with two parents Both parents native 6,583 100.0% NativeBoth parents foreign-born 1,723 63.2% Native1,005 36.8% Foreign-bornOne native, one foreign-born parent 888 100.0% NativeChildren 6 to 17 years - Living with one parent Native parent 1,928 100.0% NativeForeign-born parent 4,036 50.0% Native4,036 50.0% Foreign-born
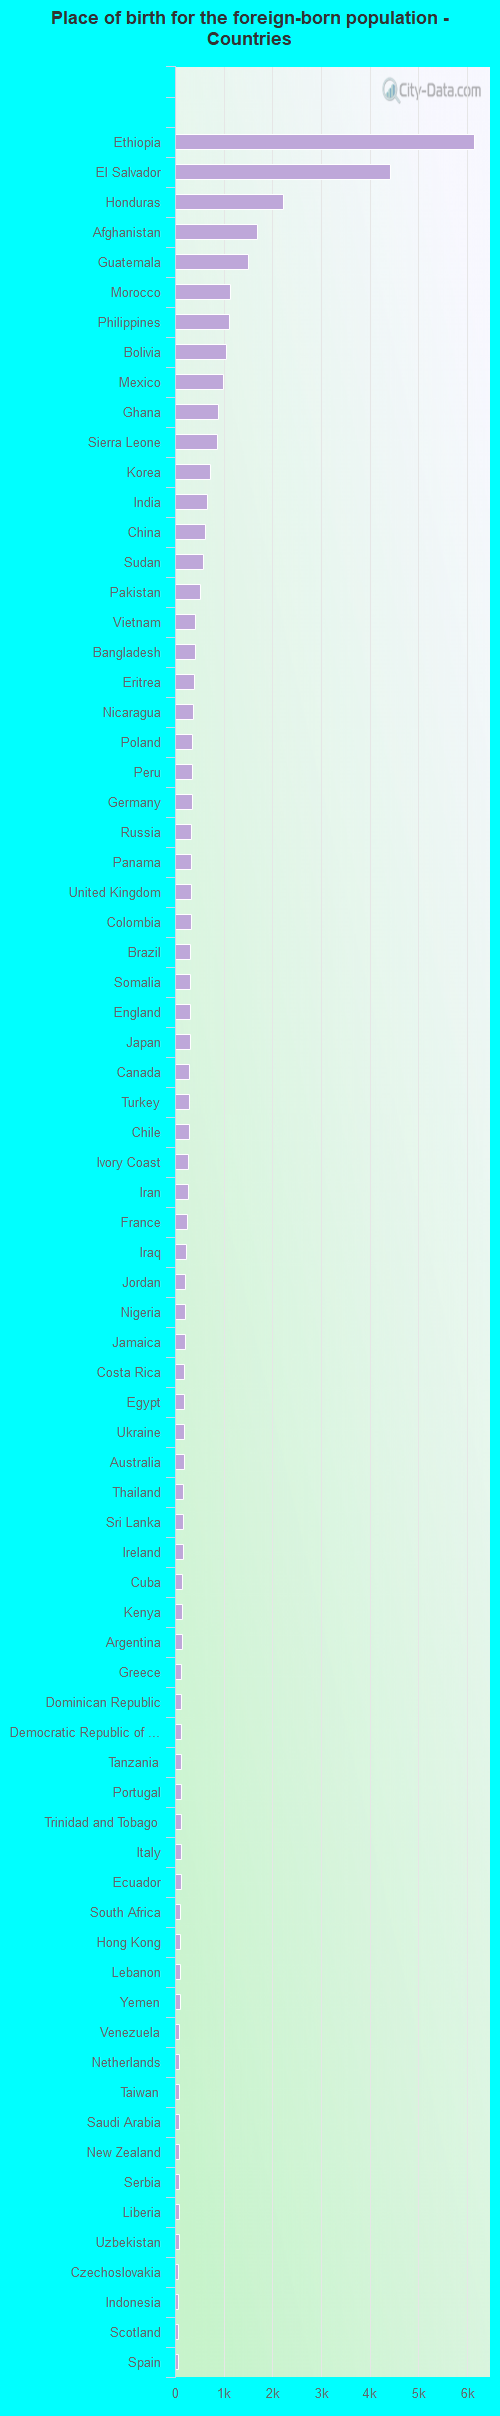
Place of birth for residents in Alexandria 13,685 Americas13,398 Latin America12,546 Africa10,026 Central America8,921 Asia7,513 Eastern Africa3,842 South Central Asia3,643 Europe2,697 South America2,483 Western Africa1,943 Northern Africa1,907 Eastern Asia1,884 South Eastern Asia1,520 Eastern Europe1,202 Western Asia915 Northern Europe805 China768 Western Europe674 Caribbean439 Southern Europe351 Middle Africa294 Oceania287 Northern America270 Australia and New Zealand Subregion109 Southern Africa6,143 Ethiopia4,410 El Salvador2,223 Honduras1,679 Afghanistan1,508 Guatemala1,131 Morocco1,114 Philippines1,039 Bolivia982 Mexico882 Ghana853 Sierra Leone716 Korea656 India615 China582 Sudan512 Pakistan413 Vietnam410 Bangladesh382 Eritrea376 Nicaragua351 Poland345 Peru340 Germany333 Russia331 Panama322 United Kingdom322 Colombia314 Brazil312 Somalia310 England304 Japan287 Canada280 Turkey279 Chile273 Ivory Coast270 Iran253 France216 Iraq207 Jordan204 Nigeria199 Jamaica193 Costa Rica192 Egypt191 Ukraine190 Australia172 Thailand167 Sri Lanka161 Ireland154 Cuba142 Kenya138 Argentina133 Greece130 Dominican Republic128 Democratic Republic of Congo (Zaire)128 Tanzania127 Portugal121 Trinidad and Tobago117 Italy115 Ecuador109 South Africa102 Hong Kong99 Lebanon96 Yemen91 Venezuela89 Netherlands87 Taiwan86 Saudi Arabia80 New Zealand78 Serbia74 Liberia72 Uzbekistan69 Czechoslovakia64 Indonesia59 Scotland59 Spain54 Laos53 Uganda47 Belgium39 Azerbaijan39 Romania36 Norway36 Croatia36 Switzerland36 Kazakhstan35 Belarus34 Albania33 Bosnia and Herzegovina33 Syria32 Singapore29 Bulgaria28 Guyana27 Cameroon26 Kuwait25 Haiti23 North Macedonia (Macedonia)23 Zimbabwe22 Burma (Myanmar)22 United Arab Emirates21 Uruguay19 Togo17 Georgia17 Lithuania16 Denmark15 Armenia13 Latvia12 Israel12 Barbados9 Moldova7 Nepal6 Malaysia4 Bhutan3 Cambodia1 Austria
Grandparents responsible for own grandchildren in Alexandria
Grandparents (30 to 59 years) White / Caucasian 31 64.6% Responsible for grandchildren17 35.4% Not responsible for grandchildrenBlack or African American 139 100.0% Not responsible for grandchildrenAsian 40 100.0% Not responsible for grandchildrenOther race 24 66.5% Responsible for grandchildren12 33.5% Not responsible for grandchildrenTwo or more races 172 68.4% Responsible for grandchildren80 31.6% Not responsible for grandchildrenWhite alone, not Hispanic / Latino 31 69.7% Responsible for grandchildren14 30.3% Not responsible for grandchildrenHispanic or Latino 29 33.5% Responsible for grandchildren58 66.5% Not responsible for grandchildrenGrandparents (60 years and over) White / Caucasian 24 15.7% Responsible for grandchildren127 84.3% Not responsible for grandchildrenBlack or African American 17 5.9% Responsible for grandchildren276 94.1% Not responsible for grandchildrenAsian 23 37.6% Responsible for grandchildren39 62.4% Not responsible for grandchildrenOther race 42 26.2% Responsible for grandchildren119 73.8% Not responsible for grandchildrenTwo or more races 11 2.9% Responsible for grandchildren366 97.1% Not responsible for grandchildrenWhite alone, not Hispanic / Latino 15 10.3% Responsible for grandchildren134 89.7% Not responsible for grandchildrenHispanic or Latino 33 15.5% Responsible for grandchildren181 84.5% Not responsible for grandchildren