Races in Alamo Heights, Texas (TX) Detailed Stats
Ancestries, Foreign-born residents, place of birth
Settings
X


Recent posts about races in Alamo Heights, Texas on our local forum with over 2,400,000 registered users:
 | Alamo Heights Bullying Issue (26 replies) |
| Alamo Heights Students Feel Discrimination (54 replies) |
| African American/Indian Family relocating from Pittsburgh (11 replies) |
| From Canada to San Antonio with children (55 replies) |
| moving to San Antonio (10 replies) |
| Olmos Park, Monte Vista, King William, Terrell Hills, Alamo Heights (16 replies) |
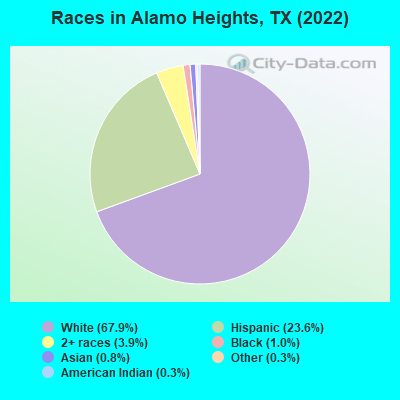
According to 2022 data, the most numerous races in Alamo Heights, TX are Hispanic (1,791 residents), White alone (5,149 residents), and Black alone (78 residents). 87.1% of Alamo Heights residents speak English at home. 5.8% of Alamo Heights, TX residents are foreign-born (1.8% born in Latin America, 1.4% born in North America, 1.3% born in Europe, 0.7% born in Asia), which is 191.7% less than the foreign-born rate of 17.0% across the entire state of Texas.
Race distribution in Alamo Heights
2000
2022

- 6,14684.0%White alone
- 99213.6%Hispanic
- 690.9%Two or more races
- 620.8%Asian alone
- 400.5%Black alone
- 90.1%American Indian alone
- 10.01%Other race alone

-
- 5,14967.9%White alone
- 1,79123.6%Hispanic
- 2983.9%Two or more races
- 781.0%Black alone
- 630.8%Asian alone
- 220.3%Other race alone
- 190.3%American Indian alone
2000
2022
-
- 10,933,31352.4%White alone
- 6,669,66632.0%Hispanic
- 2,364,25511.3%Black alone
- 554,4452.7%Asian alone
- 230,5671.1%Two or more races
- 68,8590.3%American Indian alone
- 19,9580.10%Other race alone
- 10,7570.05%Native Hawaiian and Other
Pacific Islander alone

-
- 12,070,64240.2%Hispanic
- 11,683,43038.9%White alone
- 3,508,70611.7%Black alone
- 1,608,1735.4%Asian alone
- 956,5603.2%Two or more races
- 125,7630.4%Other race alone
- 47,0230.2%American Indian alone
- 29,2750.10%Native Hawaiian and Other
Pacific Islander alone

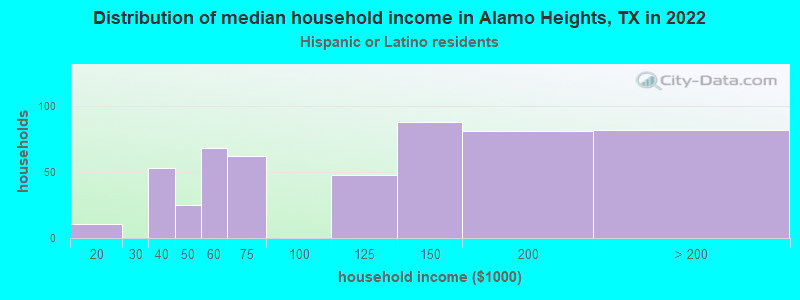
Income and house value in Alamo Heights
- Median household income in 2022
- $174,247White non-Hispanic householders
- $93,721Two or more races householders
- $113,247Hispanic or Latino race householders
- Median 2022 house value
- $836,066White Non-Hispanic householders
- $345,314Asian householders
- $558,596Some other race householders
- $863,285Two or more races householders
- $589,877Hispanic or Latino householders
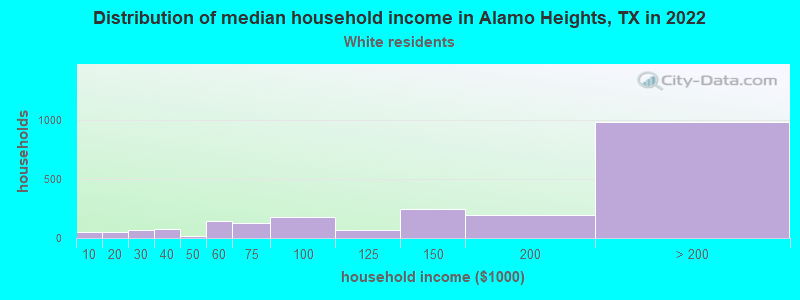
Household income for White non-Hispanic householders
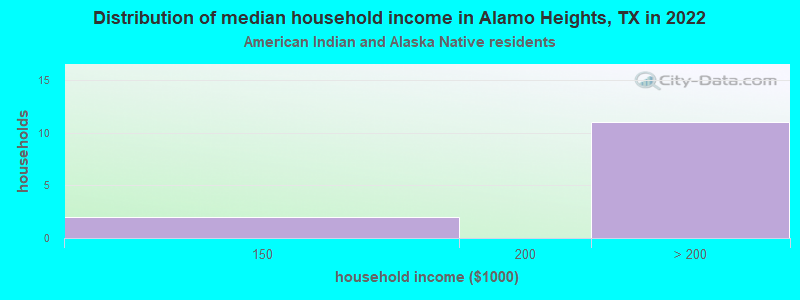
Household income for American Indian and Alaska Native householders
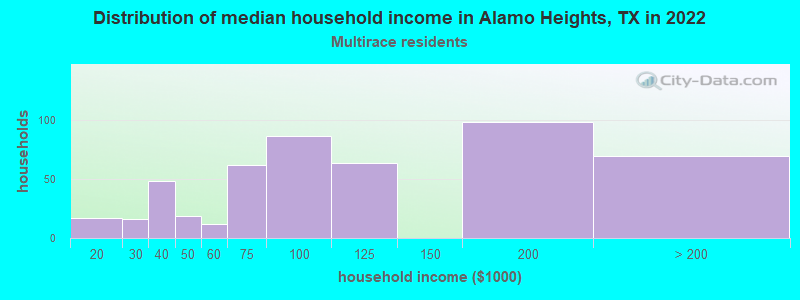
Household income for Two or more races householders
Household income for Hispanic or Latino race householders
Median age by race in Alamo Heights
- 44.4Median age for White residents
- 43.1Males
- 45.6Females
- 49.3Median age for Black or African American residents
- -687,242,797.7Males
- 47.7Females
- 28.2Median age for American Indian / Alaska Native residents
- -656,656,656.0Males
- 28.4Females
- 34.8Median age for Asian residents
- -678,362,572.4Males
- -650,273,223.4Females
- -674,441,204.4Median age for Native Hawaiian / Pacific Islander residents
- -596,986,816.7Males
- -748,387,096.0Females
- 27.1Median age for Other race residents
- -688,172,042.3Males
- 11.9Females
- 27.2Median age for Two or more races residents
- 25.7Males
- 33.0Females
- 43.4Median age for White alone residents
- 44.7Males
- 40.7Females
- 31.2Median age for Hispanic or Latino residents
- 27.0Males
- 55.1Females
Owner/renter occupied households by race in Alamo Heights
- House owners and renters - White residents
- 1,68278.0%Owner occupied
- 47522.0%Renter occupied
- House owners and renters - Black or African American residents
- 14100.0%Owner occupied
- House owners and renters - American Indian / Alaska Native residents
- 19100.0%Owner occupied
- House owners and renters - Asian residents
- 15100.0%Owner occupied
- House owners and renters - Other race residents
- 11100.0%Renter occupied
- House owners and renters - Two or more races residents
- 24048.3%Owner occupied
- 25751.7%Renter occupied
- House owners and renters - White alone residents
- 1,93179.7%Owner occupied
- 49320.3%Renter occupied
- House owners and renters - Hispanic or Latino residents
- 27752.6%Owner occupied
- 24947.4%Renter occupied
Language usage in Alamo Heights
- English speakers - Total
- 87.1% of residents of Alamo Heights speak English at home.
- 10.9% of residents speak Spanish at home
- 67184.7%Speak English very well
- 12115.3%Speak English less than very well
- 2.7% of residents speak other language at home
- 197100.0%Speak English very well
- English speakers - Born in the United States
- 92.9% of residents of Alamo Heights speak English at home.
- 4.2% of residents speak Spanish at home
- 6767.7%Speak English very well
- 3232.3%Speak English less than very well
- 3.2% of residents speak other language at home
- 75100.0%Speak English very well
- English speakers - Native, born elsewhere
- 60.5% of residents of Alamo Heights speak English at home.
- 36.0% of residents speak Spanish at home
- 3482.9%Speak English very well
- 717.1%Speak English less than very well
- English speakers - Foreign-born
- 63.7% of residents of Alamo Heights speak English at home.
- 20.7% of residents speak Spanish at home
- 5764.0%Speak English very well
- 3236.0%Speak English less than very well
- 16.5% of residents speak other language at home
- 71100.0%Speak English very well
White (Caucasian) - Speak only English
| Native: | 100.0% (4,201) |
| Foreign-born: | 100.0% (144) |
White (Caucasian) - Speak another language
| Native: | 5.8% (243) |
| Foreign-born: | 26.8% (39) |
Asian - Speak another language
| Native: | 87.2% (6) |
| Foreign-born: | 28.3% (16) |
Two or more races - Speak another language
| Native: | 31.0% (559) |
| Foreign-born: | 100.0% (61) |
White alone - Speak only English
| Native: | 95.9% (4,547) |
| Foreign-born: | 75.6% (178) |
White alone - Speak another language
| Native: | 4.2% (197) |
| Foreign-born: | 23.3% (55) |
Hispanic or Latino - Speak only English
| Native: | 66.5% (1,024) |
| Foreign-born: | 31.5% (41) |
Hispanic or Latino - Speak another language
| Native: | 34.1% (525) |
| Foreign-born: | 70.2% (92) |
Foreign-born residents in Alamo Heights
442 residents are foreign born (1.8% Latin America, 1.4% North America, 1.3% Europe, 0.7% Asia).
| This city: | 5.8% |
| Texas: | 17.1% |


Marital status for residents in Alamo Heights
Marital status - White (Caucasian) population 15 years and over
- Males
- 23.6%Never married
- 63.4%Now married
- 0.3%Separated
- 1.5%Widowed
- 11.1%Divorced
- Females
- 24.3%Never married
- 54.9%Now married
- 0.0%Separated
- 6.9%Widowed
- 13.9%Divorced
Women who gave birth in the past 12 months
| Now married: | 100.0% (34) |
| Unmarried: | 0.0% (0) |
Women who did not give birth in the past 12 months
| Now married: | 49.1% (456) |
| Unmarried: | 50.9% (473) |
Marital status - Black or African American population 15 years and over
- Males
- 0.0%Never married
- 100.0%Now married
- 0.0%Separated
- 0.0%Widowed
- 0.0%Divorced
- Females
- 6.5%Never married
- 56.5%Now married
- 0.0%Separated
- 0.0%Widowed
- 37.0%Divorced
Women who did not give birth in the past 12 months
| Now married: | 100.0% (29) |
| Unmarried: | 0.0% (0) |
Marital status - American Indian / Alaska Native population 15 years and over
- Males
- 0.0%Never married
- 100.0%Now married
- 0.0%Separated
- 0.0%Widowed
- 0.0%Divorced
- Females
- 93.8%Never married
- 0.0%Now married
- 0.0%Separated
- 0.0%Widowed
- 6.3%Divorced
Women who did not give birth in the past 12 months
| Now married: | 0.0% (0) |
| Unmarried: | 100.0% (22) |
Marital status - Asian population 15 years and over
- Males
- 60.5%Never married
- 39.5%Now married
- 0.0%Separated
- 0.0%Widowed
- 0.0%Divorced
- Females
- 0.0%Never married
- 66.7%Now married
- 0.0%Separated
- 0.0%Widowed
- 33.3%Divorced
Women who gave birth in the past 12 months
| Now married: | 0.0% (0) |
| Unmarried: | 100.0% (7) |
Marital status - Other race population 15 years and over
- Males
- 0.0%Never married
- 100.0%Now married
- 0.0%Separated
- 0.0%Widowed
- 0.0%Divorced
- Females
- 53.3%Never married
- 46.7%Now married
- 0.0%Separated
- 0.0%Widowed
- 0.0%Divorced
Women who did not give birth in the past 12 months
| Now married: | 46.7% (10) |
| Unmarried: | 53.3% (11) |
Marital status - Two or more races population 15 years and over
- Males
- 77.0%Never married
- 23.0%Now married
- 0.0%Separated
- 0.0%Widowed
- 0.0%Divorced
- Females
- 44.3%Never married
- 44.6%Now married
- 1.1%Separated
- 0.0%Widowed
- 10.0%Divorced
Women who did not give birth in the past 12 months
| Now married: | 29.6% (107) |
| Unmarried: | 70.4% (255) |
Marital status - White alone, not Hispanic / Latino population 15 years and over
- Males
- 20.2%Never married
- 65.8%Now married
- 0.4%Separated
- 1.7%Widowed
- 11.9%Divorced
- Females
- 24.1%Never married
- 54.9%Now married
- 0.0%Separated
- 6.1%Widowed
- 14.9%Divorced
Women who gave birth in the past 12 months
| Now married: | 100.0% (46) |
| Unmarried: | 0.0% (0) |
Women who did not give birth in the past 12 months
| Now married: | 51.0% (622) |
| Unmarried: | 49.0% (596) |
Marital status - Hispanic or Latino population 15 years and over
- Males
- 61.3%Never married
- 36.2%Now married
- 0.0%Separated
- 0.0%Widowed
- 2.5%Divorced
- Females
- 35.9%Never married
- 52.2%Now married
- 0.0%Separated
- 5.8%Widowed
- 6.1%Divorced
Women who did not give birth in the past 12 months
| Now married: | 28.4% (78) |
| Unmarried: | 71.6% (197) |
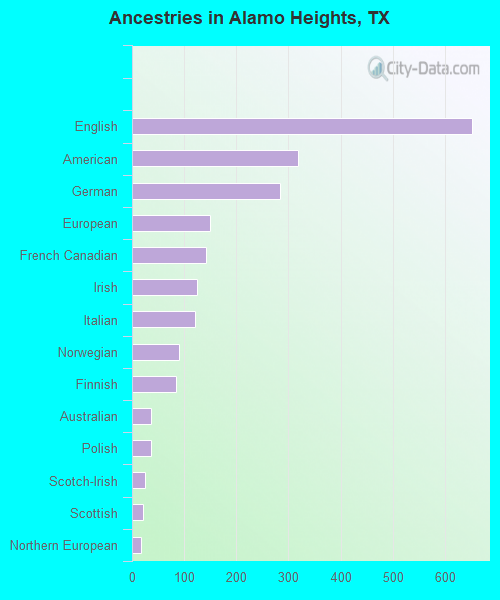
Ancestries in Alamo Heights

- 65216.9%English
- 3188.2%American
- 2837.3%German
- 1493.9%European
- 1413.6%French Canadian
- 1243.2%Irish
- 1213.1%Italian
- 902.3%Norwegian
- 842.2%Finnish
- 371.0%Australian
- 360.9%Polish
- 240.6%Scotch-Irish
- 220.6%Scottish
- 180.5%Northern European
- 30.08%British
- 30.08%French
Geographical mobility in Alamo Heights

- Same house 1 year ago
- 3,69984.6%White (Caucasian)
- 7899.3%Black or African American
- 66100.0%American Indian / Alaska Native
- 3250.3%Asian
- 1,73489.8%Two or more races
- 4,39585.8%White alone, not Hispanic / Latino
- 1,42582.8%Hispanic or Latino

-
- Moved within same county
- 3959.0%White / Caucasian
- 3047.4%Asian
- 1638.4%Two or more races
- 4398.6%White alone, not Hispanic / Latino
- 19511.4%Hispanic or Latino

-
- Moved within same state
- 2195.0%White / Caucasian
- 3544.4%Other race
- 2414.7%White alone, not Hispanic / Latino
- 301.7%Hispanic or Latino

-
- Moved from different state
- 651.5%White / Caucasian
- 311.6%Two or more races
- 521.0%White alone, not Hispanic / Latino
- 462.7%Hispanic or Latino

-
- Moved from abroad
- 3949.0%Other race
- 342.0%Hispanic or Latino

Children Nativity (place of birth) in Alamo Heights
Place of birth for residents in Alamo Heights
![Place of birth for the foreign-born population - Regions]()
- 242Americas
- 136Latin America
- 105Northern America
- 100Europe
- 100Northern Europe
- 87Central America
- 53Asia
- 41South America
- 32Oceania
- 32Australia and New Zealand Subregion
- 30Eastern Asia
- 23South Central Asia
- 13Africa
- 13Southern Africa
- 8Caribbean

![Place of birth for the foreign-born population - Countries]()
- 105Canada
- 66Mexico
- 42United Kingdom
- 41Argentina
- 32Australia
- 30Korea
- 23India
- 13South Africa
- 10Guatemala
- 10Honduras
- 8Cuba

Grandparents responsible for own grandchildren in Alamo Heights
Zip codes: 78209.